Genetic variability and selection for laticiferous system characters
in
Hevea brasiliensis
Paulo de Souza Gonçalves
1, Átila Bento Beleti Cardinal
2, Reginaldo Brito da Costa
3,
Nelson Bortoletto
4and Lígia Regina Lima Gouvêa
51
APTA, Instituto Agronômico, Programa Seringueira, Campinas, SP, Brazil.
2APTA, Instituto Agronômico, Pós-graduação, Bolsista FAPESP, Campinas, SP, Brazil.
3UCDB, Programa Desenvolvimento Local, Campo Grande, MS, Brazil.
4APTA, Regional do Noroeste Paulista, Votuporanga, SP, Brazil.
5APTA, Instituto Agronômico, Bolsista CNPq, Campinas, SP, Brazil.
Abstract
Six laticiferous system characters were investigated in 22 three-year-old, half-sib rubber tree [Hevea brasiliensis (Willd. ex Adr. de Juss.) Muell.-Arg.] progenies, evaluated at three sites (Votuporanga, Pindorama and Jaú, all in the São Paulo State, Brazil). The traits examined were: average rubber yield (Pp), average bark thickness (Bt), number of latex vessel rings (Lv), average distance between consecutive latex vessel rings (Dc), density of latex vessels per 5 mm per ring averaged over all rings (Dd) and the diameter of the latex vessels (Di). The joint analysis showed that site effect and progeny x sites interaction were significant for all traits, except Lv. Estimates of individual heritabilities across the three sites were high for Bt; moderate for Lv, Pp and Dc; low for Dd and very low for Di. Genetic correlations in the joint analysis showed high positive correlations between Pp and the other traits. Selecting the best five progenies would result in genetic gains of 24.91% for Pp while selecting best two plants within a progeny would result in a Pp genetic gain of 30.98%.
Key words: Hevea brasiliensis, rubber yield, laticiferous traits, genetic parameters.
Received: August 7, 2004; Accepted: April 12, 2005.
Introduction
The rubber tree [Hevea brasiliensis(Willd. ex Adr. de
Juss.) Muell.-Arg.] is a perennial crop which has a long generative and testing cycle for individual trees in that it normally takes about four to five years for one generative cycle (excluding a seven to ten years of evaluation period for perennial performance) and about 20 to 30 years for one testing cycle from the time of cross-pollination (Tan, 1987).
The economic product of the tree is latex (a cytoplas-mic fluid from the laticiferous cells), which can be continu-ally extracted from the tree by repeatedly slicing off a thin layer of trunk bark in a process called “tapping”. Latex is typically contained in tubes and cells collectively known as laticifers, branched or unbranched tubular structures which in many species form a very complex laticiferous system by anastomosis between tube. (Gomez, 1982).
In principle, studying the biometrical genetics of the laticiferous system should shed light on the pattern of
in-heritance in rubber trees, one potentially useful aspect of such a study being that it could assist breeders in the choice of parents when planning breeding programs. Several workers (Tan, 1981; Gonçalveset al.,1999, Costaet al.,
2002) have concluded that yield variation can be largely ac-counted for by additive genetic variance.
The purpose of our present study was to provide fur-ther estimates of heritabilities and genetic gains for the laticiferous system (bark thickness, number of latex vessel rings, distance between consecutive latex vessel rings, den-sity of latex vessels per 5 mm averaged over all rings) and rubber yield in trees at three different sites and also to deter-mine genetic and phenotypic associations between these traits.
Material and Methods
Plant material and site locations
Our sample consisted of 22 three-year-old progenies obtained from open-pollinated seeds of clones pheno-typically selected from a H. brasiliensis population of Asian origin. The following parental clones were selected:
Send correspondence to Paulo de Souza Gonçalves. Instituto Agronômico de Campinas, Programa Seringueira, Caixa Postal 28, 13001-970 Campinas, SP, Brazil. E-mail: [email protected].
AVROS 49, AVROS 255, AVROS 352, AVROS 363, AVROS 1328, AVROS 1126, C 228, C 259, C 297, C 318, GT 127, GT 711, PB 49, PB 86, PB 5/63, PR 107, RRIM 513, RRIM 600, Tjir 1 and Tjir 16.
The progeny tests were set up at three different re-gional poles on the plateau region of the Brazilian state of São Paulo, these poles belonging to the São Paulo state Ag-ribusiness Technology Agency (APTA).
The Center-west Regional Pole, is at Jaú (22°17’ S, 48°34’ W; altitude 580 m) where the soil is a Koandiudox and the topography is flat and well-drained. An Aw (Köppen) climate predominantes in this region which has a well-defined dry season, an annual mean temperature of 21.6°, a mean annual rainfall of about 1.344 mm and an av-erage humidity of about 70% with extremes of 77% in Feb-ruary (summer) and 59% in August (winter).
The Center-north Regional Pole is at Pindorama (21°13’ S; 4°856’ W; altitude 560 m) where the soil is Paleudox. The climate is tropical, with a wet summer and a dry winter period. Mean monthly temperatures vary from 16.6 to 28.9°C, and annual mean rainfall is 1,390 mm. The period from October to April usually has favorable precipi-tation for growth and production. Rainfall deficit and low temperatures occur from May to September.
The Northwest Regional Pole at Votuporanga (20°25’ S; 49°50’ W; altitude 450 m) has a Paleudalf soil and tropical climate with a hot wet summer and a dry winter with low temperatures and rainfall. Mean monthly temper-ature varies from 20 to 25 °C and annual mean rainfall from 1,087 to 1,537 mm. The winter drought varies from four to six dry months, with an average water deficiency of 180 mm.
The rubber tree seeds were collected at the Experi-mental Center of the Campinas Agronomic Institute (Instituto Agronômico Campinas (IAC), Campinas, São Paulo, Brazil), germinated in polyethylene bags at the three experimental stations and taken to their definitive planting locations when the seedlings had two leaf whorls. In the field the seedlings (henceforth called progenies) were planted according to a randomized complete block design with 22 progenies, five replications and 10 plants per plot spaced at 1.5 x 1.5 m in single rows. The progenies were as-sessed when they were three years old.
Measurements
Determination of rubber yield (Pp) was made using the principle of the Hamaker-Morris-Mann test (HMM) (Tan and Subramanian, 1976). For latex vessel determina-tion, virgin bark sample plugs were removed from the trunk at a position 20 cm from the ground on the opposite side to that of the tappings panel. The traits examined were: Aver-age bark thickness (Bt); number of latex vessel rings (Lv); average distance between consecutive latex vessel rings (Dc); density of latex vessels per 5 mm per ring averaged over all rings (Dd); and the diameter of the latex vessel
(Di), detailed procedures for these measurements having been described by Gonçalveset al.(1995).
Data analyses
Individual analyses of variance were carried out on the data for each plant. For the joint analysis of all the data sets we used a mathematical model which considered sites and progenies as random effects and was equivalent to the following equation described by Cruz and Regazzi (1994):
Yijk=m+rk+pi+aj+paij+eijk
whereYijkis the observed value of theith progeny of thejth
site in thekth replication;mthe general mean;rkthe effect
of thekth replication;pithe effect of theith open-pollinated
progeny;ajthe effect of thejth site,paijthe effect of theith
progenyith and jth site andeijkthe effect of the kth ortet
within theith progeny in thejth site replication.
The open-pollinated offsprings were assumed to be half-sibs. Components of variance due to replication within sites (s$b2), phenotypic variance due to differences among
plants within progenies (s$w2), environmental variance
among progenies (s$e2), genotypic variance among progeny
means (s$g2), genotypic variance due to differences among
plants within progenies (s$gw2 ) were calculated from the
ex-pectations of mean squares (Vencovsky and Barriga, 1992). All these analyses were performed using the ‘Genes’ com-puter program, Windows version (Cruz, 2001). The total phenotypic variance (s$pt2) was obtained using the
expres-sion:
$ $ $ $ $
spt2 =sw2 +se2+sg2+s2b
Heritabilities
Heritabilities of individual plants h(hi
2), within
prog-eny (hw
2), and among progeny means (
hx
2
) levels for each progeny test were estimated as:
hi
g
g e w
2
2
2 2 2
4 =
+ +
$
$ $ $
s
s s s
hw gw
w
2 2
2
=$ $ s
s
h
MSP nr
x g
2 2
= s$ ,
where n is the harmonic mean of the number of plants
within plots, r the number of replications and MSP the
mean square of the progenies.
The joint analysis heritability estimates for individual plants (hi
2) and half-sib progenies mean ( hx
2) were used
ac-cording to Vencovsky and Barriga (1992), as follows:
hi
g
g ge e w
2
2
2 2 2 2
3 =
+ + +
$
$ $ $ $
s
h
a ar arn
x
g
g ge e w
2
2
2 2 2 2
=
+ + +
$
$ ($ / ) ($ / ) ($ / )
s
s s s s ,
where,s$ge
2 is the variance due to genotypic-environment
in-teraction,athe number of sites,rthe number of replications
andnthe harmonic mean of the number of plants within a
plot.
The coefficients of genotypic variation (CVg%) for
individual and joint analyses were estimated using the for-mula described by Vencovsky (1983):
CV
x
g
g
%= 100 $
2
s
Similarly, the phenotypic and experimental variation coefficients were estimated, wherexrepresents the general
mean of the trait.
Genetic gain from selection among progeny (Gg) and
within progeny (Gw) levels was computed using Falconer
and Mackay (1996) formulas:
G k
r nr
g
A
g e w
=
+ +
1 2
2 2 2
4
$
$ ($ / ) ($ / )
s
s s s
Gw k A w =3 4 2 2 2 $ $ s s
wherek1is the among progeny selection intensity (45%)
andk2the within progeny selection intensity (10%).
The genetic gains expressed as a percent of the among and within progeny means were estimated using the for-mula:
G G
x
g g
%= .100
G G
x
w w
%= .100,
wherexis the general mean.
To examine the relationship among the yield traits of
Hevea plants at different sites, genetic (rg(xy)) and
phenotypic (rp(xy)) correlation coefficients were calculated
according to Kempthorne (1966), as follows:
rg xy Cov g xy gx gy ( ) ( ) $ .$ =
s2 s2
rp xy Cov p xy px py ( ) ( ) $ .$ =
s2 s2
where Covg(xy) and Covp(xy) are the genotypic and
phenotypic covariances for traitsxandyrespectively;s$gx2
ands$px2
are the genotypic and phenotypic variances for trait
x;s$gy2
ands$py2
are the genotypic and phenotypic variances for traity. Correlation analyses were performed using
ver-sion 1.0 of the ‘Selegen’ computer program (Resende and Oliveira, 1997).
The significance of these correlations was tested us-ing the simple correlation table in Fisher and Yates (1971) for simple correlation for 5% and 1% probabilities. The genotypic and phenotypic correlation coefficients were tested using the degrees of freedom of the error.
Results and Discussion
Individual analysis of variance for all locations With the exception of the number of latex vessel rings (Lv) in the Votuporanga population and the density of latex vessels per ring (Dd) and latex vessel diameter (Di) in both the Votuporanga and Pindorama populations, the six traits studied showed significant differences (p < 0.05 and p < 0.01) in the individual analyses of variance (Table 1). This suggests that differences were attributable to genetic causes and that selection within eachHeveapopulation
in-cluded in this study is possible. Average rubber yield (Pp) was 0.85 g per individual plant (ortet) the lowest Pp value was 0.61 g per ortet and occurred in the Votuporanga popu-lation while the highest Pp value was 0.99 g per ortet in the Pindorama population, 62% higher than in the Votuporanga population. At the three locations bark thick-ness (Bt) averaged 3.80 mm per ortet, the lowest average Bt value being 3.76 mm per ortet in the Jaú population and the highest 3.85 mm per ortet in the Votuporanga population, 3% higher than in the Jaú population.
The number of latex vessels (Lv) averaged 3.29 units per ortet, the lowest average Lv value being 3.05 units per ortet in the Votuporanga population and the highest 3.15 units per ortet in the Jaú population, 3% higher than in the Votuporanga population. Although the experimental sites were at similar latitudes, longitude and altitude in the São Paulo plateau region the performance of the progenies var-ied, suggesting the involvement of other environmental factors such as soil type, fertility and structure.
Joint analysis of variance
The joint analysis of variance showed highly signifi-cant (p > 0.01) differences among progenies for Pp, Bt, Lv and Dc (Table 2). These variations indicate good prospects for both selection program and general continuity in the
Heveagenetic breeding program. The experimental
coeffi-cients of variation (CV%) showed were high for Pp
(CVe= 32.65%), moderately high for Lv (CVe= 12.18%)
and Dc (CVe = 12.12%) and moderately low for Bt
(CVe= 9.04%) and Di (CVe= 9.43%). These values express
inter-Table 1- Mean squares, coefficient of experimental variation (CVe%) and coefficient of genetic variation (CVg%) for six different traits of the bark
laticiferous system in 22 three-years-old open pollinatedHeveaprogenies growing at three sites in the Brazilian State São Paulo.
Sites Traits1 Analysis of variance mean square values2 Mean CV
e% CVg%
Replications (R) Progenies (P) P x R Within plot
Votuporanga Pp 0.4452 0.8770** 0.2853 0.2688 0.61 7.67 20.62
Bt 1.5492 5.9193** 0.8562 0.6588 3.85 8.27 8.99
Lv 0.8551 1.6018n.s. 1.1226 0.5879 3.05 12.12 3.54
Dc 0.0095 0.0449** 0.0108 0.0085 0.32 11.37 9.02
Dd 31.2553 73.3875n.s. 77.1367 40.8389 46.30 6.63
-Di 105.3573 17.5892n.s. 20.1426 14.2827 19.00 9.21
-Pindorama Pp 0.5372 7.0787** 1.0143 0.5807 0.99 34.91 34.84
Bt 1.5766 11.9116** 0.9609 0.6098 3.80 8.80 12.12
Lv 1.2880 4.3488** 1.0368 0.6771 3.06 11.44 10.34
Dc 0.0102 0.0378** 0.0138 0.0082 0.32 12.67 6.82
Dd 149.8487 105.5731n.s. 104.7621 46.4484 45.03 7.78 0.28
Di 27.0902 34.7806n.s. 28.5751 12.6741 17.16 10.79 2.05
Jaú Pp 0.7282 0.9959* 0.4954 0.2529 0.94 28.75 16.68
Bt 2.2674 8.1624** 1.3206 0.5676 3.76 10.58 9.83
Lv 32.7214 6.6046** 1.5609 0.6762 3.15 13.92 10.22
Dc 0.0217 0.0354* 0.0104 0.0475 0.25 13.87 8.75
Dd 267.8469 140.5422** 49.4823 21.4847 43.74 5.60 3.10
Di 133.1510 48.3380** 25.8348 9.9836 17.52 10.08 3.84
*p < 0.05; **p < 0.01; n.s. = not significant.
1Key (units in parenthesis): Pp = rubber yield (g); Bt = bark thickness (mm); Lv = number of latex vessel rings; Dc = average distance (
mm) between
con-secutive latex vessel rings (based on all rings); Dd = density of latex vessels per 5mm per ring, averaged over all rings; Di = diameter (mm) of latex vessels. 2Degrees of freedom were: 5 for replication, 21 for progeny and 105 for residual for all traits.
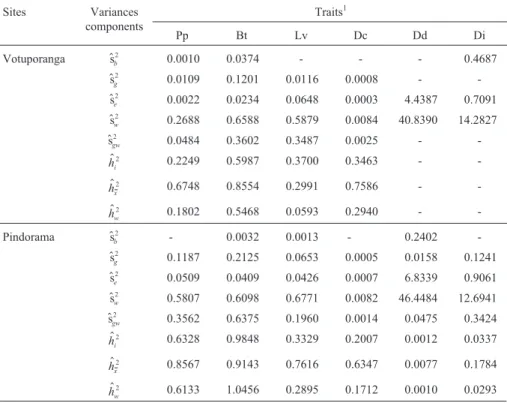
Table 2- Estimates of variance due to replication within sites ($sb
2), genetic variance among progeny means ($s
g
2), environmental variance among progenies
($se
2), phenotypic variance within progenies ($s
w
2), genotypic variance due to differences among plants within progenies ($s
gw
2), heritabilities of individual
plants (h$i
2), among progeny means (h$ x
2), and within progeny (h$ ) w
2 levels for five different laticiferous system in 22 three-years-old open-pollinatedHevea
progenies growing at three sites in the Brazilian State of São Paulo.
Sites Variances
components
Traits1
Pp Bt Lv Dc Dd Di
Votuporanga $sb
2 0.0010 0.0374 - - - 0.4687
$
sg
2 0.0109 0.1201 0.0116 0.0008 -
-$
se
2 0.0022 0.0234 0.0648 0.0003 4.4387 0.7091
$
sw
2 0.2688 0.6588 0.5879 0.0084 40.8390 14.2827
$sgw
2 0.0484 0.3602 0.3487 0.0025 -
-$ hi
2 0.2249 0.5987 0.3700 0.3463 -
-$ hx
2 0.6748 0.8554 0.2991 0.7586 -
-$ hw
2 0.1802 0.5468 0.0593 0.2940 -
-Pindorama $sb
2 - 0.0032 0.0013 - 0.2402
-$
sg
2 0.1187 0.2125 0.0653 0.0005 0.0158 0.1241
$
se
2 0.0509 0.0409 0.0426 0.0007 6.8339 0.9061
$
sw
2 0.5807 0.6098 0.6771 0.0082 46.4484 12.6941
$sgw
2 0.3562 0.6375 0.1960 0.0014 0.0475 0.3424
$ hi
2 0.6328 0.9848 0.3329 0.2007 0.0012 0.0337
$ hx
2 0.8567 0.9143 0.7616 0.6347 0.0077 0.1784
$ hw
action effect was also significant on all studied traits. Ac-cording to Vencovsky (1969) the progeny x site interaction reflects the difference in viability among progenies and the correlation among materials for different traits.
Genetic and environmental parameters
The genotypic variation coefficient, (CVg%)
ex-presses the amount of existing genetic variation as a per-centage of the general mean (Table 1), and was higher for Pp and Bt followed by Lv in Pindorama (Pp = 34.84%, Bt = 12.12% and Lv = 10.34%), Jaú (Pp = 16.68%, Bt = 9.83% and Lv = 10.22%) and Votuporanga (Pp = 20.62%, Bt = 8.99% and Lv = 3.54%). These results confirmed the F test results for progeny differences and characterized these traits as being suitable for expressing the genetic variability of the population studied. These re-sults also agree with those reported by Gonçalveset al.
(1998) and Boocket al.(1995) for the same traits.
As a percentage of the total phenotypic variance based on individual plants (s$p2
) the genetic variance compo-nents among progenies for Pp accounted for 3.85% in the Votuporanga population, 7.87% in the Pindorama popula-tion and 15.82% in the Jaú populapopula-tion (Table 2). As a per-centage of phenotypic variance, the contribution of genotypic variance among progenies (s$g2
) was 17.09% for Bt (bark thickness) and 16.45% for Lv (number of latex vessel rings) in Jaú and was substantially greater than thes$g2
values for Bt (14.30%) and Lv (1.75%) in Votuporanga. On the other hand, the s$g2
values for Bt (24.17%) and Lv (8.30%) were substantially greater in Pindorama and
smaller in Votuporanga. In addition, except for the joint analysis, genotypic variance components among progeny means were always higher than those for the environmental effects (Table 2).
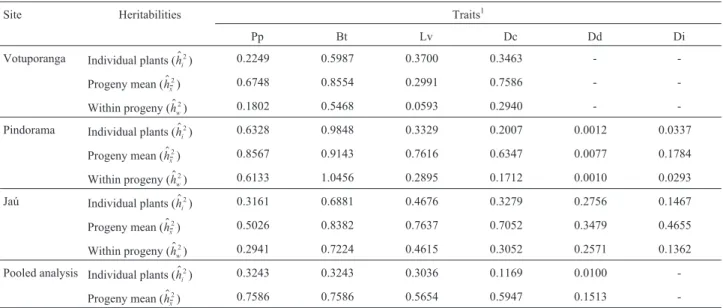
Heritabilities
On individual plant level, Pp heritabilities (h$ i
2)
mod-erately high for Votuporanga (0.22), Jaú (0.32) and Pindorama (0.63) while Bt (h$i
2) values were all high in that
they were 0.60 at Votuporanga, 0.69 at Jaú and 0.98 at Pindorama (Table 3). Our data agreed with that various au-thors (Costaet al., 2000a, b; Gonçalveset al.,1998, 1999;
Boocket al., 1995; Moretiet al., 1994) who reported
indi-vidual plant heritability values (h$ i
2) of 0.22 to 0.50 for Pp
(rubber yield) and from 0.45 to 0.73 for Bt, indicating that both these traits have moderately high heritability esti-mates. Our results indicate that there was a large amount of genetic variability in our population. The Lvh$
i
2values were
relatively high on an individual basis (0.37 for Votupo-ranga, 0.33 for Pindorama and 0.47 for Jaú) and also for be-tween progeny means (0.30 for Votuporanga, 0.76 for Pindorama and 0.76 for Jaú) and within progenies (0.06 for Votuporanga, 0.29 for Pindorama and 0.46 for Jaú). The Dd (density of latex vessels) h$
i
2 values were very low for
Pindorama and Jaú on an individual basis (0.001 for Pindo-rama and 0.28 for Jaú) and also between progeny means (0.01 for Pindorama and 0.35 Jaú) and within progenies 0.001 for Pindorama and 0.26 for Jaú), these moderately low heritability estimates indicating that there is a need to
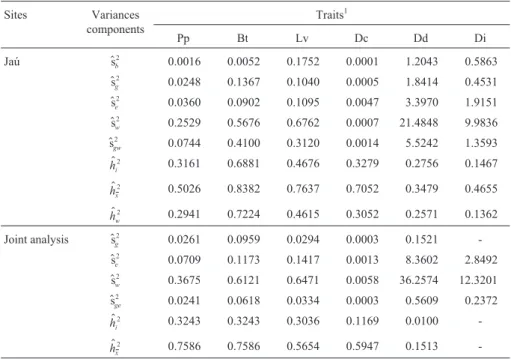
Table 2 (cont.)
Sites Variances
components
Traits1
Pp Bt Lv Dc Dd Di
Jaú $sb
2 0.0016 0.0052 0.1752 0.0001 1.2043 0.5863
$sg
2 0.0248 0.1367 0.1040 0.0005 1.8414 0.4531
$se
2 0.0360 0.0902 0.1095 0.0047 3.3970 1.9151
$sw
2 0.2529 0.5676 0.6762 0.0007 21.4848 9.9836
$sgw
2 0.0744 0.4100 0.3120 0.0014 5.5242 1.3593
$ hi
2 0.3161 0.6881 0.4676 0.3279 0.2756 0.1467
$ hx
2 0.5026 0.8382 0.7637 0.7052 0.3479 0.4655
$ hw
2 0.2941 0.7224 0.4615 0.3052 0.2571 0.1362
Joint analysis $sg
2 0.0261 0.0959 0.0294 0.0003 0.1521
-$se
2 0.0709 0.1173 0.1417 0.0013 8.3602 2.8492
$sw
2 0.3675 0.6121 0.6471 0.0058 36.2574 12.3201
$
sge
2 0.0241 0.0618 0.0334 0.0003 0.5609 0.2372
$ hi
2 0.3243 0.3243 0.3036 0.1169 0.0100
-$ hx
2 0.7586 0.7586 0.5654 0.5947 0.1513
-1Key (units in parenthesis): Pp = rubber yield (g); Bt = bark thickness (mm); Lv = number of latex vessel rings; Dc = average distance (
mm) between
increase the genetic variability for latex vessel density in these populations.
It is important to emphasize that these highly signifi-cant heritability estimates coupled with the large amount of variation observed within our rubber tree populations sug-gest that an effort to increase both yield and bark thickness through progeny selection would be rewarding.
Correlations
High and significant genetic and phenotypic correla-tions were found for Pp (rg= 0.94,rp= 0.85; both
signifi-cant at p < 0.01) and Lv (rg = 0.76, rg = 0.77; both
significant at p < 0.01) between Votuporanga and Jaú (Ta-ble 4).
There were high and significant Bt (bark thickness) and Lv (number of latex vessel rings) genetic (rg) and
phenotypic (rp) correlations between the Votuporanga and
Pindorama populations (rg = 0.59 and rp = 0.89 for Bt;
rg= 0.65,rp= 0.64 for Pp. All significant at p < 0.01) but the
correlations were low for the other traits (Table 4). The high correlations indicate that a single breeding program could satisfatorily serve both the Votuporanga and the Jaú popu-lations. This assertions is valid for both rubber yield,
num-Table 3- Heritability coefficients for six different laticiferous system traits of 22 three-year-old open-pollinatedHeveaprogenies growing at three sites in
the Brazilian State of São Paulo.
Site Heritabilities Traits1
Pp Bt Lv Dc Dd Di
Votuporanga Individual plants (h$i)
2 0.2249 0.5987 0.3700 0.3463 -
-Progeny mean (h$ )
x
2 0.6748 0.8554 0.2991 0.7586 -
-Within progeny (h$ ) w
2 0.1802 0.5468 0.0593 0.2940 -
-Pindorama Individual plants (h$ )
i
2 0.6328 0.9848 0.3329 0.2007 0.0012 0.0337
Progeny mean (h$ )
x
2 0.8567 0.9143 0.7616 0.6347 0.0077 0.1784
Within progeny (h$ ) w
2 0.6133 1.0456 0.2895 0.1712 0.0010 0.0293
Jaú Individual plants (h$i)
2 0.3161 0.6881 0.4676 0.3279 0.2756 0.1467
Progeny mean (h$x)
2 0.5026 0.8382 0.7637 0.7052 0.3479 0.4655
Within progeny (h$ ) w
2 0.2941 0.7224 0.4615 0.3052 0.2571 0.1362
Pooled analysis Individual plants (h$ ) i
2 0.3243 0.3243 0.3036 0.1169 0.0100
-Progeny mean (h$ )
x
2 0.7586 0.7586 0.5654 0.5947 0.1513
-1Key (units in parenthesis): Pp = rubber yield (g); Bt = bark thickness (mm); Lv = number of latex vessel rings; Dc = average distance (
mm) between
con-secutive latex vessel rings (based on all rings); Dd = density of latex vessels per 5 mm per ring, averaged over all rings; Di = diameter (mm) of latex
ves-sels.
Table 4- Genotypic (rg) and phenotypic (rp) correlations among Votuporanga (1), Pindorama (2) and Jaú (3) sites for rubber yield (Pp), bark thickness (Bt), number of latex vessel rings (Lv), average distance between consecutive latex vessel rings (Dc), density of latex vessels per ring (Dd), diameter of
latex vessels (Di) in 22 three-year-old open-pollinatedHeveaprogenies growing at three sites in the Brazilian state of São Paulo. Site 1 = Votuporanga,
site 2 = Pindorama, site 3 = Jaú.
Pp Bt
Sites Correlation types 2 3 Sites Correlation types 2 3
1 rg 0.6598** 0.9444** 1 rg 0.5907** 0.2679ns
rp 0.6430** 0.8460** rp 0.8901** 0.3920ns
2 rg - -0.1627ns 2 rg - 0.2320ns
rp - 0.1091ns rp - 0.5254*
Lv Dc
Sites Correlation types 2 3 Sites Correlation types 2 3
1 rg 0.0605ns 0.7569** 1 rg 0.3733ns 0.1664ns
rp -0.0088ns 0.7653** rp 0.4801* 0.6014ns
2 rg - 0.0841ns 2 rg - 0.2671ns
ber of latex vessel rings, which can be checked by the genetic correlation between locations (Vencovsky and Barriga, 1992).
Genetic and phenotypic correlation coefficients ob-tained for Votuporanga and Pindorama had fairly strong genetic correlations for Bt (rg= 0.59,rp= 0.89; both
signif-icant at p < 0.01) and medium for Pp (rg= 0.66,rp= 0.64
both significant at p < 0.01) and Dc (rg= 0.37,rp= 0.48;rp
significant at p < 0.05). The highest values however, were smaller than those found for the coefficients between Pindorama and Jaú. As in the previous analysis, these re-sults characterized the interaction for rubber yield, indi-cating that for these traits only one breeding program at one site will satisfy the needs of the other site involved.
In the joint analysis (Table 5) Pp and Dd had fairly strong positive genetic and phenotypic correlations (rg= 0.54,rp= 0.56; both significant at p < 0.01) suggesting
that selection for one trait should lead to strong positive in-direct responses in the other. This positive genetic associa-tion certainly needs to be verified by further studies across more sites. These findings for three-years-old progeny tri-als in São Paulo are the opposite to those reported for a
one-year-old progeny study in the Amazon where Gonçalveset al.(1984) found adverse genetic associations
between latex vessels density (Dd) and rubber yield (Pp) when selectively breeding H. brasiliensisfor rubber
pro-duction.
We observed high negative correlations between Lv and Dc (rg= -0.72,rp= -0.63; both significant at p < 0.01),
these findings agreeing with the results reported for other sutdies involving progenies of the same age (Gonçalveset al.1984)
Genetic correlation values (rg) for both Bt (0.44) and
Lv (0.43) were favorably associated with rubber production (Pp), and support the work of Gonçalveset al.(1999, 2004)
who found phenotypic correlations of almost the same magnitude (rp= 0.42 and 0.43).
Expected progress with selection
The estimated narrow sense heritabilities for rubber yield (Pp), bark thickness (Bt) and total number of vessel rings (Lv) varied between sites, with the Pp and Bt values being highest values at Pindorama which suggests that high genetic gains could be achieved for these traits at this site
Table 5- Genotypic (rg) and phenotypic correlations (rp) for bark thickness (Bt), total number of latex vessel rings (Lv), average distance (mm) between consecutive latex vessel rings (Dc), density of latex vessels per 5mm per ring (Dd) and diameter of latex vessels (Di) in 22 three-year-old open-pollinated
Heveaprogenies growing at three sites in the Brazilian state of São Paulo. Values represent means for the three sites.
Traits
Traits Correlation type Bt Lv Dc Dd Di
Pp rg 0.4382* 0.4657* 0.3375ns 0.5425** 0.8628**
rp 0.4289* 0.4305* -0.2941ns 0.5584** 0.7716**
Bt rg 0.3090ns 0.1263ns 0.3216ns 0.8263**
rp 0.2809ns 0.1170ns 0.2463ns 0.4690*
Lv rg -0.7229** 0.4403** 0.5558**
rp -0.6298** 0.3789 0.4500*
Dc rg -0.2685ns -0.0346ns
rp -0.1506ns 0.0036ns
Dd rg 0.6542**
rp 0.7074**
*and ** significant at 5% and 1% probability, respectively ns = not significant.
Table 4 (cont.)
Dd Di
Sites Correlation types 2 3 Sites Correlation types 2 3
1 rg -0.0202ns 0.0164ns 1 rg 0.0006ns 0.0098ns
rp 0.0000 0.5473** rp -0.0880ns -0.1241ns
2 rg - -0.1138ns 2 rg - 0.0393ns
rp - 0.0000 rp - -0.0019ns
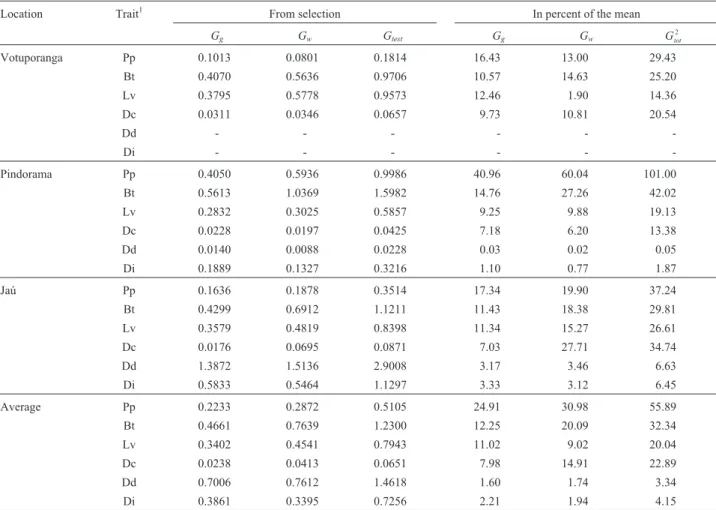
(Table 3). The prediction of expected progress by selection between progenies assumed a selection intensity (Table 6) of 45% for all the traits, but the genetic gain values varied considerably for Pp and among the other laticiferous sys-tem traits and were especially high for the Bt trait. These values were within the limits obtained by other authors (Paivaet al.,1994; Vasconcellos, 1985; Moretiet al., 1994) and Booket al.(1995). The results also showed a tendency
for greater gains when selection took place in Pindorama and Jaú. However, the expected progress in selection inten-sity for within progeny selection was only 10%, although here again the gain values varied considerably for Pp and among the other laticiferous system traits and were espe-cially high for the Bt trait. These values were also within the limits obtained by other authors (Moretiet al.,1994;
Boocket al.,1995; Costaet al., 2002). The results showed a
tendency for greater genetic gains when the within progeny selection took place in Pindorama and, to a lesser extent, Jaú.
Selection gains as a percentage of the between and within progeny means for the other laticiferous system traits such as latex vessel density (Dd) and latex vessels di-ameter(Di) were relatively low for all sites and somewhat lower than those reported by Boocket al(1995).These low
expected gains probably resulted from low heritability esti-mates with high phenotypic variation in these traits. Zobel and Talbert (1984), however, pointed out that tree breeders can influence selection gains by controlling the environ-ment by maximize heritability. Genetic gain could also be increased by employing an appropriate method of indirect selection (Falconer and Mackay, 1996).
Breeding strategies
Our results show that it is possible to develop a pro-gram for rubber tree improvement. Zobel and Talbert (1984) state that ‘progeny plus within-family selection’ method (i.e.selecting the best progenies and the best
indi-viduals within progenies) is the predominant form of selec-tion used in most advanced generaselec-tion tree improvement
Table 6- Expected genetic gain from selection and percentage of the mean among (Gg) within (Gw) progenies and total (Gtest) for six different traits of the
laticiferous system in 22 three-year-old open-pollinatedHeveaprogenies growing at three sites in the Brazilian state of São Paulo.
Location Trait1 From selection In percent of the mean
Gg Gw Gtest Gg Gw Gtot
2
Votuporanga Pp 0.1013 0.0801 0.1814 16.43 13.00 29.43
Bt 0.4070 0.5636 0.9706 10.57 14.63 25.20
Lv 0.3795 0.5778 0.9573 12.46 1.90 14.36
Dc 0.0311 0.0346 0.0657 9.73 10.81 20.54
Dd - - -
-Di - - -
-Pindorama Pp 0.4050 0.5936 0.9986 40.96 60.04 101.00
Bt 0.5613 1.0369 1.5982 14.76 27.26 42.02
Lv 0.2832 0.3025 0.5857 9.25 9.88 19.13
Dc 0.0228 0.0197 0.0425 7.18 6.20 13.38
Dd 0.0140 0.0088 0.0228 0.03 0.02 0.05
Di 0.1889 0.1327 0.3216 1.10 0.77 1.87
Jaú Pp 0.1636 0.1878 0.3514 17.34 19.90 37.24
Bt 0.4299 0.6912 1.1211 11.43 18.38 29.81
Lv 0.3579 0.4819 0.8398 11.34 15.27 26.61
Dc 0.0176 0.0695 0.0871 7.03 27.71 34.74
Dd 1.3872 1.5136 2.9008 3.17 3.46 6.63
Di 0.5833 0.5464 1.1297 3.33 3.12 6.45
Average Pp 0.2233 0.2872 0.5105 24.91 30.98 55.89
Bt 0.4661 0.7639 1.2300 12.25 20.09 32.34
Lv 0.3402 0.4541 0.7943 11.02 9.02 20.04
Dc 0.0238 0.0413 0.0651 7.98 14.91 22.89
Dd 0.7006 0.7612 1.4618 1.60 1.74 3.34
Di 0.3861 0.3395 0.7256 2.21 1.94 4.15
1Key (units in parenthesis); Pp = rubber yield (g); Bt = bark thickness (mm); Lv = number of latex vessel rings; Dc = average distance (
mm) between
con-secutive latex vessel rings (based on all rings); Dd = density of latex vessels per 5 mm per ring, averaged over all rings; Di = diameter (mm) of latex
ves-sels.2G
programs and we feel that this method should be adopted for improving rubber yield (Pb), bark thickness (Bt) and the number of latex vessel rings (Lv) in rubber trees growing in São Paulo. Since there was low significant genetic correla-tion between Pb, Bt and Lv indirect seleccorrela-tion is not applica-ble so ‘tandem selection’ should be used in which rubber yield is improved first and Bt and number Lv afterwards when rubber production has reached a satisfactory level, al-though if the intentions is to improve rubber yield and bark thickness simultaneously an ‘independent culling’ method would be better.
Acknowledgments
The authors thank to Dr. Antonio Lúcio M. Martins Director of Pindorama Pole for facilities provided. To Miss Graziela dos Santos Lima of theHeveabreeding program,
at the Instituto Agronômico (IAC) for her help during this study. P.S.G., L.R.L.G. and A.B.B.C. are recipients of CNPq and FAPESP fellowships, respectively. This re-search and publication was supported by FAPESP.
References
Boock MV, Gonçalves P de S, Bortoletto N and Martins ALM (1995) Estimativas de parâmetros genéticos e ganhos es-perados com a seleção de caracteres juvenis em progênies de seringueira. Pesq Agrop Bras 25:135-156.
Costa RB da, Resende MDV de, Gonçalves P de S and Silva M de A (2002) Individual multivariate REML/BLUP in the pres-ence of genotype x environment interaction in rubber tree (Hevea) breeding. Crop Breed Appl Biotech 2:131-140.
Costa RB da, Resende MDV, Araújo AJ de, Gonçalves P de S and Martins ALM (2000a) Genotype-environment interaction and the number of test sites for the genetic improvement of rubber trees (Hevea) in São Paulo State, Brazil. Genet Mol
Biol 23:179-187.
Costa RB, Resende MDV de, Araújo AJ, Gonçalves P de S and Higa AR (2000b) Selection and genetic gain in rubber (Hevea) populations using a mixed mating system. Genet Mol Biol 23:671-679.
Cruz CD (2001) Programa Genes: Versão Windows. Aplicativo Computacional em Genética e Estatística. Editora da UFV, Viçosa, 648 pp and CD-ROM.
Cruz CD and Regazzi AJ (1994) Modelos Biométricos Aplicados ao Melhoramento Genético. Imprensa Universitária, Viço-sa, 390 pp.
Falconer DS and Mackay TFC (1996) Introduction to Quantita-tive Genetics. Longman, New York, 320 pp.
Fisher RA and Yates F (1971) Statistical Methods for Research Workers. Oliver and Boyd, Edinburgh, 245 pp.
Gomez JB (1982) Anatomy ofHeveaand Its Influence on Latex
Production. Malaysian Rubber Research and Development Board, Kuala Lumpur, 75 pp.
Gonçalves P de S, Furtado EL, Bataglia OC, Ortolani AA, May A and Belletti GO (1999) Genetics of anthracnose panel can-ker disease resistance and its relationship with yield and growth character in half-sib progenies of rubber tree (Hevea brasiliensis). Genet Mol Biol 22:583-589.
Gonçalves P de S, Gallo PB, Segnini Jr I, Ortolani AA, Brioschi AP, Landell MG and Souza SR de (1998) Components of variance and interaction between genotype and environment for annual girth increment in rubber tree. Pesq Agrop Bras 33:1329-1337.
Gonçalves P de S, Martins ALM, Bortoletto N and Saes LA (2004) Selection gains for juvenile traits in progenies ofHeveain São Paulo State, Brazil. Genet Mol Biol 27:207-214.
Gonçalves P de S, Martins ALM, Bortoletto N and Carvalho AZ (1995) Relationship among yield, girth and some structural character of the laticiferous system in young seedlings of rubber trees (Hevea). Braz J Genet 18:421-428.
Gonçalves P de S, Rossetti, AG, Valois, ACC and Viegas, I de J (1984) Estimativas de correlações genéticas e fenotípicas de alguns caracteres quantitativos em clones jovens de serin-gueira. Rev Bras Genet 2:95-107.
Kageyama PY, Oliveira RS, Ferraz PA, Furtado EL, Souza AD and Sebbenn AM (2002) Genetic gains in the selection for látex productivily in natural populations ofHevea brasiliensisin Chico Mendes Reserve: A case study of the IAPs (Islands of high productively), Scientia Forestalis 61:79-85.
Kempthorne O (1966) An Introduction to Genetic Statistics. John Wiley & Sons, New York, 455 pp.
Moreti D, Gonçalves P de S, Gorgulho EP, Martins ALM and Bortoletto N (1994) Estimativas de parâmetros genéticos e ganhos esperados com a seleção de caracteres juvenis em progênies de seringueira. Pesq Agrop Bras 29:1099-1104. Paiva JR, Kageyama PY, Vencovsky R and Contal PB (1994)
Ge-netics of rubber tree (Hevea brasiliensis[(Willd. ex Adr. de
Juss.) Muell. Arg]. 1. Genetic variation in natural popula-tions. Silvae Genetica, 43:306-311.
Resende MDV de and Oliveira EB de (1997) Sistema “Selegen” -Seleção genética computadorizada para o melhoramento de espécies perenes. Pesq Agrop Bras 32:931-939.
Tan H and Subramaniam S (1976) A five diallel cross analyses for certain characters of youngHeveaseedling. In: Rubber
Re-search Institute of Malaysia (ed) Proceedings of the Interna-tional Rubber Conference. RRIM, Kuala Lumpur, 13-26. Tan H (1981) Estimates of genetic parameters and their
implica-tions inHeveabreeding. In: Yap TC, Graham KM, Sukami J (eds) Crop Improvement Research, Proc. 4th Int. Congr. SABRAO, Kuala Lumpur, 439-446.
Tan H (1987) Strategies in rubber tree breeding. In: Abbott AJ and Atkin RK (eds) Improving Vegetatively Propagated Crops. Academic Press, London 27-62.
Vasconcellos MEC, Gonçalves P de S, Paiva JR and Valois ACC (1985) Métodos de estimação do coeficiente de repetibi-lidade no melhoramento da seringueira. Pesq Agrop Bras 20:433-437.
Vencovsky R (1969) Genética quantitativa. In: Kerr WE (ed) Melhoramento e Genética. Edusp, São Paulo, pp 17-37. Vencovsky R (1983) Herança quantitativa. In: Paterniani EC and
Viegas GP (eds) Melhoramento e Produção do Milho. Fun-dação Cargill, Campinas, pp 137-214.
Vencovsky R and Barriga P (1992) Genética Biométrica no Fito-melhoramento. Sociedade Brasileira de Genética, Ribeirão Preto, 486 pp.
Zobel B and Talbert J (1984) Applied Forest Tree Improvement. John Wiley & Son, New York, 505 pp.