A parallel algorithm for finding small sets of genes that are enough to
distinguish two biological states
Martha Torres and Junior Barrera
Universidade de São Paulo, Instituto de Matemática e Estatística, São Paulo, SP, Brazil.
Abstract
GCLASS is an algorithm which explores small samples of two distinct biological states for finding small sets of genes, which form a feature vector that is enough to separate these two states. A typical sample is a set of 60 microarrays, 30 for each biological state, with several thousand genes. The technique consists of the following: a spreading model defined in the space of small sets of genes studied and centered in each feature vector considered; the designing of optimal linear classifiers under this spreading model; and ranking the designed classifiers, based on their error and robustness relative to the spreading. The feature vectors used in the best classifiers are considered the best feature vectors.
Due to the great number of potential feature sets, a parallel implementation is a good option for reducing the procedure execution time. This paper presents a parallel solution of GCLASS and shows some performance results. The experimental results show that the proposed solution provides quasi linear speedup if compared to the sequential implementation. For example, using 60 genes as the complete feature space and 6 genes as the small feature space, our parallel version with 11 processors is approximately 10.98 times faster than the sequential version.
Key words:gene expression, classification, parallel processing.
Received: September 30, 2003; Accepted: September 21, 2004.
Introduction
A key goal for the use of expression data is to perform classification via different expression patterns. A success-ful classifier provides a list of genes whose product abun-dance is indicative of important differences in cell state, such as healthy or diseased, or one particular type of cancer or another.
Classifiers are designed from a sample of expression vectors. This requires assessing expression levels from RNA obtained from the different tissues with microarrays, determining genes whose expression levels can be used as classifier variables, and then applying some rule to design the classifier from the sample microarray data.
The problem at this stage is that there is a very large set of gene-expression profiles (features) and typically a small number of microarrays (sample points), making it difficult to find the best features from which to construct a classifier.
GCLASS is an algorithm which explores small sam-ples of two distinct biological states for finding small sets of genes, which form a feature vector that is enough to
sep-arate these two states (Kimet al., 2002a). A typical sample is a set of 60 microarrays, 30 for each biological state, with several thousand genes.
This procedure has been applied to cancer classifica-tion via cDNA microarrays. In particular, the genes BRCA1 and BRCA2 are associated with a hereditary dis-position to breast cancer, and the algorithm is used to find genes sets whose expression can be used to classify BRCA1 and BRCA2 tumors (Kimet al., 2002a). Also, it was used in order to find sets of genes that separate two dif-ferent types of gliomas (Kimet al., 2002b).
The technique consists of the following: a spreading model defined in the space of small sets of genes studied and centered in each feature vector considered; the design-ing of optimal linear classifiers, under this spreaddesign-ing model; and ranking the designed classifiers, based on their error and robustness relative to the spreading. The feature vectors used in the best classifiers are considered the best feature vectors.
Due to the great number of potential feature sets, a parallel implementation is a good option for reducing the procedure execution time. This paper presents a parallel so-lution of GCLASS and shows some performance results.
www.sbg.org.br
Algorithm for finding strong feature (gene) sets
This algorithm designs classifiers that categorize sample tissues based on gene expression values. Given a set of features on which to base a classifier, two issues must be addressed: (a) the design of a classifier from sample data; and (b) the estimation of its error. When selecting features from a large class of potential features, the key issue is whether a particular feature set provides good classifica-tion. A key concern is the precision with which error of the designed classifier estimates the error of the optimal classi-fier. When data are limited, an error estimator may be unbi-ased but may have a large variance and therefore may often be low. This can produce many feature sets and classifiers with low error estimates. This algorithm mitigates this problem by designing classifiers from a probability distri-bution resulting from spreading the mass of the sample points. It is parameterized by the variance of the distribu-tion. The error gives a measure of the strength of the feature set as function of the variance.
When the data are limited, and all of it is used to de-sign the classifier, there are several ways to estimate the classifier error. We comment on two of these. The resubstitution estimate for a sample of sizenis the fraction of errors made by the designed classifier on the sample. For LOO estimation,n classifiers are designed from samples subsets formed by leaving out one data point at a time. Each is applied to the left-out point, and the estimator is1/ntimes the number of errors made bynclassifiers.
This algorithm constructs, from the sample data, a linear classifierψσ, in whichσ
2
gives the variance of the distribution used to spread the data. It generates class distri-butions from the sample data and then finds both the classi-fier and its error analytically via simple matrix operations (Kimet al., 2002a). To standardize the interpretation of the results,σis normalized relative to the variance of the data.
In order to find strong feature sets for increasing the values ofσ, a combinatorial search is necessary, when all
possible feature sets are considered. There areC(n, m)(the number of combinations of sizemthat can be formed from a set of sizen) feature vectors of sizemthat can be con-structed fromnavailable features.
The algorithm exploits the full set of combinations for largenand smallm. Ifnis quite large,mcan be even equal to 2. In other situations, an algorithm of suboptimal search is employed. It is a heuristic search algorithm that utilizes some probabilistic information constructed from a previous search and error evaluation, using a less or equal
m. There are quite a few algorithms available, perhaps the most famous being the stochastic-based search algorithms (Hogg, 1996) (Mohan and Nguyen, 1999) and genetic search (Goldberg, 1989) (Srinivais and Patnaik, 1994).
For any feature set,∈σdenotes the error of the
opti-mal classifier for the feature set and∆(∈σ) denotes the
larg-est decrease in error for the full feature set relative to all of
its subsets. The feature sets are first ranked based on∈σ,
and they are ranked again based on the improvement,
∆(∈σ).
In other words, the output of GCLASS program is a table withm-gene classifiers ranked high in both∈σand
∆(∈σ).
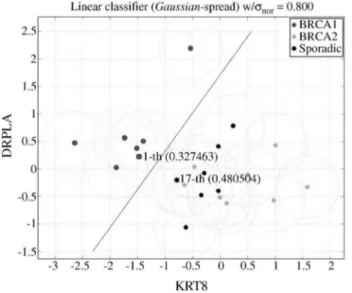
GCLASS has been effective in its present form and useful results have been obtained. For example, it was tested on a published data set (Hedenfalket al., 2001) com-paring the expression profiles of breast tumors from pa-tients carrying mutations in the predisposing genes, BRCA1 or BRCA2, or from patients not expected to carry a hereditary predisposing mutation. Starting with 3226 genes, this algorithm was applied to subsets of sizemequal to 1 through 10 to find classification between BRCA1 mors and the collection of both BRCA2 and sporadic tu-mors. Various values ofσbetween 0.2 and 0.9 were used.
The full search space form= 1 and 2 was exploited and more than 10,000,000 features vectors for eachm> 2 were looked at. Figure 1 shows the hyperplane constructed with a spread ofσ= 0.8 to classify BRCA1 from BRCA2 and
spo-radic tissues using the two genes named on the axes (KRT8 and DRPLA). This classifier yields a very smallσ-error and
no misclassifications.
Figure 2 shows the pseudo-code of sequential version of GCLASS.
Parallel Solution
The overhead main of GCLASS is the number of combinations being considered; therefore, the parallel pro-cessing technique used for this application is divide and conquer. In this parallel version, each processor executes in parallel the gene selection part for a different combinations group; this stage is called the calculation part. Next, the
tial results are sent to a processor. This processor joins the information and generates the results; this stage is called the communication part.
Calculation part
In order for each processor to execute the gene selec-tion part on a different combinaselec-tions group, it is necessary to use a parallel algorithm for generating combinations. We chose our parallel solution described in (Torreset al., 2003) because it is simple and efficient.
Each processor generates a set of C(n,m) combina-tions (where, C(n,m) is the number of combinations of size
mthat can be formed from a set of sizen). Therefore, each processor designs and ranks classifiers for a specific set of potential features vectors of size m.Each processor pro-vides gene subsets that can be used as classifiers and their error.
The parallel algorithm for generating combinations consists in dividing all combinations in groups and to at-tribute these groups to the processors for generating the combinations belonging to each group. Each processor knows which are the groups that belong to it. It does not generate any communication among processors. For in-stance, the combinations of C(5,3) are:012, 013, 014, 023, 024, 034, 123, 124, 134and234. These combinations can be divided into three groups: “group0”, which is composed of the combinations whose “prefix” (the number with which anm-combination begins) is0(012, 013, 014, 023, 034); “group1”, which is constituted by the combinations whose “prefix” is1(123, 124, 134); and “group2”, which is formed with the combinations whose “prefix” is2(234). The total number of groups of all combinations of C(n,m) is
n-m+1.
In order to balance load, we chose the static schedul-ing algorithm called reflexive wrap allocation (Hendrickson, 1999) because the distribution of groups is directly done without any additional calculations.
Our solution using reflexive wrap allocation consists first of attributing the correspondent group to themyidof each processor. Example: If we have a machine with two processors, themyidof processor1is0and themyidof pro-cessor2is1. Therefore, processor1(myid=0) will generate the combinations of “group0” and processor2(myid = 1), those of “group1”.
It is important to point out that the number of combi-nations of “groupi” is larger than the number of combina-tions of “groupi+1”. Therefore, due to initial distribution, the processors with the lowermyid will have to generate combinations of the larger prefix group. In order to com-pensate the load imbalance, in the following distribution, the subsequent groups with smaller “prefixes” will be as-signed to processors with the largermyidand, in the follow-ing distribution, the subsequent groups with smaller “prefixes” will be assigned to processors with the smaller
myid, and so forth. Each processor stops generating combi-nations when the following group is larger thann-m+1.
The sequential combinations algorithm used in this solution is based on the Algorithm 154 (Misfud, 1963), whose running time is O(mC(n,m)), which corresponds to an optimal algorithm (Aklet al., 1989).
Communication part
Each processor calculates the corresponding classifi-ers and generates a sorted error list; next, each processor sends its error list to a central processor. This processor combines these data and computes the average perfor-mance of each feature. In this implementation, this commu-nication part is produced by the collective operation:
gather. In this operation, each processor sends the informa-tion to a central processor. This central processor receives the messages and stores them in identification order.
Figure 3 shows the parallel pseudo-code.
Material and Methods
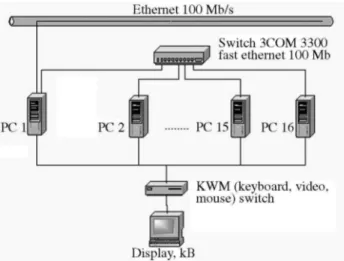
Our solution was implemented in a Beowulf-style cluster of 11 PCs. Each one of these machines has a 1.2GHz AMD Athlon K-7 processor, 768 MB of RAM, 2 MB CPU cache, and 30 GB hard disk space. The machines are inter-connected with a 100 Mbps FastEthernet switch. The oper-ating system is Linux 2.4.20 and we used C language and MPICH 1.2.4 library. We measured the execution time by MPI_Wtime. Figure 4 shows our parallel platform.
Performance Results
In order to show the performance evaluation of the proposed solution, we present the speedup based on the se-quential solution. We consider two classifications: first,
ing 3226 genes as the complete feature space and 2 genes as the small feature space and second, using 50 genes as the complete feature space and 6 genes as the small feature space.
Figures 5 and 6 show the speedup of our parallel solu-tion for the first classificasolu-tion. Figure 5 considers only the computation time. This graph shows that we obtained a quasi linear speedup. The minimum execution time is lim-ited by the communication overhead. If the computation time in each processor is smaller than the communication time, then the speedup can saturate. As in this case, the exe-cution time for 10 and 11 processors is very close because the computation time is very small. The sequential time is 2.77 s and the parallel time for 2 processors is 1.4 s. The parallel time for 3 processors is 0.95 s, for 4 processors is 0.7 s, for 5 processors is 0.57 s, for 6 processors is 0.47 s, for 7 processors is 0.42 s, for 8 processors is 0.35 s, for 9
processors is 0.32 s, for 10 processors is 0.28 s and for 11 processors is 0.27 s.
Figure 6 shows the speedup including the I/O over-head. In this case, the speedup is reduced because there are I/O operations executed only by the central processor. So, this constant overhead increases the total execution time, which is more critical when the processors number in-creases. The sequential time is 167.92 s and the parallel time for 2 processors is 23.78 s. The parallel time for 3 pro-cessors is 15.97 s, for 4 propro-cessors is 12 s, for 5 propro-cessors is 9.67 s, for 6 processors is 8.14 s, for 7 processors is 7.05 s, for 8 processors is 6.25 s, for 9 processors is 5.64 s, for 10 processors is 5.16 s and for 11 processors is 4.78 s.
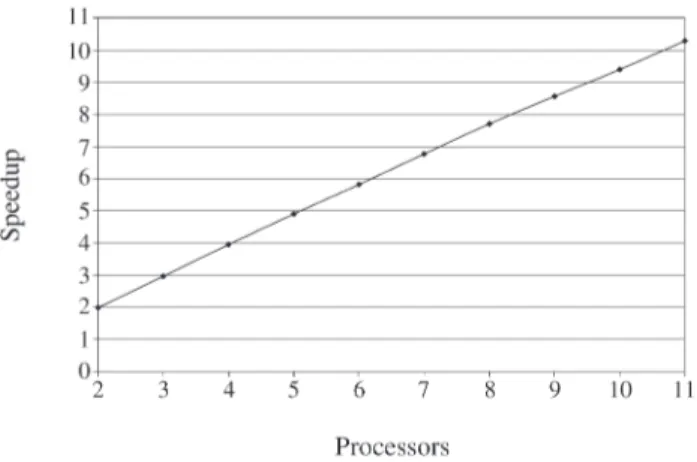
Figures 7 and 8 show the speedup of our parallel solu-tion for the second classificasolu-tion. Figure 7 considers only the computation time, and shows that, in this case, the cal-culation part is increased by each processor; therefore, the communication overhead practically does not affect the computation time and we obtained an almost linear speedup. The sequential time is 13.25 s and the parallel time for 2 processors is 6.63 s. The parallel time for 3 pro-cessors is 4.43 s, for 4 propro-cessors is 3.32 s, for 5 propro-cessors is 2.67 s, for 6 processors is 2.23 s, for 7 processors is 1.9 s,
Figure 3- Pseudo-code of GCLASS parallel version.
Figure 4- Parallel platform.
Figure 5- Speedup based in computation time for 3226 genes as complete feature space and 2 genes as small feature space.
for 8 processors is 1.67 s, for 9 processors is 1.48 s, for 10 processors is 1.35 s and for 11 processors is 1.22 s.
Figure 8 shows the speedup including the I/O over-head. Also in this case the speedup is reduced. But the I/O overhead is smaller than in the preceding case, since the complete feature set is reduced. The sequential time is 793.13 s and the parallel time for 2 processors is 399.25 s. The parallel time for 3 processors is 267.69 s, for 4 sors is 200.88 s, for 5 processors is 161.82 s, for 6 proces-sors is 136.23 s, for 7 procesproces-sors is 117.16 s, for 8 processors is 102.89 s, for 9 processors is 92.6 s, for 10 pro-cessors is 84.36 s and for 11 propro-cessors is 77.07 s.
Conclusion
GCLASS is an important procedure for gene classifi-cation and it has been used in many classificlassifi-cation problems.
In this paper, we present a parallel version of GCLASS that considers all possible combinations of the complete feature space. As mentioned before, the strong-feature algorithm is applied to various subsets of sizemand various values ofσ.
The performance results show that a parallel solution is profitable because the execution time is reduced.
Acknowledgments
The authors would like to thank FAPESP (process number 00/10660-8) and CAPES for the support of this re-search. Also, we would like to thank Dr. Edward Dougherty and his staff for providing the GCLASS code.
References
Akl SG, Gries D and Stojmenovic I (1989) An optimal parallel al-gorithm for generating combinations. Information Pro-cessing Letters 33:135-139.
Goldberg DE (1989) Genetic Algorithms in Search, Optimiza-tions and Machine Learning. 1st edition. Addison-Wesley Longman Publishing Co., Boston, 372 pp.
Hedenfalk I, Duggan D, Chen Y, Radmacher M, Bittner M, Simon R, Meltzer P, Gusterson B, Esteller M, Kallioniemi OP, Wilfond B and Trent J (2001) Gene expression profiles in hereditary breast cancer. New England Journal of Medicine 244:539-548.
Hendrickson B (1999) Parallel QR factorization using the torus wrap mapping. Parallel Computing 19(11):1259-1271. Hogg T (1996) Quantum computing and phase transition in
com-binatorial search. Journal Artificial Intelligence Research 4:91-128.
Kim S, Dougherty E, Junior B, Chen Y, Bittner M and Trent J (2002a) Strong features sets from small samples. Journal of Computational Biology 9:129-148.
Kim S, Dougherty ER, Shmulevich L, Hess KR, Hamilton SR, Trent JM, Fuller GN and Zhang W (2002b) Identification of combination gene sets of glioma classifications. Mol Cancer Therapeutics 1:1229-1236.
Misfud CS (1963) Combination in lexicographic order (Algo-rithm 154). Communications of the ACM 6:3-103. Mohan C and Nguyen HT (1999) Controlled random search
tecnique incorporating the simulated annealing concept for solving integer and mixed integer global optimization prob-lems. Computational Optimization and Applications an In-ternational Journal 14:103-132.
Srinivais M and Patnaik LM (1994) Genetic algorithms: A survey. Computer 27:17-26.
Torres M, Gold A and Barrera J (2003) A parallel algorithm for numerating combinations. In: The 2003 International Con-ference on Parallel Processing Proceedings, IEEE Computer Society Press, Taiwan, pp 1:581-588
Figure 7- Speedup based in computation time for 50 genes as complete feature space and 6 genes as small feature space.