ACPD
9, 8791–8816, 2009Influence of entrainment of CCN
J. W. B. Derksen et al.
Title Page
Abstract Introduction
Conclusions References
Tables Figures
◭ ◮
◭ ◮
Back Close
Full Screen / Esc
Printer-friendly Version
Interactive Discussion Atmos. Chem. Phys. Discuss., 9, 8791–8816, 2009
www.atmos-chem-phys-discuss.net/9/8791/2009/ © Author(s) 2009. This work is distributed under the Creative Commons Attribution 3.0 License.
Atmospheric Chemistry and Physics Discussions
This discussion paper is/has been under review for the journalAtmospheric Chemistry and Physics (ACP). Please refer to the corresponding final paper inACPif available.
Influence of entrainment of CCN on
microphysical properties of warm
cumulus
J. W. B. Derksen, G.-J. H. Roelofs, and T. R ¨ockmann
Institute for Marine and Atmospheric Research Utrecht, Utrecht, The Netherlands Received: 3 February 2009 – Accepted: 24 March 2009 – Published: 2 April 2009 Correspondence to: J. W. B. Derksen ([email protected])
ACPD
9, 8791–8816, 2009Influence of entrainment of CCN
J. W. B. Derksen et al.
Title Page
Abstract Introduction
Conclusions References
Tables Figures
◭ ◮
◭ ◮
Back Close
Full Screen / Esc
Printer-friendly Version
Interactive Discussion
Abstract
We use a 1-D cloud model with explicit microphysics and a binned representation of the aerosol size distribution to investigate the influence of entrainment of cloud con-densation nuclei (CCN) on the microphysical development of warm cumulus clouds. For a more realistic representation of cloud drop spectral width, the model separates 5
droplets that grow on aerosol that is initially present in the cloud from droplets grow-ing on entrained aerosol. Model results are compared with observations of trade wind cumulus microphysics from the Rain in Cumulus over the Ocean experiment (RICO, 2004–2005). The results indicate that CCN are entrained throughout the entire cloud depth, and inside the cloud part of these may be activated. Compared to a simula-10
tion where entrainment of ambient CCN is neglected this leads to higher cloud droplet number concentrations (CDNC) and a continuous presence of droplets in the range smaller than∼5µm that is consistent with the observations. Cloud dynamics are sen-sitive to the entrainment parameter as well as to the applied initial vertical velocity, as expressed by the liquid water content and cloud top height. However, simulated cloud 15
drop spectra remain relatively unaffected for the specific conditions during RICO.
1 Introduction
Anthropogenic emissions of primary aerosol particles and aerosol precursors (sulfur dioxide, non-methane higher hydrocarbons, nitrogen oxides, soot) have increased at-mospheric aerosol concentrations substantially since pre-industrial times (e.g., Charl-20
son et al., 1992; Solomon et al., 2007). Aerosols act as cloud condensation nuclei, and the increasing aerosol abundance and changing chemical composition affect climate through the so-called aerosol indirect effects. In the first indirect effect, an increase of aerosol particles leads to a higher cloud droplet number concentration, a smaller aver-age drop radius and a larger optical thickness (Twomey, 1977). In the second indirect 25
ACPD
9, 8791–8816, 2009Influence of entrainment of CCN
J. W. B. Derksen et al.
Title Page
Abstract Introduction
Conclusions References
Tables Figures
◭ ◮
◭ ◮
Back Close
Full Screen / Esc
Printer-friendly Version
Interactive Discussion size, and the cloud lifetime increases (Albrecht, 1989).
The cloud drop number concentration (CDNC) is a crucial parameter for both effects (Lohmann and Feichter, 2005). Since it is associated with the average droplet size it is relevant for cloud scattering as well as for drizzle formation. The initial CDNC is de-termined directly at the cloud base. Much research effort has been invested therefore 5
in understanding how meteorological characteristics and aerosol properties influence aerosol activation at the cloud base (e.g., Kulmala et al., 1993), and in the develop-ment of parameterizations for CDNC that can be used in general circulation models (e.g., H ¨anel, 1987; Fountoukis and Nenes, 2005). In the second place, the distribution of the liquid water with droplet size further influences both scattering and precipitation 10
formation processes (e.g., Roelofs and Jongen, 2004; Roelofs and Kamphuis, 2009). A model study of cloud microphysics therefore requires a realistic representation of both CDNC and the drop size distribution.
During adiabatic cloud development the liquid water content (LWC) evolves adiabat-ically with height and, when neglecting collision/coalescence between droplets, CDNC 15
remains constant throughout the cloud depth (Pruppacher and Klett, 1978). However, many observed clouds develop in a sub-adiabatic manner, with continuous entrainment of surrounding subsaturated air into the cloud, resulting in smaller LWC and CDNC than their adiabatic values (e.g., Penner and Chuang, 1999; Gerber et al., 2005; Meskhidze et al., 2005). Simultaneously, the entrained air contains unactivated aerosol. During 20
mixing with cloudy air these are exposed to supersaturation conditions and may partly activate. Thus, small and recently activated droplets are added continuously to the cloud air and this results in a broadening of the drop size distribution. The mixing pro-cess between the cloud air and the entrained air is thought of as being homogeneous or inhomogeneous (Su et al., 1998). In homogeneous mixing the typical time scale of 25
ACPD
9, 8791–8816, 2009Influence of entrainment of CCN
J. W. B. Derksen et al.
Title Page
Abstract Introduction
Conclusions References
Tables Figures
◭ ◮
◭ ◮
Back Close
Full Screen / Esc
Printer-friendly Version
Interactive Discussion condensational growth, and different droplets encounter different saturation conditions.
Both mixing processes have been observed (Paluch, 1986; Blyth and Latham, 1990; Hicks et al., 1990; Burnet and Brenguier, 2007).
The microphysical evolution of drops in an entraining cloud with inhomogeneous mixing can be represented adequately only in a 2-D or 3-D cloud resolving model with 5
detailed representations of turbulent mixing and aerosol microphysics, but these are computationally expensive. In parcel model studies, where the cloud is represented as a homogeneous air mass, detailed microphysical calculations are more feasible (e.g., Kreidenweis et al., 2003). Mixing of entrained air in a cloud parcel model is always homogeneous. In order to preserve the information held by the simulated drop 10
size distribution it is necessary, however, to separate the representations of larger, older cloud drops and smaller entrained particles. We remark that the value of the entrainment parameter is rather uncertain. Values ranging from 0.1/R to 0.6/R, withR the cloud parcel radius, are derived from observations and applied in different model studies (Su et al., 1998; Roesner et al., 1990; Pruppacher and Klett, 1978; Roelofs and 15
Jongen, 2004).
In this model study we examine the influence of entrainment of relatively dry air containing aerosol on cloud dynamical and microphysical parameters. We use a one-dimensional (1-D) cloud column model that contains a binned representation of aerosol. It simulates aerosol activation, condensational growth and evaporation based on K ¨ohler 20
microphysics. The representation of the drop size distribution in the model enables a separate evaluation of entrained drops and mature cloud drops, as described in more detail in Sect. 2. The model is applied to the simulation of a typical trade cumulus cloud observed during RICO (Rain in Cumulus over the Ocean; Rauber et al., 2007). The measurement campaign was carried out during December 2004–January 2005 25
ACPD
9, 8791–8816, 2009Influence of entrainment of CCN
J. W. B. Derksen et al.
Title Page
Abstract Introduction
Conclusions References
Tables Figures
◭ ◮
◭ ◮
Back Close
Full Screen / Esc
Printer-friendly Version
Interactive Discussion describes the relevant observations from RICO. In Sect. 4 the results of the study are
presented, and Sect. 5 presents a discussion of the results and the conclusions.
2 Model description
We use a one-dimensional circular axisymmetric cloud model (Ogura and Takahashi, 1971; Takahashi, 1976). We implemented the detailed microphysical module applied 5
in the cloud parcel model by Roelofs and Jongen (2004). In addition, the model now incorporates a detailed representation of entrained cloud condensation nuclei (CCN) and their evolution. Ice formation and radiative transfer are not simulated.
The model simulates a vertical cloud column with a radius of 300 m. Around this column a passive circular concentric column is present, representing the cloud envi-10
ronment, where all properties are kept constant. The domain ranges from 0 to 4 km altitude with a vertical grid distance of 100 m and a time resolution of 0.1 s. Upper and lower boundaries are closed and associated quantities are kept constant.
Vertical motions of air are suppressed at the upper and lower boundaries and are controlled by buoyancy and drag in the interior. Exchange between the cloud and the 15
environment occurs in two ways. In the first place, convergence and divergence in the computed vertical velocity field in the cloudy column drive in- and outflow through the lateral boundary. In the second place lateral mixing occurs. The strength of lateral entrainment is set through the fractional entrainment rate,|w|αR, wherew is the vertical velocity, R is the radius of the cloud and Rα is the entrainment parameter. The frac-20
tional entrainment rate determines the volume fraction of a model grid space which is exchanged with the environment every time step. In our study we use a value of 0.4 forα, unless stated otherwise. This is consistent with Gerber et al. (2008) who showed that during RICO on the 11th of January (the data used in this study is observed on this date, see Sect. 3 for details) the average fractional entrainment, αR, for the lower 25
ACPD
9, 8791–8816, 2009Influence of entrainment of CCN
J. W. B. Derksen et al.
Title Page
Abstract Introduction
Conclusions References
Tables Figures
◭ ◮
◭ ◮
Back Close
Full Screen / Esc
Printer-friendly Version
Interactive Discussion Aerosols are represented by a discrete size distribution, that ranges from 0.002 to
5µm and is divided in 50 bins. Each size bin has a continuously modified wet radius associated with it, that is modified through condensation or evaporation. Aerosol ac-tivation and condensation/evaporation of water are calculated according to the K ¨ohler equations, parameterized according to H ¨anel (1987). The collision-coalescence pro-5
cess is parameterized according to Jacobson (1998). Drops formed through collision-coalescence are transferred to a discrete size distribution with 50 bins, ranging from 0.1 to 2000µm. These droplets are also subject to condensation and evaporation. They may be removed from the cloud as rain due to their relatively large fall velocities.
During cloud development, ambient CCN are entrained into the cloud and a part 10
becomes activated after mixing with the supersaturated cloud air. That implies that at any moment, besides older larger droplets, small droplets with a size of the order of several micrometers are present at any level within the cloud. To optimally represent both the droplets formed during the cloud onset and the droplets growing on entrained particles, their evolution has to be considered separately, i.e. in separate droplet size 15
distributions. However, in order to keep the computational time limited the different distributions must be combined at specific instants during the simulation. The time interval between different averaging events,tm, must reflect the time for condensational growth from their critical size to typical cloud drop sizes. This period of time depends on the supersaturation, i.e. the speed of condensational growth. During simulations 20
the typical supersaturation is 0.4%. At this supersaturation, a droplet of 1µm needs 90 s to grow to a size of 8µm and 300 s to grow to 15µm.
In the present version, the model contains four different aerosol/drop size distribu-tions. One distribution is assigned to represent the aerosol/droplets initially present in the column and another distribution represents the most recently entrained CCN. The 25
ACPD
9, 8791–8816, 2009Influence of entrainment of CCN
J. W. B. Derksen et al.
Title Page
Abstract Introduction
Conclusions References
Tables Figures
◭ ◮
◭ ◮
Back Close
Full Screen / Esc
Printer-friendly Version
Interactive Discussion
3 RICO and data description
The Rain In Cumulus over the Ocean (RICO) field campaign took place during Novem-ber 2004–January 2005 offthe Caribbean Islands of Antigua and Barbuda. The area is characterized during this period by shallow trade wind cumuli, most frequently top-ping at 800 hPa under the influence of an inversion layer. Convection reaching up to 5
700 hPa and higher has been observed.
A goal of the campaign was to gain insight in the rain initiation processes within shal-low maritime cumulus. Therefore, cloud properties such as LWC and droplet size dis-tributions were measured. Also vertical temperature and humidity profiles were mea-sured with dropsondes. CCN measurements were done during low altitude circles at 10
100 m height. Clouds were measured by the C130 aircraft at 5 different height levels (800, 1000, 1200, 1500 and 1650 m) at 1 Hz, corresponding to approximately 100 m flight distance. We focus on data measured on the 11th of January, which was charac-terized by lower drizzle concentrations than other RICO days (Gerber et al., 2008). For these circumstances, effects of entrainment can be studied without influence of LWC 15
depletion by precipitation.
We applied two criteria to filter the data: 1) The measured LWC is larger than 0.05 g/kg and 2) the vertical velocity is positive. This excludes cloudless regions and in-cloud parts dominated by downdrafts and emphasizes the cloud cores simulated by our model. The resulting data set is an ensemble of many different clouds, in a different 20
stage of development and measured at a different location, both geometrically as well as with respect to the position within a cloud.
To compare model results with observations, the same criteria are used to sample the model domain. For both simulated and observed data sets we calculated median values for LWC, mean radius (rm) and CDNC, as well as for the total size distributions. 25
ACPD
9, 8791–8816, 2009Influence of entrainment of CCN
J. W. B. Derksen et al.
Title Page
Abstract Introduction
Conclusions References
Tables Figures
◭ ◮
◭ ◮
Back Close
Full Screen / Esc
Printer-friendly Version
Interactive Discussion modeled cloud does represent the average evolution of the RICO ensemble. We
re-mark that the observed 1650 m level only consists of two data points.
4 Initialization and results
4.1 Model initialization
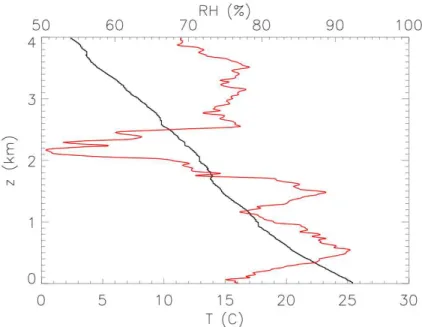
Sonde data from 14:40 UTC (see Fig. 1) were used to initialize the vertical temperature 5
and specific humidity profiles in the model. The sounding reflects a dry adiabatic lapse rate (∼−10 K/km) from the surface up to 600 m height, the location of the lifting conden-sation level, and a lapse rate of−7 K/km from 600 m to 1700 m, which is conditionally unstable. An inversion layer was located at 1700 m. Small scale vertical variations can not be represented due to the relative coarse model resolution. Hence, we used the 10
observed lapse rates as input. Surface temperature is initialized at 298.5 K. We re-mark that the observed horizontal variability of relative humidity (RH) ranges up to ten percent, indicating a significant spatial variability of the atmospheric conditions under which the cumulus clouds are formed.
The average observed in-cloud vertical velocity at 800 m altitude, the approximate 15
cloud base height, is 1.18 m/s. Generally, larger updraft velocities are associated with larger values for LWC. We assumed an initial vertical updraft velocity below the cloud base of 1.5 m/s and investigated the sensitivity of the simulated cloud characteristics for variations in the updraft velocity.
The aerosol size distribution is initialized based on daily averaged values of CCN 20
measurements (see Hudson and Mishra (2007) for details). A three-modal lognormal distribution is fitted to the observations (see Table 1). Hudson and Mishra (2007) found that CCN concentrations showed little variability during each low altitude flight, though concentrations increased during the day. Gerber et al. (2008) found that the CCN con-centration at 1.5% supersaturation was approximately constant with height, indicating 25
ACPD
9, 8791–8816, 2009Influence of entrainment of CCN
J. W. B. Derksen et al.
Title Page
Abstract Introduction
Conclusions References
Tables Figures
◭ ◮
◭ ◮
Back Close
Full Screen / Esc
Printer-friendly Version
Interactive Discussion resulting in a near constant CCN concentration throughout the boundary layer. Peter
et al. (2008) showed that most aerosol larger than 0.2µm consisted of sea salt, but that aerosol smaller than 0.2µm consisted mostly of ammonium sulphate. For compu-tational reasons we assume all aerosol to consist of sea salt. This assumption can lead to a slightly smaller cutoffradius and thus larger CDNC, but the differences are insignif-5
icant compared to the effect of spatial variabilities in humidity mentioned above. The environmental column is initialized with the same aerosol size distribution and vertical profile and assumed to be constant throughout a simulation.
4.2 Analysis of the base case
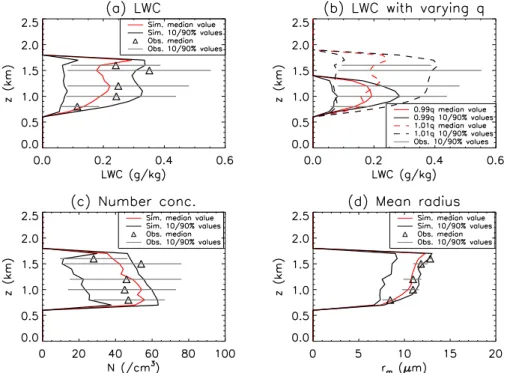
Figure 2 shows the simulated profiles of LWC and its sensitivity for humidity, of CDNC 10
and of the median radius, together with the observations. It is stressed that the ob-served data ensemble at 1650 m altitude consists of two measurements. To avoid a misleading figure, the mean of the observations is shown at this height, since the me-dian would be one of both measurements. The vertical profile of the simulated meme-dian LWC is qualitatively similar to the observed profile. The median increases from the 15
cloud base up to∼1.2 km altitude. Between 1200 and 1500 m altitude the model pre-dicts a decrease. No observations are available at these heights to verify this result. Just below cloud top the simulated median value increases again in agreement with the observations. Similar LWC profiles were found in other trade wind cumulus studies (e.g., Lu et al., 2003). The LWC profile reflects the RH profile, with local maxima of 20
∼90% at 500 and 1500 m altitude (see Fig. 1). The cloud entrains increasingly moist air above 1200 m, leading to an increasing saturation level in the cloud which supports condensation of water vapor.
The model underestimates the median LWC throughout the cloud depth (up to 50% below the cloud top), as well as the range in observed LWC values. To investigate the 25
val-ACPD
9, 8791–8816, 2009Influence of entrainment of CCN
J. W. B. Derksen et al.
Title Page
Abstract Introduction
Conclusions References
Tables Figures
◭ ◮
◭ ◮
Back Close
Full Screen / Esc
Printer-friendly Version
Interactive Discussion ues remain below 0.3 g/kg throughout the cloud depth. A higher humidity does not
result in an increase of the median LWC values, but the 90% values are raised from 0.34 to 0.4 g/kg. We conclude that varieties in humidity may partly account for the dis-agreement between observed and simulated range in the LWC, but do not explain the underestimation of the median values in the upper cloud areas by the model. We re-5
mark, however, that at altitudes just above cloud base the RICO data represent clouds characterized by a wide range of updraft velocities, whereas at higher altitudes only clouds with a more vigorous updraft are represented. The latter are characterized by relatively large LWC.
Simulated CDNC (Fig. 2c) is in the same order of magnitude as the observed CDNC. 10
However, the model simulates a gradual decrease with height that is not observed. The aerosol scale height of 8000 m applied in our study only has a small influence on this. We suspect that the fact that the cloud ensemble represented in the RICO data is dif-ferent for different altitudes, as mentioned above, also influences the observed CDNC profiles. The range towards small concentrations is very well captured by the model. 15
Towards high concentrations, the model underestimates the range increasingly with height, up to 35% at 1500 m. Discrepancies between observed and simulated range in LWC and CDNC are probably associated, suggesting that more vigorous clouds, growing in more humid air and with relatively large CDNC caused by larger updraft velocities, have a relatively large weight within the observed data set.
20
The simulated median values ofrm shown in Fig. 2d, agree well with the observed median. An increase from 8 up to 11µm is simulated between 800 and 1000 m altitude, above whichrm is nearly constant up to 1500 m. In the cloud top,rm increases again, up to 12µm, which is a slight underestimation compared to the observed increase up to 13µm. A good agreement is found with the profile compiled by Arabas et al. 25
ACPD
9, 8791–8816, 2009Influence of entrainment of CCN
J. W. B. Derksen et al.
Title Page
Abstract Introduction
Conclusions References
Tables Figures
◭ ◮
◭ ◮
Back Close
Full Screen / Esc
Printer-friendly Version
Interactive Discussion minute) stage or in the last moments of dissipation and have a low probability to be
measured by aircraft.
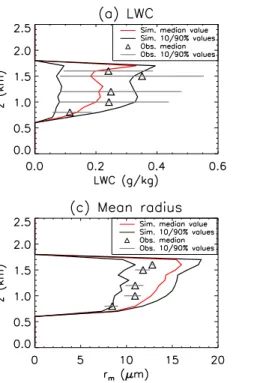
To asses the influence of entrainment of ambient CCN into the cloud, we performed a simulation without ambient CCN. Figure 3 shows the simulated profiles of LWC, CDNC andrm.
5
Compared to the simulation with ambient CCN, i.e. the base case, the LWC is highly similar, since LWC is governed by atmospheric dynamics. The median CDNC is smaller by nearly 50% at all heights. The reduction of CDNC is a direct consequence of the absence of ambient CCN. The median values ofrm are overestimated, consistent with the underestimation of the CNDC.
10
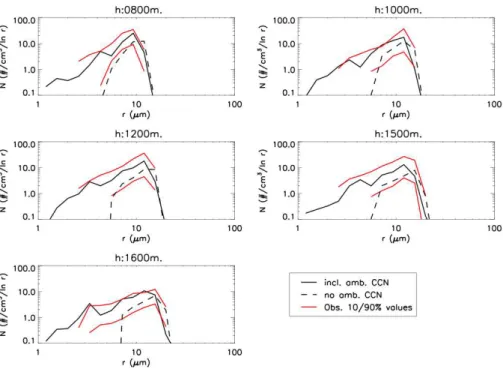
The simulated total droplet size distributions (i.e. the sum of all the individual distri-butions considered by the model) at each level are averaged over the total simulation time, taking the conditions mentioned in Sect. 3 into account. In Fig. 4 the averaged size distribution of the simulations with and without the presence of ambient CCN is shown at each observed level. The figure also shows the observed 10%/90% range of 15
droplet concentration as function of radius. This range reflects the variability of LWC and CDNC within the cloud ensemble, associated with e.g. humidity variation and dif-ferences in updraft velocity, as will be shown later. The simulated spectra have been interpolated to a resolution consistent with the observations. The spectra simulated in the base case show good agreement with the observed range. The concentration 20
maximum is located at approximately 8µm radius at 800 m and increases up to 12µm at 1500 m, agreeing well with the observed peak. The gradual concentration decrease towards smaller droplet radii is consistent with the observed slope, as well as the rapid decrease towards larger radii. In the simulations where the initial specific humidity was varied with 1%, as discussed previously, the slope of the droplet spectra is not altered 25
significantly.
ACPD
9, 8791–8816, 2009Influence of entrainment of CCN
J. W. B. Derksen et al.
Title Page
Abstract Introduction
Conclusions References
Tables Figures
◭ ◮
◭ ◮
Back Close
Full Screen / Esc
Printer-friendly Version
Interactive Discussion small compared to the observed range. It can be noticed that neglecting entrainment
of CCN and the resulting increase of rm does not result in a significant increase of precipitable sized droplets for this case. To conclude, comparison of both simulations shows that entrainment of CCN into the cloud at higher altitudes, and subsequent activation to cloud droplets, is an important process in microphysical cloud evolution 5
during RICO.
4.3 Role of entrainment and the initial vertical velocity
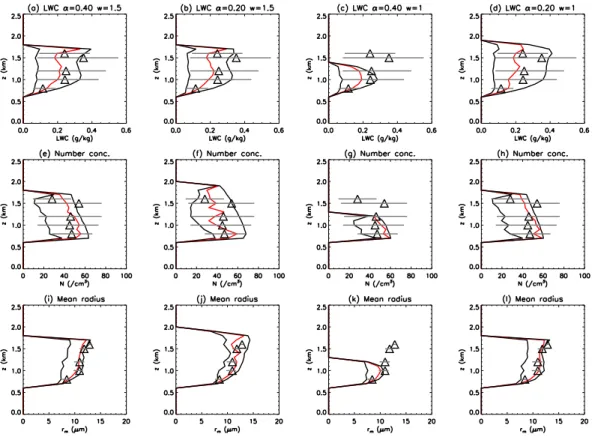
In Fig. 5, the vertical profiles of the median values of the LWC, CDNC and rm are shown for simulations with two different values for the entrainment parameterα, 0.4 and 0.2, each with an initial vertical velocity, w0, of 1.5 m/s and of 1 m/s. The first 10
column corresponds to the base case. The LWC profiles show that anα of 0.2 leads to an increase of cloud top height with 200 m compared to an α of 0.4. This is due to less efficient mixing of drier ambient air into the cloud, while a larger part of the released latent heat is used for rising motion and less colder ambient air is entrained. For a smaller value ofαthe mixing is reduced. Also the updraft velocities are different, 15
with a maximum value of 2.6 m/s for the simulation withα=0.2, and 1.8 m/s during the α=0.40 simulation. Although the median of both simulations are similar, the range in simulated LWC forα=0.2 is larger, especially above 1000 m, in better agreement with the observed ranges.
For α=0.4 and w0=1 m/s, the simulated cloud top altitude is lower than the base 20
case, i.e. 1200 m. Further, the LWC remains smaller and the cloud dissipates earlier through mixing with the environment. Therefore, the cloud top does not reach the levels with enhanced environmental RH, which explains the absence of the secondary peak in LWC below cloud top. Ifα is also decreased to 0.2, the cloud top reaches 1700 m. In this case, the simulated and observed median LWC are similar for the lower three 25
observed levels. Just as for the base case and when w0=1.5 m/s, the model predicts a
minimum in the LWC at 1500 m and a maximum just below the cloud top.
ACPD
9, 8791–8816, 2009Influence of entrainment of CCN
J. W. B. Derksen et al.
Title Page
Abstract Introduction
Conclusions References
Tables Figures
◭ ◮
◭ ◮
Back Close
Full Screen / Esc
Printer-friendly Version
Interactive Discussion and agree with the observations. The simulations initialized withw0=1.5 m/s display a
CDNC range up to 65 cm−3, which is somewhat larger than the simulations initialized withw0=1 m/s. This reflects the increase of the cutoffradius of activated aerosol with decreasingw0.
Decreasing α does not change the range and median values of rm, but the 10% 5
and 90% values are shifted towards larger radii, such that the median values more or less are in the centre. Decreasingw0 does affect the median and 90% values. Both are slightly smaller, 0.5–1µm at 1000 m altitude. Decreasing both values does not affect the 10% values, but up to 1500 m both median and 90% values have increased with 0.5–1µm and above only the median value has increased with 0.5µm, nearly 10
overlapping the observed median values throughout the cloud.
Recapitulating, the entrainment efficiency appears not to influence the median LWC very much, but the occurrence of parcels with relatively high LWC increases. On the other hand, the initial vertical velocity appears to be the dominant influence on the cloud vertical extent and lifetime. It has a large impact on the occurrence of cloud 15
parcels with relatively large LWC, CDNC and cloud drop radius.
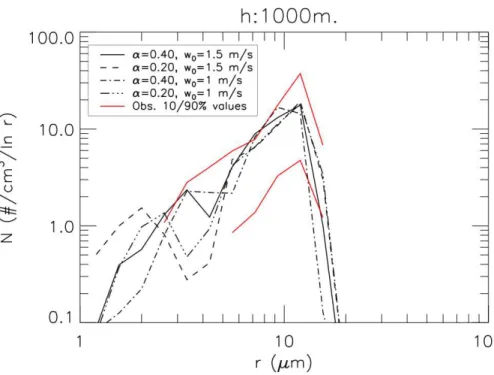
Figure 6 shows simulated droplet spectra at 1000 m altitude for each scenario. All three variations display a good agreement with the base case, with concentration max-ima at 10–11µm. Largest differences between the droplet spectra are at radii smaller than 5µm, which reflects the changes in entrainment with changing values for the pa-20
rametersα andw0. The different simulations result in droplet peaks at slightly differing radii between 2–3µm, which agrees relatively well with individual observed droplet spectra (not shown). Generally, the simulated distributions are all within the observed variability. Previously it is shown that variations of the entrainment parameter and the initial vertical velocity do not affect profiles of CDNC and droplet radius to a large extent 25
ACPD
9, 8791–8816, 2009Influence of entrainment of CCN
J. W. B. Derksen et al.
Title Page
Abstract Introduction
Conclusions References
Tables Figures
◭ ◮
◭ ◮
Back Close
Full Screen / Esc
Printer-friendly Version
Interactive Discussion precludes an accurate assessment of the actual entrainment strength. A larger impact
of the entrainment efficiency on CDNC and cloud drop spectra may be expected for steeper aerosol profiles so that the entrained air at higher cloud altitudes has much smaller particle concentrations than air at the cloud base.
In summary, the simulations presented here, including those with varying humidity, 5
are well within the observed ranges and reflect, at least partly, the different clouds that make up the RICO ensemble. This supports the idea that this ensemble reflects clouds in different growth stages and growing in varying dynamical conditions associated with spatial variability in atmospheric humidity.
5 Discussion and conclusions
10
With a 1-D-cloud column model with detailed calculation of aerosol activation and con-densation/evaporation processes, we simulated a trade wind cumulus cloud as ob-served during RICO (Rain in Cumulus over the Ocean campaign). The simulation reproduces observed profiles of LWC. Simulated CDNC and mean cloud drop radius agree relatively well with observations. The main discrepancies are an underestima-15
tion of LWC below the cloud top, and a slight decrease of CDNC with altitude that is not observed. Discrepancies between model results and observations may partly be explained by spatial humidity variations and by the fact that the observations reflect an ensemble of clouds with different updraft velocities, LWC and vertical extent, whereas our simulation pertains to a single cloud. It is possible that at higher cloud altitudes the 20
observations are biased towards relatively vigorous cumuli with high updraft velocities and CDNC. This also explains the smaller range of simulated LWC and CDNC, with underestimation of the relative occurrence of higher values.
Turbulent mixing and horizontal variability are not represented by the model. In-cloud turbulence can lead to redistribution of droplets, resulting in higher local maxima 25
ACPD
9, 8791–8816, 2009Influence of entrainment of CCN
J. W. B. Derksen et al.
Title Page
Abstract Introduction
Conclusions References
Tables Figures
◭ ◮
◭ ◮
Back Close
Full Screen / Esc
Printer-friendly Version
Interactive Discussion Grits et al., 2006). However, entrainment of ambient air and subsequent
inhomoge-neous mixing can lead to in-cloud variations, large enough to sample at 1 Hz (Krueger et al., 1997).
Observed cloud droplet spectra are reproduced well by the model. Simulated and observed maximum concentrations are located at similar droplet radii and simulation 5
shows a gentle slope of the droplet concentration towards smaller radii and a steeper slope towards larger radii, as found in the observations.
We demonstrated that the slope towards small radii is directly associated with the continuous entrainment and subsequent activation of ambient aerosol. The possibil-ity that these droplets are initially present in the cloud column, but activate at higher 10
altitudes under influence of a second saturation peak (Segal et al., 2003) is therefore excluded. Thus, entrainment exerts a significant influence on the droplet size distri-bution width. It is therefore a crucial factor for the precipitation formation efficiency and optical properties of the cloud. The exchange between cloudy air and environ-mental air, including the activated and unactivated aerosol particles, must therefore be 15
represented realistically in atmospheric models aimed to study indirect aerosol effects. Further, due to entrainment of aerosol into clouds more particles will be subject to cloud processing (e.g., Roelofs and Kamphuis, 2009) which is relevant for the aerosol direct effect.
When the model is initialized with a smaller initial vertical velocity, all simulated 20
clouds have lower cloud tops and lower LWC maxima. This is consistent with the observations that show that larger vertical velocities are associated with larger LWC.
The entrainment parameter α influences the dynamical evolution of the simulated cloud, as expressed in LWC and cloud top height. CDNC is only marginally influenced byα. Particle concentrations inside and outside the cloud are almost equal, so that 25
ACPD
9, 8791–8816, 2009Influence of entrainment of CCN
J. W. B. Derksen et al.
Title Page
Abstract Introduction
Conclusions References
Tables Figures
◭ ◮
◭ ◮
Back Close
Full Screen / Esc
Printer-friendly Version
Interactive Discussion lower supersaturation values, the cut-offradius is larger and a smaller fraction of the
entrained CCN is activated than for less efficient entrainment. A smaller supersatura-tion also results in less efficient condensation of water vapor and, hence, smaller latent heat release and updraft velocities. Mixing also has a direct negative feedback on the vertical velocity, because the entrained air is at rest and slightly colder than the cloud 5
air. This feeds back on the supersaturation and the entrainment rate. In stratus clouds, spectral broadening of cloud droplets has been associated with variations in updraft velocity at cloud base (Hudson and Yum, 1997). In our study of trade-wind cumuli with lateral entrainment, we find that droplet spectra are relatively insensitive for small variations inw0and α. We conclude that the feedbacks between the vertical motion, 10
supersaturation and the entrainment rate appear to cause a relative balance in cloud growth for the conditions typical of RICO, i.e., a well-mixed boundary layer capped by an inversion.
Acknowledgements. Data provided by NCAR/EOL under sponsorship of the National Science Foundation. http://data.eol.ucar.edu/
15
References
Albrecht, B. A.: Aerosols, cloud microphysics, and fractional cloudiness, Science, 245, 1227– 1230, 1989. 8793
Arabas, S., Pawlowska, H., and Grabowski, W. W.: Effective radius and droplet spectral width from in-situ aircraft observations in trade-wind cumuli during RICO, Geophys. Res. Lett.,
20
submitted, 2009. 8800
Blyth, A. M. and Latham, J.: Airborne studies of the altitudinal variability of the microphysical structure of small, ice-free, Montanan cumulus clouds, Q. J. Roy. Meteor. Soc., 116, 1405– 1423, doi:10.1002/qj.49711649608, 1990. 8794
Burnet, F. and Brenguier, J.-L.: Observational study of the entrainment-mixing process in warm
25
convective clouds, J. Atmos. Sci., 64, 1995–2011, 2007. 8794
ACPD
9, 8791–8816, 2009Influence of entrainment of CCN
J. W. B. Derksen et al.
Title Page
Abstract Introduction
Conclusions References
Tables Figures
◭ ◮
◭ ◮
Back Close
Full Screen / Esc
Printer-friendly Version
Interactive Discussion
Hofmann, D. J.: Climate forcing by anthropogenic aerosols, Science, 255, 423–430, 1992. 8792
Fountoukis, C. and Nenes, A.: Continued development of a cloud droplet forma-tion parameterizaforma-tion for global climate models, J. Geophys. Res., 110, D11212, doi:10.1029/2004JD005591, 2005. 8793
5
Gerber, H., Frick, G., Malinowski, S. P., Brenguier, J.-L., and Burnet, F.: Holes and entrainment in stratocumulus, J. Atmos. Sci., 62, 443–459, 2005. 8793
Gerber, H., Frick, G., Jensen, J. B., and Hudson, J. G.: Entrainment, mixing and microphysics in trade-wind cumulus, J. Meteorol. Soc. Jpn., 86A, 87–106, 2008. 8795, 8797, 8798 Grits, B., Pinsky, M., and Khain, A.: Investigation of small-scale droplet concentration
inhomo-10
geneities in a turbulent flow, Meteor. Atmos. Phys., 92, 191–204, doi:10.1007/s00703-005-0157-4, 2006. 8805
H ¨anel, G.: The role of aerosol properties during the condensational stage of cloud: A rein-vestigation of numerics and microphysics, Beitr. Phys. Atmosph., 60, 321–339, 1987. 8793, 8796
15
Hicks, E., Pontikis, C., and Rigaud, A.: Entrainment and mixing processes as related to droplet growth in warm midlatitude and tropical clouds, J. Atmos. Sci., 47, 1589–1618, 1990. 8794 Hudson, J. G. and Mishra, S.: Relationship between CCN and cloud microphysics variations
in clean maritime air, Geophys. Res. Lett., 34, L16804, doi:10.1029/2007GL030044, 2007. 8798
20
Hudson, J. G. and Yum, S. S.: Droplet spectral broadening in Marine Stratus, J. Atmos. Sci., 54, 2642–2654, 1997. 8806
Jacobson, M. Z.: Fundamentals of Atmospheric Modeling, Cambridge Univ. Press, New York, 1998. 8796
Kreidenweis, S., Walcek, C., Feingold, G., Gong, W., Jacobson, M., Kim, C., Liu, X., Penner,
25
J., Nenes, A., and Seinfeld, J.: Modification of aerosol mass and size distribution due to aqueous phase SO2oxidation in clouds: Comparisons of several models, J. Geophys. Res., 108, 4213, doi:10.1029/2002JD002697, 2003. 8794
Krueger, S. K., Su, C.-W., and McMurtry, P. A.: Modeling entrainment and finescale mixing in cumulus clouds, J. Atmos. Sci., 54, 2697–2712, 1997. 8805
30
ACPD
9, 8791–8816, 2009Influence of entrainment of CCN
J. W. B. Derksen et al.
Title Page
Abstract Introduction
Conclusions References
Tables Figures
◭ ◮
◭ ◮
Back Close
Full Screen / Esc
Printer-friendly Version
Interactive Discussion
Lohmann, U. and Feichter, J.: Global indirect aerosol effects: a review, Atmos. Chem. Phys., 5, 715–737, 2005,
http://www.atmos-chem-phys.net/5/715/2005/. 8793
Lu, M.-L., Wang, J., Freedman, A., Jonsson, H. H., Flagan, R. C., McClatchey, R. A., and Seinfeld, J. H.: Analysis of humidity halos around trade wind cumulus clouds, J. Atmos. Sci.,
5
60, 1041–1059, 2003. 8799
Meskhidze, N., Nenes, A., Conant, W. C., and Seinfeld, J. H.: Evolution of a new cloud droplet activation parameterization with in situ data from CRYSTAL-FACE and CSTRIPE, J. Geo-phys. Res., 110, D16202, doi:10.1029/2004JD005703, 2005. 8793
Ogura, Y. and Takahashi, T.: Numerical simulation of the life cycle of a thunderstorm cell, Mon.
10
Weather Rev., 99, 895–911, 1971. 8795
Paluch, I. R.: Mixing and the cloud droplet size spectrum: Generalizations from the CCOPE data, J. Atmos. Sci., 43, 1984–1993, 1986. 8794
Penner, J. E. and Chuang, C. C.: The role of entrainment and mixing in altering the relationship between aerosol concentration and cloud drop number concentration, Ninth ARM Science
15
Team Meeting Proceedings, 1999. 8793
Peter, J. R., Blyth, A. M., Brooks, B., McQuaid, J. B., Lingard, J. J. N., and Smith, M. H.: On the composition of Caribbean maritime aerosol particles measured during RICO, Q. J. Roy. Meteor. Soc., 134, 1059–1063, doi:10.1002/qj.198, 2008. 8799
Pinsky, M. and Khain, A.: Fine structure of cloud droplet concentrations as seen from the
20
fast-FSSP measurements. Part II: Results of in situ observations, J. Appl. Meteorol., 42(1), 65–73, 2003. 8804
Pruppacher, H. R. and Klett, J. D.: Microphysics of clouds and precipitation, D. Reidel, Dor-drecht, 1978. 8793, 8794
Rauber, R., Stevens, B., Ochs, H., Knight, C., Albrecht, B., Blyth, A., Fairall, C., Jensen, J.,
25
Lasher-Trapp, S., Mayol-Bracero, O., Vali, G., Anderson, J., Baker, B., Bandy, A., Burnet, E., Brenguier, J., Brewer, W., Brown, P., Chuang, P., Cotton, W., Girolamo, L. D., Geerts, B., Gerber, H., Gke, S., Gomes, L., Heikes, B., Hudson, J., Kollias, P., Lawson, R., Krueger, S., Lenschow, D., Nuijens, L., O’Sullivan, D., Rilling, R., Rogers, D., Siebesma, A., Snodgrass, E., Stith, J., Thornton, D., Tucker, S., Twohy, C., and Zuidema, P.: Rain In Shallow Cumulus
30
over the Ocean: The RICO Campaign, B. Am. Meteorol. Soc., 88, 1912–1928, 2007. 8794 Roelofs, G.-J. and Jongen, S.: A model study of the influence of aerosol size and
ACPD
9, 8791–8816, 2009Influence of entrainment of CCN
J. W. B. Derksen et al.
Title Page
Abstract Introduction
Conclusions References
Tables Figures
◭ ◮
◭ ◮
Back Close
Full Screen / Esc
Printer-friendly Version
Interactive Discussion
doi:10.1029/2004JD004779, 2004. 8793, 8794, 8795
Roelofs, G.-J. and Kamphuis, V.: Cloud processing, cloud evaporation and Angstr ¨om exponent, Atmos. Chem. Phys., 9, 71–80, 2009,
http://www.atmos-chem-phys.net/9/71/2009/. 8793, 8805
Roesner, S., Flossmann, A. I., and Pruppacher, H. R.: The effect on the evolution of the drop
5
spectrum in clouds of the preconditioning of air by successive convective elements, Q. J. Roy. Meteor. Soc., 116, 1389–1403, doi:10.1002/qj.49711649607, 1990. 8794
Segal, Y., Pinsky, M., Khain, A., and Erlick, C.: Thermodynamic factors influencing bimodal spectrum formation in cumulus clouds, Atmos. Res., 66, 43–64, 2003. 8805
Solomon, S., Qin, D., Manning, M., Alley, R. B., Berntsen, T., Bindoff, N. L., Chen, Z.,
10
Chidthaisong, A., Gregory, J. M., Hegerl, G. C., Heimann, H., Hewitson, B., Hoskins, B. J., Joos, F., Jouzel, J., Kattsov, V., Lohmann, U., Matsuno, T., Molina, M., Nichollsand, N., Over-peck, J., Raga, G., Ramaswamy, V., Ren, J., Rusticucci, M., Somerville, R., Stocker, T. F., Whetton, P. A. W. R., and Wratt, D.: Technical Summary, in: Climate Change 2007: The Physical Science Basis. Contribution of Working Group I to the Fourth Assessment Report
15
of the Intergovernmental Panel on Climate Change, Cambridge Univ. Press, Cambridge, United Kingdom and New York, NY, USA, 2007. 8792
Su, C.-W., Krueger, S. K., McMurtry, P. A., and Austin, P. H.: Linear eddy modeling of droplet spectral evolution during entrainment and mixing in cumulus clouds, Atmos. Res., 47-48, 41–58, 1998. 8793, 8794
20
Takahashi, T.: Warm rain, giant nuclei and chemical balance -a numerical model, J. Atmos. Sci., 33, 269–286, 1976. 8795
ACPD
9, 8791–8816, 2009Influence of entrainment of CCN
J. W. B. Derksen et al.
Title Page
Abstract Introduction
Conclusions References
Tables Figures
◭ ◮
◭ ◮
Back Close
Full Screen / Esc
Printer-friendly Version
Interactive Discussion Table 1. Parameters for the aerosol size distribution: aerosol concentration (n, cm−3), mean
aerosol radius (rm,µm) and standard deviation (σ).
Mode n (cm−3) rm(µm) σ
ACPD
9, 8791–8816, 2009Influence of entrainment of CCN
J. W. B. Derksen et al.
Title Page
Abstract Introduction
Conclusions References
Tables Figures
◭ ◮
◭ ◮
Back Close
Full Screen / Esc
Printer-friendly Version
ACPD
9, 8791–8816, 2009Influence of entrainment of CCN
J. W. B. Derksen et al.
Title Page
Abstract Introduction
Conclusions References
Tables Figures
◭ ◮
◭ ◮
Back Close
Full Screen / Esc
Printer-friendly Version
Interactive Discussion Fig. 2. Vertical profiles of the simulated (red) and observed (triangles) median values of(a)
ACPD
9, 8791–8816, 2009Influence of entrainment of CCN
J. W. B. Derksen et al.
Title Page
Abstract Introduction
Conclusions References
Tables Figures
◭ ◮
◭ ◮
Back Close
Full Screen / Esc
Printer-friendly Version
ACPD
9, 8791–8816, 2009Influence of entrainment of CCN
J. W. B. Derksen et al.
Title Page
Abstract Introduction
Conclusions References
Tables Figures
◭ ◮
◭ ◮
Back Close
Full Screen / Esc
Printer-friendly Version
Interactive Discussion Fig. 4. Time averaged cloud droplet size distributions for: 800, 1000, 1200, 1500 and 1600 m
ACPD
9, 8791–8816, 2009Influence of entrainment of CCN
J. W. B. Derksen et al.
Title Page
Abstract Introduction
Conclusions References
Tables Figures
◭ ◮
◭ ◮
Back Close
Full Screen / Esc
Printer-friendly Version
Interactive Discussion Fig. 5. As Fig. 2, but for four simulations: First column: base case,α=0.4,w0=1.5 m/s; second
ACPD
9, 8791–8816, 2009Influence of entrainment of CCN
J. W. B. Derksen et al.
Title Page
Abstract Introduction
Conclusions References
Tables Figures
◭ ◮
◭ ◮
Back Close
Full Screen / Esc
Printer-friendly Version
Interactive Discussion Fig. 6. Time averaged cloud droplet size distributions at 1000 m height for four simulations: