Article
Printed in Brazil - ©2016 Sociedade Brasileira de Química0103 - 5053 $6.00+0.00*e-mail: [email protected], [email protected]
Gas-Phase Conversion of Glycerol to Acetol: Influence of Support Acidity on the
Catalytic Stability and Copper Surface Properties on the Activity
Tiago Pinheiro Braga,*,a Nadine Essayem,*,b Swamy Prakashb and Antoninho Valentinic
aLaboratório de Peneiras Moleculares (LABPEMOL), Instituto de Química, Universidade Federal
do Rio Grande do Norte, Lagoa Nova, 59072-970 Natal-RN, Brazil
bInstitut de Recherche sur la Catalyse et l’Environnement de Lyon, IRCELYON, CNRS, University of
Lyon 1, 2 avenue Albert Einstein, 69626 Villeurbanne, France
cLaboratório de Adsorção e Catálise (Langmuir), Departamento de Química Analítica e
Físico-Química, Universidade Federal do Ceará, Campus do Pici, 60455-970 Fortaleza-CE, Brazil
Mesoporous mixed copper-aluminum oxides and copper-silicon oxides were synthesized with polymeric precursors route in order to evaluate the effect of the support acidity on the catalytic stability due to the carbon deposit and the copper surface characteristics on the catalytic activity for the gas-phase conversion of glycerol to acetol. The samples were characterized by different techniques such as inductively coupled plasma (ICP), thermogravimetry and differential thermal analyses (TGA-DTA), X-ray diffraction (XRD), X-ray photoelectron spectroscopy (XPS), N2 adsorption/desorption isotherms, temperature-programmed reduction with H2 (H2-TPR) and microcalorimetry of NH3 adsorption. The metallic copper surface was shown by XPS, which was observed an increase with the copper loading without marked changes between Si or Al support using the same copper content. The Cu-Al catalysts present acidic properties close to that of the pure alumina support while the Cu-Si solid is not acid, as expected. Reduced catalysts were evaluated in the reaction of glycerol conversion. The catalytic results showed a clear dependence of the glycerol conversion to acetol with the Cu metal surface and the initial catalytic properties did not depend on the support acidity, since the copper is the major active site. It was observed 95% of acetol selectivity and 80% of glycerol conversion for the best catalyst. However, the support acidity influenced the catalyst stability, since Cu-Al solid deactivated continuously by contrast to Cu-Si sample, which reached stability after 2 h of reaction. The higher acidity for the Al support leads to a greater carbon deposit compared to Si support, blocking the active sites and providing a rapid catalytic deactivation.
Keywords: copper catalysts, support acidity, catalytic stability, glycerol conversion, acetol formation
Introduction
The conversion of renewable resources, such as plant biomass, to produce fuels and chemicals, has become an important research topic in catalysis.1,2 The utilization
of biomass as renewable resources is an issue to move our economy towards a more sustainable future. The produced amounts of renewable biomass fuels, such as fatty acid methyl esters biodiesel fuel, are still increasing year by year.3 Thus, glycerol, which is the byproduct of
the biodiesel production process by transesterification of
vegetable oil, can be considered as a renewable feedstock to produce chemicals of economic interest, such as acetol, propylene glycols or acrolein, which are usually made from fossil resources.4-6
Glycerol conversion was extensively studied in liquid phase to produce propylene glycols over metallic catalysts, Ru, Pt, Ni, Cu.7,8 Gas phase studies are more recent and
have attracted increasing attention due to the possibility to obtain, in these conditions, acrolein by removing two water molecules from glycerol.9,10 Hydroxyacetone, also
reported to be formed in high selectivity when the reaction is conducted in gas phase.
Two types of catalytic systems were described to be efficient for the selective glycerol conversion to acetol in gas phase: monofunctional acid or basic catalysts and copper based materials.
At temperatures above 300 °C, acetol was obtained from glycerol over monofunctional acid catalysts such as ZrS, ZrW, ZrWSi, ZrWAl. A high yield in acetol of 74% was achieved over ZrWAl at full glycerol conversion. The authors proposed that weak acid sites were the actives ones.11 Silica-aluminum catalysts, known for their acidic
properties, were also reported as efficient catalyst for acetol formation at temperatures higher than 300 °C.12 In that
case, the authors have correlated the acetol selectivity to the presence of strong Lewis acid sites as well as the basic OH groups. Similarly, monofunctional basic catalysts were also disclosed to catalyze acetol formation in high yield at a reaction temperature as high as 360 °C.13
By contrast to acido-basic materials, copper based catalysts were disclosed to dehydrate glycerol into acetol in milder conditions, typically between 230-250 °C, at atmospheric pressure. In most cases, the metallic copper function is combined to acido-basic supports, and these bifunctional catalytic systems are reported to be efficient as well in N2 or H2 atmosphere. Copper chromite was
earlier identified as one of the most active catalysts for converting glycerol to acetol.14-16 This is well exemplified
by the selective dehydration of glycerol over CuCrO combined with the reactive distillation technology leading to acetol yields higher than 90%.17,18 The authors had
already underlined that higher acetol yields were observed under H2 atmosphere compared to N2. Moreover, copper
chromite was reported as an active system to directly produce 1,2-propanediol in H2 atmosphere.19 The authors
proposed that the high acidity of CuCrO is responsible for the first step of glycerol dehydration to acetol.
Due to the toxicity of Cr, alternative Cu based catalysts were investigated for this application. Cu/ZnO combined with various supports, Al2O3, TiO2, ZrO2 were studied in
order to investigate any synergistic effects between metallic copper and the oxide support on the gas phase glycerol dehydration in H2 atmosphere.20 The authors proposed
different route to produce 1,2- or 1,3-propanediols, but both routes involves a first acid catalyzed dehydration step via protonation of the primary or secondary hydroxyl group followed by a hydrogenation step into 1,2- or 1,3-propanediols, promoted by the metallic copper. Under H2, Cu-H4SiW12O40/SiO2 was shown to directly
convert glycerol in 1,3-propanediol via proposed reaction pathway, which involves a first dehydration step of glycerol in 3-hydroxypropanal promoted by the acid sites and a further hydrogenation step of 3-hydroxypropanal catalyzed by the Cu sites.21 Interestingly, the authors showed that
in mild conditions (210 °C), H4SiW12O40/SiO2 catalyzed
glycerol dehydration in acrolein in high yield, while Cu didn’t catalyze glycerol dehydration in 3-hydroxypropanal, the first dehydration step which could further produce acrolein via further dehydration step. One can remark that the dehydration of glycerol to 3-hydroxypropanal fits well with a Br∅nsted acid catalyzed step where the secondary hydroxyl group of glycerol is protonated, leading to a secondary intermediate carbenium ion, much more stable than the primary one, which would be formed via protonation of the primary hydroxyl groups (Scheme 2).
Copper based systems were also reported to be efficient in N2 atmosphere. In particular, Sato et al.21 reported that
acetol was produced from glycerol in high selectivity over Cr free supported Cu catalysts, but under N2 atmosphere
at moderate temperature, 250 °C. They found that the acid-base properties of the supports affected the acetol selectivity, while basic supports decreased glycerol conversion and acetol selectivity, acid supports promoted acetol selectivity. The authors concluded that the reaction of
glycerol conversion over Cu/Al2O3 is not only catalyzed by
Cu, but the acid support should assist the metallic function. Thus, they first proposed that acetol formation over Cu based catalysts might proceed via a homolytic dissociation of the primary C−OH bond to produce acetol. Recently, the mechanism proposed by Sato et al.21 was supported by
the results obtained by Bienholz et al.22 over Cu/SiO 2 in
gas phase at 250 °C, in H2 atmosphere. Indeed, the authors
observed a linear relationship between the copper surface and the TOF, indicating that copper is primarily responsible for the glycerol conversion to acetol and the acidic, basic or neutral supports have a secondary role.21,22
From this brief literature overview, it is clear that Cu based catalysts are efficient catalytic systems to promote selective glycerol conversion to acetol formation in gas phase, but it also appears that there is no agreement on the nature of the active sites nor on the prevailing mechanism and on the catalysts deactivation.
In other respects, in order to improve the performances of oxides catalysts, involving copper supported ones, intense researches are currently carried out in order to develop new methodologies for material synthesis with a focus on enhanced surface area, mesoporosity and narrow pore distribution.23-25 Among them, aluminum and silicon
oxide compositions are of great interest due to strong potential as catalyst supports.15
The polymeric precursor method derived from the Pechini method is one of this methodology, allowing the synthesis of mesoporous oxides.16 Accordingly, due to the
potential of this synthesis method,17,26 in this paper, we
present interesting results on the transformation of glycerol to 1-hydroxyacetone over mesoporous copper-silica or copper-aluminium systems obtained by the polymeric precursor route and it was studied the effect of the support acidity (Al or Si) on the catalytic stability due to the
deposited coke and the influence of copper surface aspects on the catalytic activity.
Experimental
Catalyst preparation
This method is based on the chelation of metallic cations (Cu2+, Si4+ and Al3+) by citric acid (CA) in a water
solution followed by a polyesterification of the remaining carboxylic acid function with ethylene glycol. Aluminum nitrate nonohydrate {Al(NO3)3·9H2O}, copper nitrate
trihydrate {Cu(NO3)2·3H2O}, tetraethylorthosilicate
(TEOS), citric acid monohydrate (CA) {C6H8O7·H2O},
and ethylene glycol (EG) {C2H6O2} were used as starting
chemicals. A CA/metal ratio of 2:1 (mol) was used for all the samples. The metal amount is the sum of Cu, Al or Si. The mass ratio of CA/EG was kept at 2:3. The different samples were labeled as xCuSi or xCuAl, with x denoting the Cu molar percentage (100 × Cu/Al + Cu or 100 × Cu/ Si + Cu ). The sample containing only aluminum oxide was denominated Al.
For the synthesis process of the 3CuAl sample, where 3 is the mol% of Cu/(Cu + Al), 0.0038 and 0.110 mol of Cu and Al salts, respectively, were dissolved in distilled water at room temperature. CA (0.2312 mol) was dissolved in ethanol at 50 ºC. Then the aqueous solution was added to the CA-ethanol solution and stirred during 60 min at 50 ºC. Subsequently, the EG (0.3497 mol) was added, and the mixture was stirred for 4 h at 100 ºC until it became a viscous resin. The resin was treated at 300 ºC for 1 h under air. The resulting precursor composite was ground and treated at 500 ºC under air flow for 2 h. Similar conditions were used to prepare the other samples 1CuAl, 7CuAl, 8CuSi and Al.
Catalysts characterizations
The solids were analyzed by inductively coupled plasma-atomic emission spectrometry (ICP-AES) after dissolution by acid attack. The analyzed Cu contents by ICP are the expected ones (Table 1).
The pyrolysis step was monitored by thermogravimetric analysis (TGA) and differential thermal analysis (DTA), using a 5 ºC min-1 heating rate, under air flow of 40 mL min-1
and 30 mg of sample. The crystal structure of the metal oxides was characterized by X-ray diffraction analysis (XRD), with Cu Kα irradiation source (λ = 1.540 Å, 40 kV and 40 mA).
Catalysts specific surface area (BET) and pore volume were determined by N2 adsorption/desorption isotherms, at
liquid nitrogen temperature. The catalyst samples (80 mg) were vacuum pretreated at 200 °C for 1 h.
The acid properties were measured by calorimetry of NH3 adsorption at 80 °C, using a Tian-Calvet calorimeter
coupled with a volumetric equipment. The reduced solids (0.1 g), placed in the calorimetry cell, were first vacuum treated at 400 °C for 2 h. After the pre-treatment, the cell was then introduced in the calorimeter at 80 °C and the experiment was performed. The oxide samples were then contacted with small doses of NH3 up to equilibrium and the
differential enthalpy of adsorption was recorded together with the amount of adsorbed ammonia.
X-Ray photoelectron spectroscopy (XPS) analysis were performed on the calcined samples and after in situ reduction at 250 °C, in equipment connected to the XPS spectrometer. The XPS analyses were carried out on a Kratos Ultra DLD spectrometer using monochromated Al Kα radiation (10 mA, 15 kV). All spectra were taken in the hybrid (combined electrostatic and magnetic lens) mode. All spectra were referenced to the C1s line at binding energy 284.6 eV, characteristic of ever-present adventitious carbon (C−C and C−H). This peak position was obtained after Shirley background subtraction and decomposition of the C1s peak envelope using a Gaussian-Lorentzian (70-30%) curve fit. All other photoelectron peaks were background-subtracted and curve-fit in the same manner. Quantification was carried out with the VISION software supplied. The relative sensitivity factors (RSF) applied here are inherent to this software and incorporate Wagner photoelectron cross-sections and analyser transmission correction.
The temperature of reduction for the CuO based catalysts was obtained by temperature-programmed reduction (H2-TPR) analysis from 25 to 930 °C in a
quartz reactor using a 8% H2/N2 mixture (25 mL min-1) at
a heating rate of 10 °C min-1 and 20 mg of the catalyst. A
thermal conductivity detector was used to follow the H2
consumption.
Catalytic activity
Catalytic tests were carried out in a fixed bed microreactor, using 200 mg of catalyst. All fresh catalysts were firstly reduced in H2 (25 mL min-1) at 250 °C for 1 h.
Then, an aqueous solution of glycerol at 10 wt.% was pumped at the feed rate of 1.8 cm3 h-1,then vaporized and
fed through the reactor in a down flow mode together with a gas (hydrogen) flow rate of 25 mL min-1. The glycerol
feed corresponded to 0.06 mol of glycerol per hour. The liquid products were collected in an ice-water-salt trap (−6 °C) in order to be analyzed, every hour by the gas chromatography-mass spectrometry (GC-MS). A gas chromatography-flame ionization detector (GC-FID) was connected to the gas effluent. The capillary column was purchased from Varian, CP 9048 (length: 30 m, diameter: 0.32 mm, thickness of the stationary phase: 0.1 mm). Carbon balances were between 77 and 88% in the catalytic experiments. Glycerol conversion and acetol selectivity were calculated in the following way:
(1)
(2)
Results and Discussion
Thermal analysis
Figure 1 shows the TGA-DTA curves of the precursor powder that were obtained after heating the synthesized polymeric resin at 300 °C for 1 hour in air. The first weight loss (100-150 ºC) is ascribed to the release of physisorbed water and remaining ethylene glycol (organic precursor). This event corresponds to an endothermic peak in the DTA curve. The main weight loss is observed from 300 to 500 °C for the Cu-Al samples. For the Cu free sample, Al, or 8CuSi the weight losses was prolonged at higher temperature, 550 and 600 °C, respectively. These important weight losses are related to the decomposition of the residual organic material that corresponds to a breakaway of the polymeric chains formed by the polyesterification reaction as well as to the decomposition of nitrates wastes.27,28 This process occurs
with an important exothermic phenomenon, as pointed out in the DTA curves.
carbon elimination. This suggests that copper might catalyze the elimination of the organic precursors. However, this seems to be true only for the CuAl system, since over CuSi, the carbon release was observed up to 600 °C.
This shift in the temperature events can influence the texture and morphology of the samples. Employing organic compounds (CA and EG) in the preparation of the catalysts, which are removed as volatile materials during the calcination steps, probably results in cavities formations and simultaneous formation of the oxides structure. The textural properties of the materials (specific surface areas, pores diameter and pores volume) and the structural features of the final oxides are most closely related to the calcination process.
X-Ray diffraction
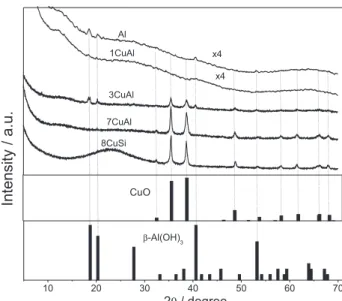
The X-ray diffraction patterns are presented in Figure 2. It is observed that the samples Al and 1CuAl are poorly crystalline materials and present X-ray patterns of an amorphous solid. Nevertheless, the 2θ degree value of the broader peaks (18.6, 20.4, 40.6 and 53.3 degrees) and their relative intensities suggest the β-Al(OH)3 phase formation
(JCPDS 00-008-0096) for the 3CuAl and Al solids. On the other hand, the samples 3CuAl, 7CuAl and 8CuSi display the formation of a single Cu phase (CuO, JCPDS 04-006-2679).
The CuO crystallites sizes of the samples were calculated from the XRD patterns using the Debye-Scherrer
formula. The results indicate the comparable sizes of crystalline CuO phase with average crystallites sizes of 24.6, 23.5 and 26.1 nm for 3CuAl, 7CuAl and 8CuSi, respectively. Furthermore, one can note that the Cu loading increase does not result in larger CuO crystallites, which do not seem to depend on the nature of the support, Si or Al oxides. This probably accounts for the synthesis method which prevents ionic interactions between the mineral precursors caused by the chelating properties of citric acid as regards to the Cu cations. Moreover, the relative high-temperature calcination, 500 °C, as regards to the sintering ability of copper might also contribute to the close Cu crystallites sizes obtained for the different systems.
Specific surface area results
The nitrogen adsorption/desorption isotherms are presented in Figure 3. The samples Al, 1CuAl, 3CuAl and 7CuAl showed similar isotherms characteristic of mesoporous materials (type II according to IUPAC classification and H3 hysteresis loop). This is usually assigned to slit-shaped pores due to aggregates of particles. On the other hand, the sample 8CuSi presents isotherms type IV, characteristic of mesoporous catalyst (H2 hysteresis loop). Type H2 loop indicates that the pore structure is complex and tend to be made of interconnected networks of pores with different sizes and shapes.29 These
differences are confirmed by the pores diameter distribution (Barrett-Joyner-Halenda (BJH) method).
Table 1 lists the specific surface area (SBET), total
pore volume (Vp) and average pores diameter (Dp) of solids. The increase of the copper loading in the Al oxides solids provides samples with improved textural features.
Figure 1. Thermal analysis: TGA profile and the respective DTA.
8CuSi possesses a significant higher specific surface area (603 m2 g-1) and total pore volume (0.6 cm3 g-1), in
comparison with the other catalysts (Al, 1CuAl, 3CuAl and 7CuAl) which have specific surface areas lower than 100 m2 g-1, however, the materials are mesoporous in all
cases, with pore size of 40.0 Å. Thus, it appears that the nature of the component used as support influences greatly the textural properties, probably caused by the type of inorganic precursor. Indeed, the Al and Si precursors are distinct, Al nitrate and tetraethylorthosilicate (TEOS), respectively. Thus, starting from TEOS in the case of silica might, most likely, prevents the formation chelated Si specie with citric acid and thereafter a different process
might have occurred. These differences were also observed in the TGA-DTA results (Figure 1).
XPS analysis
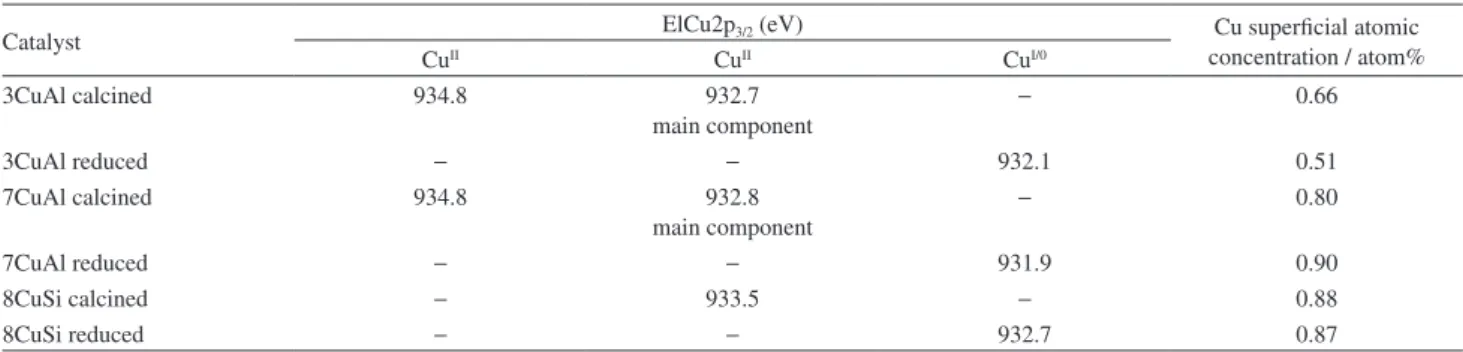
Quantitative XPS analysis of the calcined samples show that the superficial atomic concentration of copper increased from 3CuAl to 7CuAl, logically. Note that the Cu coverage of 7CuAl and 8CuSi are very close. Moreover, the results indicate that the Cu coverage was not changed significantly after the reduction step at 250 °C (Table 2). These results, combined with the isotherms data, indicate that despite the sample 8CuSi have greater surface area related to the solid 7CuAl the Cu surface coverage is very similar, probably indicating that the catalytic performance for these two catalysts will be very close for reactions in which copper is the major active site.
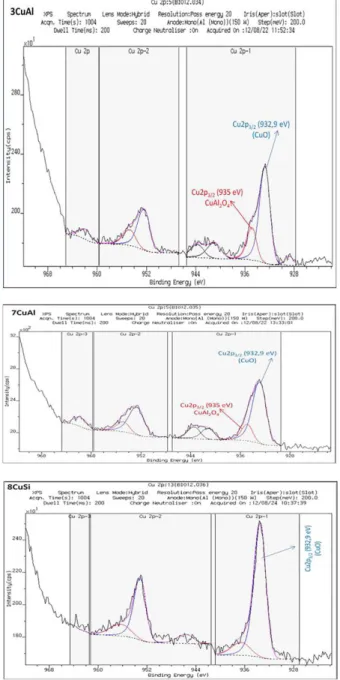
For 8CuSi, the Cu2p3/2 photoelectron spectrum present a
main peak observed at 932.9 eV, and satellite lines at higher binding energy values, characteristic of CuII oxydation state
(Figure 4). The binding energy of the main Cu2p3/2 peak is
in good agreement with the presence of CuO, as observed in XRD results (Figure 2).
For 3CuAl and 7CuAl, the Cu2p3/2 photoelectron
spectrum shows a main component at 932.9 eV with a shoulder at higher binding energy, 935 eV, which represents ca. 30% of the total peak area. One can notice that for 3CuAl and 7CuAl, the relative intensity of the satellite peaks are higher compared to 8CuSi (Figure 4).
Figure 3. N2 adsorption/desorption isotherms of the catalysts.
Table 1. Chemicalanalyses, textural properties and amount of carboneous deposits on the spent catalysts
Sample Cu / wt.% SBET / (m2 g-1) Vp / (cm3 g-1) Dp / nm C / wt.%
Al − 7 0.03 15.3 4.2
1CuAl 0.66 32.0 0.04 8.5 6.5
3CuAl 3.16 41.4 0.06 10.6 5.3
7CuAl 6.75 99.2 0.06 8.2 20.6
8CuSi 7.80 603.6 0.6 4.0 7.0
SBET: Specific surface area ; Vp: total pore volume ; Dp: average pores diameter; C: Carbon content obtained from TGA analysis of spent catalysts recovered
after 5 h of recation in standard conditions.
Table 2. XPS analyses of calcined and reduced samples: binding energies of Cu2p3/2, Cu superficial atomic concentrations
Catalyst ElCu2p3/2 (eV) Cu superficial atomic
concentration / atom%
CuII CuII CuI/0
3CuAl calcined 934.8 932.7
main component
− 0.66
3CuAl reduced − − 932.1 0.51
7CuAl calcined 934.8 932.8
main component
− 0.80
7CuAl reduced − − 931.9 0.90
8CuSi calcined − 933.5 − 0.88
One can recall that it was previously reported that the intensity of the satellite bands (Isat) compared to that of the
main peak (Imp), was correlated with the Cu2+ symmetry.
Thus, for CuO where Cu2+ is in a square planar symmetry,
an Isat/Imp value close to 0.5 was reported when Cu2+ is in
a spinel structure; in a tetrahedral environment, a higher relative intensity of the satellite bands was measured up to 0.8.30,31 Thus, for 7CuAl, the presence of the shoulder at
935 eV, a higher binding energy value than that tabulated for CuO and already reported for the spinel CuCr2O4
together with the presence of more intense satellite bands, strongly support the partial insertion of Cu in a spinel phase such as CuAl2O4 which would exist, at least, on the
surface. After in situ reduction at 250 °C, the satellite peaks disappeared logically and the Cu2p3/2 photoelectron spectra
present a single finer peak at ca. 932 eV for all samples, characteristic of the reduced species CuI and/or Cu0
(Figure 5). Unfortunately, we failed to discriminate between the formation of metallic copper, Cu0 or CuI species based
on the kinetic energy of the auger electrons L3M4.5M4.5,
because the signals were too broad, which precludes any reliable measure. Thus, temperature programmed reduction analysis is indispensable to confirm the copper oxidation state after the reduction step at 250 °C.
Temperature programmed reduction (TPR)
H2-TPR profiles of different samples presented a
single band of hydrogen consumption (Figure 6). The TPR results showed the influence of the support (Al or Si oxide) on the reducibility of copper oxide, which is evidenced for low amounts of CuO. The solid 1CuAl with the slightest amount of copper oxide has a higher
Figure 4. Cu2p3/2 photoelectron spectra for calcined samples, 3CuAl,
7CuAl and 8CuSi.
Figure 5. Cu2p3/2 photoelectron spectra for reduced samples, 3CuAl,
reduction temperature compared to the catalyst 7CuAl, probably due to the greater interaction between copper oxide and the Al support.
Furthermore, as expected, the intensity of Cu2+
reduction peaks increase with the increase of copper amount, confirming that the formed peak is incontestably related to the reduction of CuO (majority) and copper spinel (minority), as seen in the X-ray diffractograms (Figure 2) and XPS results (Figures 4 and 5).
On the other hand, the solid 8CuSi shows the formation of a shoulder around 220 °C and an intense band at 255 °C. The shoulder at 220 °C may indicate the presence of Cu+,
while the second one may be due to the reduction of Cu2+
species to Cu0; again in agreement with the XRD and XPS
results. H2-TPR results confirmed the presence of CuI and
Cu0 after pre-treatment in hydrogen atmosphere at 250 °C
before the reaction, considering that the copper oxide was not completely reduced at this temperature.
However, based on published work32 and considering
that there was the formation of copper oxide nanoparticles as observed in the X-rays results, one cannot rule out the possibility that the observed shoulder is related to highly dispersed CuO species (more easily reducible) and the second peak is concerning the reduction of CuO bulk (more difficult to reduce). Additionally, it is known that a copper oxide particle located within the pores of the support shows a harder reduction process compared to a particle positioned on the external surface. Thus, this may also be linked with the textural properties (Figure 3).
It is important to report that it is given a great attention for the change of the catalytic phase and the oxidation state of copper during the glycerol conversion.33-35 It was
already mentioned that the presence of Cu0/CuI and the
synergetic effect of Cu0 and Cu+ may favor the conversion
of glycerol to acetol and 1,2-propanediol under specific
reaction conditions.36-41 Xiao et al.33 proposed that the
metal copper was mainly responsible for the activation of hydrogen, while Cu+ was for dehydration due to the
presence of Lewis acid sites. The dehydration also takes place at metallic copper site, since glycerol may also be dehydrated to acetol. Thus, according to the H2-TPR and
XPS results, which indicate the presence of Cu0 and Cu+
in the applied reaction conditions, it is expected that the solids present interesting catalytic properties in the glycerol conversion to acetol and 1,2-propanediol.
Furthermore, it is probable that under the employed reaction conditions the acetol selectivity is larger compared to the 1,2-propanediol selectivity, since the reaction rate in the hydrogenation is much lower compared to the reaction rate of the dehydration of glycerol. Under atmospheric pressure and elevated temperature the 1,2-propanediol production is disadvantaged, since the hydrogenation of acetol is an exothermic reaction.33-35,40,41
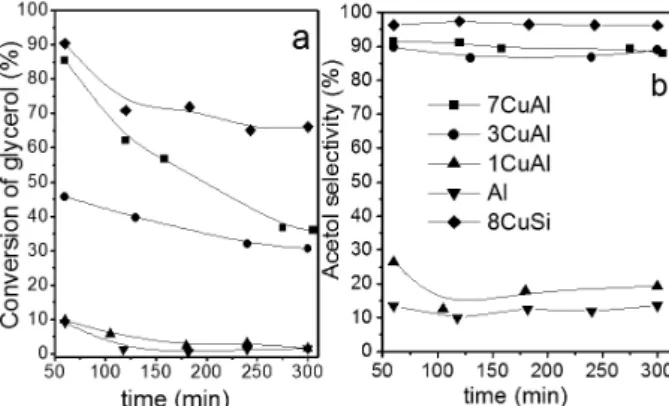
Catalytic activity
The catalytic performances of the samples are depicted in Figure 7a (conversion of glycerol) and Figure 7b (acetol selectivity). The samples with the highest copper loading are active and highly selective, with acetol selectivity higher than 90% (7CuAl and 8CuSi) and an initial glycerol conversion higher than 85%. Note that if these two catalysts present different BET surface area, the reduced samples present similar Cu surface as determined by XPS analysis (Figure 4 and Table 2). This similar copper surface may be correlated with the same initial glycerol conversion measured on 7CuAl and 8CuSi. However, the catalytic activities of these two catalysts show distinct evolutions with time on stream. The 8CuSi sample presents a short initial deactivation, however, its catalytic activity is stabilized after 2 h with glycerol conversion and acetol selectivity of 66 and 96%, respectively. Other products
Figure 6. Temperature programmed reduction curves of the catalysts.
are observed in low amount, such as 1,2-propanediol, propanoic acid and small amounts of acetic acid.
Among the Al-Cu series, 7CuAl exhibits the best catalytic properties (Figure 7). In particular, one can notice that the initial activity measured on 7CuAl and 3CuAl are closely correlated with the Cu surface measured by XPS on the reduced samples. On the other hand, pure aluminum oxide is almost inactive and less selective for hydroxyacetone. Its behavior is comparable to 1CuAl, with less than 1 wt.% of Cu.
It is important to highlight that when the reactions are performed under N2 atmosphere, all the samples exhibited
very poor activities.
All these results strongly suggest that reduced copper species are the active species for the selective conversion of glycerol to acetol under the reaction condition, while the Al and Si supports would not play a major role in acetol selective formation in agreement with previous reports from Bienholz et al.22 However, copper metal sites combined
with an appropriate support can play a major role in the activity, selectivity and stability of samples.21
In spite of the equivalent initial glycerol conversion for 7CuAl (86%) and 8CuSi (90%) well correlated to their copper surface (XPS results), 7CuAl solid shows a continuous deactivation during the course of the reaction while 8CuSi is rapidly stabilized. 3CuAl shows also a deactivation, but less pronounced than 7CuAl (Figure 7). Hence, one can think that the gradual catalyst deactivation is probably caused by the acidity of the aluminum based support, which leads to higher carbon deposition.
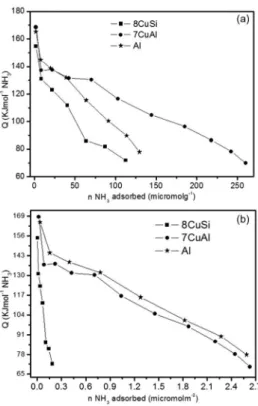
Calorimetric measurements are generally considered as a reliable technique to measure the acidic strength of solid acids in addition to the quantification of the number of acid sites when isotherms of the acid probe molecules adsorption are recorded in parallel. Therefore, in order to confirm that the pronounced deactivation of 7CuAl compared to 8CuSi is due to the higher acidity of the Al support compared to the Si support, the reduced samples Al, 7CuAl and 8CuSi were analyzed by calorimetry of NH3 adsorption (Figure 8).
The calorimetry results presented in Figures 8a and 8b confirm that the samples containing aluminium oxide (Al and 7CuAl) show superior acidity compared to the silica-based oxide (8CuSi). If the three solids present a few amount of strong acid sites with a differential heat of NH3 adsorption
higher than 160 kJ mol-1, the specific amounts of acid sites
of intermediate strength, with a differential heat of NH3
adsorption higher than 110 kJ mol-1 are significantly higher
for the Al based solids. The calorimetric curve of 8CuSi which shows a rapid decrease of the differential heat of NH3
adsorption give evidences of the poor acidity of the silica support, as expected. On the other hand, it was observed
for the catalysts based on Al, a larger number of acid sites, but the surface is heterogeneous in term of acid strength, according to the progressive decrease of the differential heat of NH3 adsorption with the NH3 coverage. Furthermore, it is
observed that 7CuAl and the Cu free Al solid present similar calorimetric curves when the amount of absorbed NH3 is
expressed per m2. This indicates that reduced Cu species
do not provide additional acid sites nor modify the intrinsic acidic features of the support in a significant way.
To further consolidate the cause of deactivation during the reaction, the spent catalysts were analyzed by TGA and the results are presented in Table 1. The results indicate the marked higher carbon amount determined on 7CuAl compared to 8CuSi, 20.6 against 7.0 wt.%. Therefore, this result confirms the origin of the deactivation. The acidity of the Al based catalyst favors the formation of carboneous deposits on the surface due to its acidity, which may indirectly hinder the reduced copper role in the glycerol dehydration due to the covering of active sites by carbon. Thus, it is essential to control the acid-metallic properties in order to obtain good results of catalytic activity, selectivity and especially stability.
Conclusions
In this paper, mesoporous mixed copper-aluminum and copper-silicium oxides were synthesized by the polymeric
Figure 8. Differential heat of NH3 adsorption as a function of NH3
precursor method and tested as catalysts in the gas-phase conversion of glycerol to acetol in H2 atmosphere, in mild
temperature conditions, 250 °C and under atmospheric pressure. The selective glycerol conversion to acetol depends directly on the copper surface as determined by XPS analysis performed on in situ reduced solids. The nature of the support component, Si or Al, does not influence the initial catalytic performances, using the same copper content with a similar copper surface, but affect the stability of the catalytic systems. While Cu supported on the silica support exhibits a good catalytic stability after 2 h of reaction, the Cu-Al systems exhibit continuous deactivations which were correlated to the acidity of the Al support as clearly shown by calorimetry of NH3 adsorption.
The greater acidity for the acid Al support provides a higher carbon deposit compared to Si neutral support, justifying the sharp deactivation for the 7CuAl solid due to covering of the active sites by coke.
The results of XPS and H2-TPR analysis together with
the results of calorimetry support the mechanism in which the active species for glycerol dehydration to acetol is a reduced Cu species CuI and/or Cu0. The acid sites present
on the Cu based catalyst do not participate effectively in the dehydration step for the experimental conditions used, playing a secondary role, but they have a negative role on the catalyst stability due to the excessive carbon deposit.
Therefore, the proposed mechanism should most likely proceed via homolytic cleavage of the primary C−OH of glycerol by the reduced copper species. This model, already proposed,21,22 is in good agreement with the
reaction product, acetol, which can hardly be formed via a primary carbenium ion formation as intermediate which is thermodynamically stable under atmospheric pressure and mild temperature.
Acknowledgments
The authors acknowledge the Universidade Federal do Ceará (UFC) and Institut de Recherches sur la Catalyse et l’Environnement de Lyon (IRCELYON) in Lyon-France.
References
1. Huber, G. W.; Iborra, S.; Corma, A.; Chem. Rev. 2006, 106,
4044.
2. Corma, A.; Iborra, S.; Velty, A.; Chem. Rev. 2007, 107, 2411.
3. Akiyama, M.; Sato, S.; Takahashi, R.; Inui, K.; Yokota, M.; Appl Catal., A 2009, 371, 60.
4. Liu, Z.; Wang, J.; Kang, M.; Yin, N.; Wang, X.; Yisheng, T.; Zhub, Y.; J. Braz. Chem. Soc. 2014, 25, 152.
5. Maris, E. P.; Davis, R. J.; J. Catal. 2007, 249, 328.
6. Satyanarayana, M.; Pudi, P. P.; Shashi Kumara, S.; Sarkar, B.; J. Braz. Chem. Soc. 2015, 26, 1551.
7. Huang, Z.; Cui, F.; Xue, J.; Zuo, J.; Chen, J.; Xia, C.; Catal. Today 2012, 18, 342.
8. Lima, C. L.; Vasconcelos, S. J. S.; Filho, J. M.; Neto, B. C.; Rocha, M. G. C.; Bargiela, P.; Oliveira, A. C.; Appl Catal, A
2011, 399, 50.
9. Carolina, F. M.; Pestana, A. C. O.; Guerra, G. B. F.; Cássia, C. T.; Mota, J. A.; J. Braz. Chem. Soc. 2013, 24, 100.
10. Raju, G.; Reddy, P. S.; Reddy, B. M.; The Open Catal. J. 2011,
4, 83.
11. Kim, Y.; Jurg, K. D.; Park, E. D.; Appl. Catal., B 2011, 107,
177.
12. Kinage, A. K.; Upare, P. P.; Kasinathan, P.; Hwang, Y. K.; Chang, J. S.; Catal. Comm. 2010, 11, 620.
13. Dasari, M. A.; Kiantsimkal, P. P.; Sutterlin, W. R.; Supped, G. J.; Appl. Catal., A 2005, 281, 225.
14. Chiv, C. W.; Dasari, M. A.; Suppes, G. J.; Sutterlin, W. R.; AIChe J. 2006, 22, 3543.
15. Valentini, A.; Carreño, N. L. V.; Leite, E. R.; Longo, E.; Appl. Catal., A 2006, 310, 174.
16. Braga, T. P.; Teixeira, C. V.; Pinheiro, A. N.; Valentini, A.; Appl. Catal., A 2009, 366, 193.
17. Chin, C. W.; Tekeci, A.; Sutterlin, W. R.; Ronco, J. M.; Suppers, G. J.; AIChe J. 2008, 54, 2456.
18. Mane, R. B.; Ghalwaddkar, A. A.; Hengne, A. M.; Suryawanski, Y. R.; Rode, C. V.; Catal. Today 2011, 164, 447.
19. Feng, Y.; Yin, H.; Wang, A.; Shen, L.; Yu, L.; Jiang, T.; Chem. Eng. J. 2011, 168, 403.
20. Huang, L.; Zha, Y.; Zheng, H.; Ding, G.; Li, Y.; Catal. Lett.
2009, 131, 312.
21. Sato, S.; Akiyama, M.; Takahashi, R.; Hara, T.; Inui, K.; Yokota, M.; Appl. Catal., A 2008, 347, 186.
22. Bienholz, A.; Hofman, H.; Claus, P.; Appl. Catal., A 2011, 391,
153.
23. Piertron, J. J.; Stroud, R. M.; Rolison, D. R.; Nano Lett. 2002,
2, 545.
24. Beaudet, L.; Hossain, K. Z.; Mercier, L.; Chem. Mater. 2003,
15, 327.
25. Braga, T. P.; Sales, B. M. C.; Pinheiro, A. N.; Valentini, A.; Cata. Scien. Tec. 2011, 1, 1383.
26. Ries, A.; Simões, A. Z.; Cilense, M.; Zaghete, M. A.; Varela, J. A.; Mater. Charact. 2003, 50, 217.
27. Forti, J. C.; Olivi, P.; de Andrade, A. R.; Electrochim. Acta 2001,
47, 913.
28. El-Shobaky, G. A.; Turky, A. M.; Mostafa, N. Y.; Mohamed, S. K.; J. Alloys Compd. 2010, 493, 415.
29. Frost, D. C.; McDowell, C. A.; Ishitani, A.; Mol. Phys. 1974,
24, 861.
30. D’Huysser, A.; Wrobel, G.; Bonnelle, J. P.; Nouv. J. Chim. 1982,
31. Essayem, N.; Barrault, J.; Guimon, C.; Appl. Catal., A 1993, 102, 137.
32. Luo, M.; Xie, Y.; J. Mol. Catal. A: Chem. 2005, 239, 243. 33. Xiao, Z.; Wang, X.; Xiu, J.; Wang, Y.; Williams, C. T.; Liang,
C.; Catal. Today 2014, 234, 200.
34. Dam, J. T.; Hanefeld, U.; ChemSusChem 2011, 4, 1017.
35. Baertsch, C. D.; Komala, K. T.; Chua, Y.; Iglesia, E.; J. Catal.
2002, 205, 44.
36. Mane, R. B.; Yamaguchi, A.; Malawadkar, A.; Shirai, M.; Rode, C. V.; RSC Adv. 2013, 3, 16499.
37. Velasquez, M.; Santamaria, A.; Batiot-Dupeyrat, C.; Appl. Catal., B 2014, 160, 606.
38. Sato, S.; Akiyama, M.; Takahashi, R.; Hara, T.; Inui, K.; Yokota, M.; Appl. Catal., A 2008, 347, 186.
39. Yue, H.; Zhao, Y.; Ma, X.; Gong, J.; Chem. Soc. Rev. 2012, 41, 4218.
40. Braga, T. P.; Essayem, N.; Valentini, A.; RSC Adv. 2015, 5, 93394.
41. Braga, T. P.; Essayem, N.; Valentini; Quim. Nova. 2016, in press, DOI: 10.5935/0100-4042.20160074.
Submitted: February 2, 2016