Article
0103 - 5053 $6.00+0.00*e-mail: [email protected]
Electrical and Magnetic Properties of Quaternary Rare Earth
Thiophosphate: K
4Sm
2[PS
4]
2[P
2S
6]
Víctor Manríquez,*,a Antonio Galdámez,a Andrea Cerda-Monje,a Octavio Peñab and Ricardo E. Ávilac
aDepartamento de Química, Facultad de Ciencias, Universidad de Chile, Casilla 653, Santiago, Chile
bSciences Chimiques de Rennes, UMR 6226, Université de Rennes 1, 35042 Rennes cedex, France
cDepartamento de Materiales Nucleares, Comisión Chilena de Energía Nuclear, Casilla 188-D, Santiago, Chile
O tiofosfato quaternário de metal alcalino e terra rara K4Sm2[PS4]2[P2S6] foi sintetizado pelo método cerâmico e caracterizado por difratometria de raios X de pó (XRD), microscopia eletrônica de varredura com microanálise de raios X (SEM-EDX), medidas de impedância eletroquímica e medidas magnéticas. A estrutura cristalina consiste de camadas de 2∞Sm
2[PS4]2[P2S6]4−separadas
por cátions K+. As medidas de condutividade elétrica indicam que o composto é um semicondutor
com uma resistividade de 1,0 x 10¹¹ Ω cm. O momento magnético, obtido a partir de χ−1versus T
a baixa temperatura, é igual a 0,57 μB.
The quaternary alkali metal, rare earth thiophosphate phase K4Sm2[PS4]2[P2S6]was synthesized by ceramic method and characterized by powder X-ray diffraction (XRD), SEM-EDX scanning electron microscope-microprobe analyses, electrochemical impedance and magnetic measurements. The crystal structure consists of layers of 2∞Sm
2[PS4]2[P2S6]4− separated by K+ cations. The electrical
conductivity measurements indicate that the compound is a semiconductor with a resistivity of 1.0 x10¹¹ Ω cm. The magnetic moment, evaluated from χ−1 versus T at low temperature is 0.57 μ
B.
Keywords: thiophosphate, electrical properties, magnetic properties
Introduction
The study on chalcophosphates of the type AMXPYQZ
(where A and M are metals and Q = S, Se) deserves a strong attention due to their anisotropic physical properties, as thermoelectric and nonlinear optics behaviors.1-5 Moreover,
these phases present a great variety of structures in the solid state. A structural representation considers them as salts formed by the ions A+Mm+ and P
YQZn−. They possess
the structural anionic units PYQZn−, with chalcogen-phosphorus bonds, coordinated to the metals A and M through chalcogen atoms Q. The present investigation on chalcophosphate compounds has been oriented to the synthesis of quaternary phases to form salts, taking advantage of the lexibility and stability of the anions PYQZn− (Q = S, Se) and their capability to form compounds with cations in several oxidation states.
Many quaternary rare-earth metal thiophosphates have been prepared and characterized structurally.
Examples of reported rare-earth thiophosphates include phases such as: K6Yb3(PS4)5,6 Li
9Nd2(PS4)5,7 K3Gd3(PS4)4
and K9Gd(PS4)4,8 K
3CeP2S8,9 Na(RE)P2S6 (RE = Y, Sm)
and KSmP2S7,10 K
2NdP2S7,11 KErP2S7, NaErP2S6 and
Cs3Er5(PS4)612 and Li
9Gd2(PS4)5.13 These compounds
present [PS4]3−, [P
2S6]4− and [P2S7]4− anions coordinated
to the metal rare-earth ions through sulfur atoms. In the course of our work on quaternary heterocharged metal thiophosphates we have previously reported the crystal structures of the layered phases KMP2S6 (M = Bi, Sb)14, 15 and the α- and β-phases of NaSbP
2S6.16
In these phases the layers are formed by ethane-like anions [P2S6]4− bridging the M3+ metal atoms, which are held
together by layers of alkali cations. Our investigation of quaternary systems containing alkali metals, rare-earths (3+), phosphorus and sulfur has yielded a new samarium thiophosphate: K2SmP2S7, which contains the anionic units [P2S6]4−and [PS
4]3−.17 We report herein the electrical
Experimental
The preparation of the phase K2SmP2S7 was
carried out by direct combination, in stoichiometric amounts, of powders of the corresponding high purity elements (99.99%, Aldrich). The reaction mixture was sealed in evacuated quartz ampoules and placed in a programmable furnace. All manipulations were carried out under Ar atmosphere. The mixture was heated to 800 ºC at 10 ºC h−1. After ive days, the reacted
matter was slowly cooled to room temperature at a
rate of 6 ºC h−1. The ampoule was opened to reveal a
formation of yellow crystals. The reaction mixture was washed with DMF and anhydrous ether. (Found values: K, 15.66; Sm, 29.43; P, 11.22; S, 43.69%. Calculated values: K, 15.19; Sm, 29.20; P, 12.03; S, 43.58%). The product appeared to be air and moisture stable over several weeks.
The X-ray diffraction (XRD) data were collected at room temperature with a Siemens D-5000 X-ray
powder diffractometer, using Cu-Kα radiation in the
range 5º < 2θ < 60º. Qualitative comparison of the experimental powder pattern with calculated powder
pattern of known crystal structure was performed.17
Elemental analysis conirming the chemical composition of the powder was obtained from energy dispersive spectroscopy (EDS) on a JEOL 6400 scanning electron microscope system equipped with an Oxford LinK ISIS microanalyzer. Differential thermal analysis (DTA) and thermogravimetric analysis (TGA) were performed on a Rheometric Scientiic STA 1500H/625 thermal analysis system. The DTA/TGA curves were run simultaneously on each sample from room temperature to 1000 ºC, in
lowing nitrogen at a heating rate of 10 ºC min−1.
The electrical properties were studied by dc
current-voltage measurements using a Keithley model 237 source-electrometer and by impedance-frequency analysis using a Solartron Instruments model 1260 analyzer. 156.5 mg
of powder were pressed at ca. 3.92 tons (927 MPa)
for 30 s, resulting in a pellet of 7.27 mm diameter and thickness of 1.35 mm, corresponding to an average
density of 2.79 g cm−3. Gold electrodes, 10 nm thick,
were deposited by sputtering.
The magnetic measurements were performed on a Quantum Design MPMS XL5 SQUID magnetometer, under a static ield of 2.5 kOe and with increasing temperatures from 2 K up to 300 K. 134.9 mg of powdered sample were placed inside a gelatin capsule, of which the diamagnetic contribution (less than 3% at room temperature) was subtracted from the overall signal.
Results and Discussion
We have previously reported the crystal structures of the layered phases of a new samarium thiophosphate K4Sm2[PS4]2[P2S6].17 A description of the structure is briely
recalled here. The phase K2SmP2S7 has a two-dimensional layered structure as shown in Figure 1. The layered structure
contains Sm3+ ions coordinated by three [PS
4]3− and
one [P2S6]4− anions. There are two crystallographically
different K+ cations coordinated to S atoms. The packing
of K2SmP2S7 is formed by [Sm2[PS4]2[P2S6]]4− layers, in the
ab-plane, separated by K+ cations.
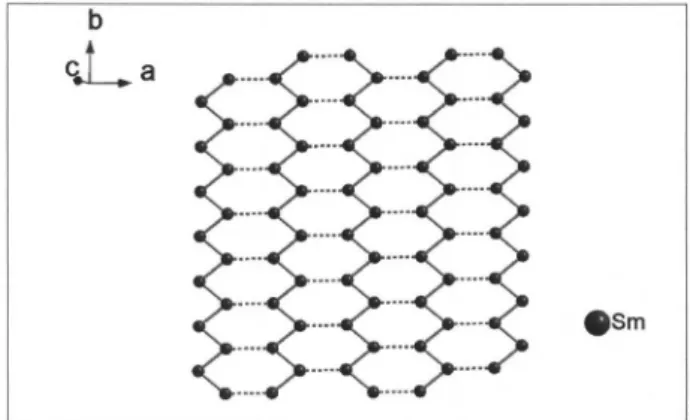
The monolayer of Sm3+ cations arrangement can be
seen as a graphite-like coniguration in the zig-zag chain pattern, as shown in Figure 2. The closest Sm-Sm distance within the layers is 5.307 Å.
The X-ray powder diffractograms (XRD) of the K2SmP2S7 phase show sharp lines that relect the crystallinity and homogeneity. The XRD was completely indexed, and the observed interplanar spacing showed a good agreement with that calculated from the crystal structure.17 Elemental
analysis was carried out, which, together with the sharp XRD pattern, evidences the purity of the studied samples. Figure 1. Crystal structure of K2SmP2S7 down the b-axis.
The differential thermal and thermogravimetric analyses (DTA/TGA) showed a slight weight loss of approximately 5% in the interval 37-550 ºC, which may be assigned to partial sulfur loss. Then, the mass continues to reduce until the temperature reaches 1000 °C. The DTA exhibited a sharp exothermic peak at 550 ºC. These results are shown in Figure 3. The irst stage of decomposition can be attributed to the partial sulfur loss. In a second stage, at 550 ºC, the thiophosphate phase decomposes to sulphides and phosphides, which were identiied by XRD analysis of the residues.
Before electrical characterization the pellet was mounted in the test chamber, and the assembly was evacuated (below 10−4 mbar) for 1 h, at ambient temperature. Cycling the bias
over ± 100 V at 1 V s−1 leads to a hysteresis of 0.41 nA, at
V = 0, between the negative-going and the positive-going branches at 312 K. This amount to 3.8% of the current
span from −100 to +100 V. Otherwise, the I-V curves are
essentially linear. At higher bias, sweeping from −100 to
+1100 V, the I-V curves bend slightly upwards, conforming to a space-charge limited current model, (I ~Vn), with
n = 1.13 over the 100 to 1100 V range. The resistance
of 3.29 x 10¹⁰Ω , in the ± 100 V range, corresponds to a
resistivity of 1.0 x 10¹¹ Ω cm. Temperature variations over a
narrow range (ambient to 313 K) indicates a semiconductor-like temperature dependence of the resistivity.
The impedance (R + jX)-frequency measurements,
where j = (-1)1/2 (Figure 4), display approximately one half
of a semicircle in the Nyquist plot. Data scatter, due to high impedance, restricts the measurements to frequencies above 1 Hz. These data have been analyzed using the equivalent circuit program, by B. Boukamp (version 2.0), assuming the parallel combination of a resistor (R), a constant phase element (CPE, of impedance (Yo(jω)n )−1, where ω is the angular frequency), and a carrier diffusion process with permeable boundaries18 (of impedance tanh(B(jω)1/2)
(Yo’ (jω)1/2)−1. Assuming permeable boundaries, with Pt
electrodes, implies assuming electronic conduction as the dominant charge transport process.
The it achieves a χ2 quality of 1.9 x 10⁻³, with values of
R = 2.3 x 10¹⁰ (± 20%) Ω, Y
o = 2.12 x 10⁻¹² (± 4%) pFsn−1,
n = 0.976 (± 0.3%), Yo’ = 2.8 x 10⁻¹¹(± 4%) Ω−1, and B = 0.6 (± 87%) s1/2. The value of R, together with the parameters
of the CPE, and an estimate of the frequency at which the
maximum of (−X) would occur, lead to a value of 8 for
the effective relative dielectric permittivity,19 suggesting
that the charge transport belongs to the interior of the
material grains. This is supported too by the value of n,
so close to 1, indicating that the charge transport is rather homogeneous, i.e., there is not a complex network of
carrier paths, as would be the case for intergrain transport. Whithin this interpretation, the value of R corresponds to
a bulk resistivity of 1.0 x 10¹¹Ω cm, and it accounts for
approximately two thirds of the dc resistance (3.3 x 10¹⁰Ω). The remaining resistance is due, most likely, to the transport at intergrain boundaries. This expectation comes from the loose arrangement of grains in the pellets, which were not sintered after pressing, since that process would degrade the material. The resulting scant grain-to-grain contact should lead to high intergrain impedance. Finally, the parameters
of the diffusion model depend20 on the diffusion length,
the diffusion coeficient, and on the response of the carrier concentration upon the oscillating electrodes potential. These factors are fully beyond the scope of current work, so, the parameters B and Y
o’ have not been related to physical properties of the material.
The band gap analysis, using UV-Vis diffuse relectance spectroscopy, indicates that K2SmP2S7 has an energy band gap of 2.59 eV.17 These values are expected for yellow
compounds. For comparison, the corresponding band gaps of NaSmP2S6 is 2.54 eV.10
Figure 5 shows the thermal dependence of the product [susceptibility*temperature]. The temperature-independent contribution to the magnetic susceptibility, as deduced from the slope of the χ*T versus T plot, is due to the admixture
between the 6H
5/2 and the 6H7/2 multiplets of the Sm3+ ion
Figure 3. DTA/TGA proiles of K2SmP2S7.
and it is known as the Van Vleck susceptibility, χVV.20,21 A
value for χVV of 2.98 x 10⁻³ emu mol−1 was estimated in the
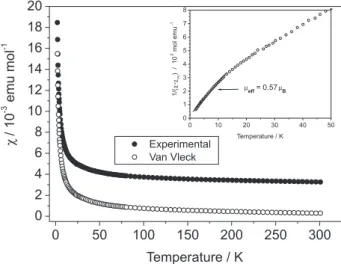
high-temperature linear region (150-300 K) in Figure 5. The Figure 6 shows the experimental magnetic susceptibility (black dots) and the one obtained after subtraction of the
temperature-independent paramagnetic Van Vleck χVV term
(open symbols).
Assuming that at low temperature the 6H
5/2 level is
situated far from the higher energy states, an estimation of the effective magnetic moment can be done at the lowest available temperature range. For this, we have plotted in the insert of Figure 6 the inverse magnetic susceptibility of the corrected data. These data extrapolate to T = 0, which means that no magnetic interactions can be expected between Sm spins. The low temperature slope can be considered then as a good approximation to the effective magnetic moment. In our case, we have taken the data in the range between 2 and 15 K (insert, Figure 6) and calculated a magnetic
moment of 0.57 μB which corresponds quite reasonably to
the expected moment for non correlated Sm3+ spins (μtheo
= = 0.85 μB; g = 2/7). This result excludes the
possibility of a divalent oxidation state for samarium which will give a null moment (Sm2+; 7F
0 state, g = J = 0, μeff = 0).
We conirm then that samarium is at its +III oxidation state, with a large Van Vleck contribution due to the admixture of the fundamental state with higher energy levels.
Conclusions
In summary, we have prepared quaternary alkali rare earth thiophosphate phase K4Sm2[PS4]2[P2S6]by ceramic method. The thermal stability was veriied and no phase transition was observed. The current-voltage characteristics and their temperature dependence over a narrow temperature range indicate semiconductor temperature activation of the conductivity. The electrochemical impedance
measurements indicate that the bulk (interior) of the
compound grains present a resistivity of 1.0 x 10¹¹ Ω cm,
and effective relative dielectric permittivity of 8, suggesting a dependence on bulk, intragrain charge transport. Magnetic measurement indicated that samarium is at its +III oxidation
state, with an evident admixture of the fundamental 6H
5/2
state with higher energy levels.
Acknowledgements
This work was supported by FONDECYT through operating grant Nº1061116.
References
1. Moller, H. J.; Semiconductor for Solar Cell; Artech House: Boston, 1993.
2. Borkowski, K.; Pyzyluski, J.; Mater. Res. Bull. 1987, 22, 381. 3. Bridenbaugh, P. M.; Mater. Res. Bull. 1973, 8, 1055. 4. Carpentier, C. D.; Nitsche, R.; Mater. Res. Bull. 1974, 9, 1097. 5. Arnautova, E.; Sviridov, E.; Rogach, E.; Savchenko, E;. Grekov,
A.; Integr. Ferroelectr. 1992, 1, 147.
6. Aitken, J. A.; Kanatzidis, M. G.; J. Am. Chem. Soc.2004, 126, 11780.
7. Komm, T.; Strobel, S.; Schleid, T.; J. Alloys Compd. 2006, 418, 106.
8. Komm, T.; Strobel, S.; Schleid, T.; J. Alloys Compd.2008,451, 648.
9. Gauthier, G.; Jobic, S.; Brec, R.; Rouxel, J.; Inorg. Chem. 1998,
37, 2332.
10. Goh, E-Y.; Kim, E-J.; Kim, S-J.; J. Solid State Chem.2001, 160, 195.
Figure 5. χ*Tversus T diagram: Van Vleck term (χVV ) was estimated in the high temperature range (150 ≤ T ≤ 300 K).
11. Schleid, T.; Hartenbach, I.; Komm, T.; Z. Anorg. Allg. Chem.
2002, 628, 7.
12. Komm, T.; Schleid, T.; Z. Anorg. Allg. Chem. 2006, 632, 42. 13. Komm, T.; Schleid, T.; Z. Krystallogr. 2005, 22, 162. 14. Manríquez, V.; Galdámez, A.; Ruiz-León, D.; Garland, M.T.;
Z. Kristallogr.-New Cryst. Struct. 2003, 218, 403.
15. Manríquez, V.; Galdámez, A.; Ruiz-León, D.; Garland, M.T.; Jiménez, M.; Z. Kristallogr.-New Cryst. Struct. 2003, 218, 1. 16. Manríquez, V.; Galdámez, A.; Ruiz-León, D.; Mater. Res. Bull.
2006, 41, 1337.
17. Manríquez, V.; Galdámez, A.; Guzmán, D.; Mater. Res. Bull.
2008, 43, 2469.
18. Barsoukov E.; Macdonald, J. R.; Impedance Spectroscopy, Theory, Experiment and Applications, 2nd ed., Wiley: New York,
2005.
19. Hsu, C. S.; Mansfeld, F.; Corrosion2001, 57, 747.
20. Van Vleck, H.; The Theory of Electric and Magnetic Susceptibilities, Oxford University Press: London, 1965. 21. Herpin, A.; Théorie du Magnétism, Presses Universitaires de
France: Paris, 1968.
Received: September 25, 2008
![Figure 5 shows the thermal dependence of the product [susceptibility*temperature]. The temperature-independent contribution to the magnetic susceptibility, as deduced from the slope of the χ*T versus T plot, is due to the admixture between the 6 H 5/2](https://thumb-eu.123doks.com/thumbv2/123dok_br/18993164.461361/3.892.547.759.107.325/dependence-susceptibility-temperature-temperature-independent-contribution-susceptibility-admixture.webp)