J. Serb. Chem. Soc. 76 (1) 113–123 (2011) UDC547.262+577.15+541.135.5–039.26:66.087
JSCS–4104 Original scientific paper
Sensitive determination of dihydronicotinamide adenine
dinucleotide and ethanol with a nano-porous carbon electrode
XIAOQIN LIU, BUHAI LI and CHUNYA LI*
Key Laboratory of Analytical Chemistry of the State Ethnic Affairs Commission, College of Chemistry and Materials Science, South-Central University
for Nationalities, Wuhan 430074, China (Received 27 January, revised 6 July 2010)
Abstract: A nano-porous carbon electrode, fabricated in 0.1 mol L-1 NaOH by
the electrochemical technique, was used for the electrochemical detection of dihydronicotinamide adenine dinucleotide, NADH, with an overpotential de-crease of about 270 mV and a linear range from 1.0×10⁻⁶ to 1.0×10⁻⁴ mol L-1.
Amperometric sensing of ethanol cooperating with alcohol dehydrogenase and nicotinamide adenine dinucleotide was successfully demonstrated. A linear res-ponse in the range from 5.0×10⁻⁵ mol L-1 to 1.0×10⁻² mol L-1 was obtained,
with a detection limit of 1.0×10⁻⁵ mol L-1. The method was successfully
em-ployed to determine ethanol in beer with high precision.
Keywords: nano-porous carbon; NADH; ethanol; electrochemical process; am-perometry.
INTRODUCTION
The electrochemical oxidation of dihydronicotinamide adenine dinucleotide, NADH, to the enzymatically active NAD+ in aqueous solution has attracted considerable interest due to its significance as a cofactor for dehydrogenase enzymes and in the development of biosensors. NAD+ as a co-enzyme can ca-talyze the oxidation of various compounds of great interest in analytical che-mistry, such as alcohols, aldehydes and carbohydrates, in cooperation with en-zymes, including dehydrogenases and oxidoreductases, to generate NADH. There-fore, the electrochemical detection of NADH and a highly selective and sensitive NADH transducer is desired.1 However, the direct electrochemical oxidation of
NADH at a bare glassy carbon electrode requires a high overpotential. Although the reversible potential of the NADH/NAD+ couple is estimated to be –0.56 V
(versus SCE) in neutral pH, the direct oxidation of NADH at unmodified elec-trodes often occurs at a potential of about 1.0 V.2 The large overpotential always
results in interferences from the real samples. In addition, the electrode surface is often fouled by the adsorption of reaction intermediates that are generated during the oxidation of NADH.3 Hence, considerable effort has been made to modify
the electrode surface to decrease the overpotential for the oxidation of NADH and to minimize the surface passivation effects.
Many methods have been adopted to immobilize the mediator on the elec-trode surface to reduce the overpotential for NADH oxidation. Elecelec-trodes modi-fied with carbon nanotubes,4,5 CdS nanoparticles,6 nanostructured TiO2,7 boron-
-doped diamond8 and conducting polymer nanotubes9 have been developed for
the electrochemical detection of NADH. However, the stability of the mediator limits the reproducibility and the operational lifetime of these modified elec-trodes. Therefore, sensitively and selectively in the electrochemical detection of NADH are still challenging tasks.
Various kinds of activation methods, such as mechanical polishing,10 ultra-sonification,11 vacuum heating,12 laser irradiation and electrochemical
pretreat-ment13 have been developed to improve the electrochemical performance of
glas-sy carbon electrodes. Among these activation methods, electrochemical pretreat-ment is one of the most commonly used methods to improve the electrochemical responses to biological compounds, due to its good reproducibility and simple operation. The higher density of functional groups produced on the surface of glassy carbon electrodes by electrochemical activation have been characterized by various techniques, including X-ray photoelectron spectroscopy (XPS), scan-ning electron microscopy (SEM) and electrochemical impedance spectra (EIS).14
The results indicate that the existence of carboxyl groups on the electrode surface can accelerate electron transfer between the electrode surface and the solu-tion.15,16 These conclusions initiated this investigation on the electrochemical performance of an electrochemically-treated glassy carbon electrode in the deter-mination of NADH.
In this study, a glassy carbon electrode was treated in 0.1 mol L−1 NaOH by
electrochemical oxidization at 1.80 V for 3 min followed by reduction at –1.00 V for 1 min. This electrochemical process resulted in the formation of nano-porous cavities on the electrode surface. This nano-porous carbon electrode exhibited excellent electro-catalytic activity towards the oxidation of NADH at a low po-tential in phosphate buffer at pH 7.0. Furthermore, an electrochemical method for ethanol determination at the nano-porous carbon electrode in presence of alcohol dehydrogenase, ADH, and NAD+ using amperometry was developed.
EXPERIMENTAL Apparatus and reagents
-electrode system was used with a pretreated glassy carbon electrode, GCE (diameter 3 mm), as the working electrode, a Pt wire as the auxiliary electrode and a saturated calomel electrode (SCE) as the reference electrode (all potentials are expressed vs. SCE) . All experiments were realized at room temperature. AVG Multilab 2000F X-ray photoelectron spectroscope (Ther-mo Electron Corp., USA) and a JSM-6700F field emission scanning electron microscope (JEOL Ltd., Japan) were applied for surface analysis of the nano-porous carbon electrode. The electrochemical impedance spectra (EIS) measurements were performed in a 0.5 mol L-1
KCl solution containing 2.0 mmol L-1 K
4[Fe(CN)6]/K3[Fe(CN)6] at a measuring potential
of 0.19 V.
Nicotinamide adenine dinucleotide (NAD+), nicotinamide adenine dinucleotide reduced
form (NADH) and alcohol dehydrogenase ADH (EC 1.1.1.1) from baker’s yeast in the form of a lyophilized powder were obtained from Sigma. All other chemicals were of analytical grade and all of the solutions were prepared with ultrapure water obtained from a molecular water purification system.
Preparation of the nano-porous carbon electrode
A glassy carbon electrode was polished with fine emery paper and alumina slurries fol-lowed by rinsing thoroughly with distilled water. The electrodes were successively sonicated in nitric acid, ethanol, and distilled water, and then allowed to dry at room temperature. A freshly polished electrode was electrochemically treated in 0.1 mol L-1 NaOH at 1.80 V for 3
min, and then reduced at –1.0 V for 1 min, whereby a nano-porous carbon electrode was ob-tained. After successive cyclic voltammetric scanning for 20 cycles in phosphate buffer solu-tion in the potential range from 0.0 to 0.80 V, the nano-porous carbon electrode was taken out and washed thoroughly with ultrapure water. The same procedure was employed for the elec-trochemical treatment of a glassy carbon electrode in acid, only 0.1 mol L-1 H
2SO4 solution
was used instead of NaOH solution. The density and diameter of the formed nano-porous ca-vities could be modulated easily by the adjustment of the potential and the time of electroche-mical treatment.
Electrochemical measurements
NADH detection was performed under stirring using amperometric batch analysis in an electrochemical cell containing 10 mL of 1/15 mol L-1 phosphate buffer solution (PBS) at pH
7.0 with an applied potential of 350 mV. The nano-porous carbon electrode was dipped in the buffer solution, then, after a stable background current was observed, NADH was successi-vely added and a fast current response was obtained.
RESULTS AND DISCUSSION
Characterization of the nano-porous carbon electrode
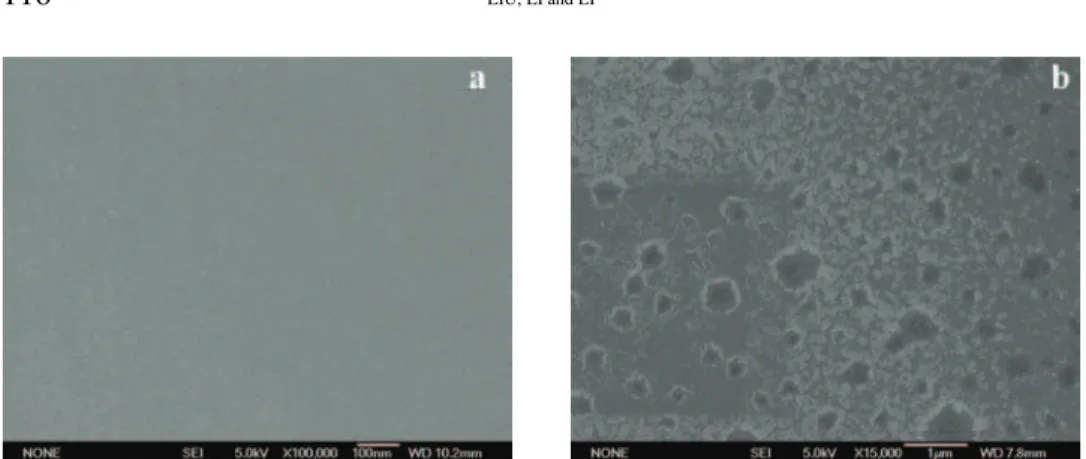
Scanning electron microscopy was used to characterize the morphology of the obtained nano-porous carbon electrode surface. The SEM images of the glassy carbon electrode before (a) and after (b) electrochemical treatment in 0.1 mol L−1 NaOH are presented in Fig. 1. A slide surface was observed for the
Fig. 1. Morphology of the glassy carbon electrode a) before and b) after electrochemical treatment in 0.1 mol L-1 NaOH solution.
It was found that electrodes that had been freshly polished with emery paper and alumina showed relatively poor activity toward the oxidation of NADH, compared to electrodes that had been electrochemically pretreated. It was sug-gested that pretreatment introduces or alters the nature of functional groups on the electrode surface and that such groups might serve as mediators of electrons between the electrode and the electroactive species. After electrochemical oxi-dation, phenolic, quinoidal, and carboxyl functional group were generated on the electrode surface. According to an early report,14 carboxyl groups on the surface of a GCE treated by an electrochemical process can mediate charge transfer reac-tions. Thus, in the present, XPS was used to determine the carbon and oxygen content of the electrochemically treated electrode surface, and the results are shown in Fig. 2, from which it was found that the oxygen-to-carbon (O/C) ratios
of the surface of the bare GCE and the nano-porous carbon electrode were 0.27 and 0.46, respectively. The increase in the O/C ratio indicated that the electro-chemical process could increase the number of oxygen-containing functional groups on the GCE surface, especially those groups which were negatively charged, which would experience an electrostatic repulsion towards NADH, which is negatively charged in PBS at pH 7.0.
Electrochemical impedance spectroscopy (EIS) is a powerful tool for study-ing the interface properties of nano-porous carbon electrodes and can provide information on the impedance changes between the interface between the elec-trode surface and electrolyte solution. Nyquist plots are presented in Fig. 3 for the bare GCE (a) and the nano-porous carbon electrode (b) in 0.5 mol L–1 KCl
solution containing 2.0 mmol L–1 K4[Fe(CN)6] /K3[Fe(CN)6] using an amplitude
of 0.005 V and a frequency range of 1 mHz–100 kHz. The Randles circuit (inset of Fig. 3) was chosen to fit the obtained impedance data. The resistance to charge transfer (Rct) and the diffusion impedance (W) were both in parallel to the
inter-facial capacitance (Cdl). The diameter of the semicircle corresponded to the in-terfacial electron-transfer resistance (Rct). By fitting the data, Rct was estimated
to be 1081 Ω at the bare GCE, the Rct decreased to 103.8 Ω at the nano-porous carbon electrode. This result demonstrates that the nano-porous surface of the carbon electrode could function as an efficient electron conducting tunnel bet-ween the electrode surface and electrolyte solution due to the enormous numbers of nano-cavities and electroactive sites.
Fig. 3. Nyquist plots for the bare GCE (a) and nano-porous (b) carbon electrode in the presence of 2.0 mmol L-1 K
4[Fe(CN)6]/K3[Fe(CN)6] in 0.5 mol L-1 KCl solution.
Electrochemical behavior of NADH
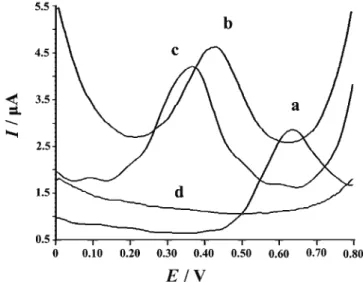
Considering the higher surface density of functional groups on the nano-po-rous carbon electrode, the electrochemical oxidation of NADH could be reason-ably catalyzed.15,16 Accordingly, the electrochemical behavior of 1.0 mmol L−1
NADH at the nano-porous carbon electrode was investigated in 1/15 mol L−1 PBS (pH 7.0) by differential pulse voltammetry (DPV). The obtained voltammo-grams are shown in Fig. 4. When the GCE was electrochemically treated in dif-ferent supporting electrolyte solutions, the change in the structure of the electrode surface was different, which resulted in different decreases in the overpotential for electrochemical oxidation. For the bare GCE, the recorded difference pulse voltammogram shows an oxidation peak at 0.62 V (curve a). After electroche-mical treatment in 0.1 mol L−1 H
2SO4 solution (curve b), the oxidation peak was
negatively shifted to 0.42 V. However, after electrochemical treatment in 0.1 mol L−1 NaOH solution, the oxidation peak appeared at 0.35 V (curve c). No peak at
0.35V was observed at the nano-porous carbon electrode in the absence of NADH (curve d). Therefore, the oxidation peak at 0.35 V can be assigned to the catalytic oxidation of NADH by functional groups on the nano-porous carbon electrode. It can be seen that the response of the carbon electrodes to NADH de-pended on the nature of the pretreatment. The main difference in the electroche-mical pretreatment process was the composition of the electrolyte solution, which includes both the pH of the solution and the nature and concentration of the electrolyte ions besides H+. Thus, it can be concluded that the functional groups
obtained on the electrode surface by pretreatment in a 0.1 mol L−1 NaOH solu-tion were different from that in 0.1 mol L−1 H
2SO4 solution. It can also be seen
from Fig. 4 that the oxidation overpotential of NADH was decreased by 270 mV and the oxidation peak current was improved significantly after the glass carbon electrode had been electrochemically treated.
Chronocoulometry is useful for measuring electrode surface areas, diffusion coefficients, the time window of an electrochemical cell, adsorption of electro-active species, and the mechanisms and rate constants for chemical reactions coupled to electron transfer reactions. The chronocoulometry for the bare GCE and the nano-porous carbon electrode in 0.5 mmol L–1 K
3[Fe(CN)6] solution
containing 0.1 mol L–1 KCl were investigated with a potential step from 0.0 to
0.40 V, a pulse width of 0.25 s and sample interval of 0.00025 s. The results showed that the effective surface areas of the nano-porous carbon electrode and the bare GCE were 0.023 cm2 and 0.018 cm2, respectively. The increase in the
effective surface area of electrode should be partly responsible for the current increase in the oxidation of NADH,17 but the large number of functional groups
electroche-mical activity of the electrode, which facilitates electron transfer between the electrode surface and the NADH solution.
Fig. 4. Differential pulse voltammograms of 1.0 mmol L-1 NADH at a) the bare GCG, the
nano-porous carbon electrode obtained in b) 0.1 mol L-1 H
2SO4 solution and c) 0.1 mol L-1
NaOH solution, and d) the nano-porous carbon electrode obtained in 0.1 mol L-1 NaOH
solution in the absence of NADH.
NADH determination
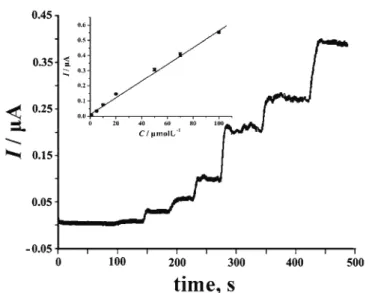
and decrease the polymeric products of the one-electron oxidation intermedia-tes.18 Figure 5 shows the amperometric response of the nano-porous carbon elec-trode to successive additions of different concentrations of NADH into a stirred buffer solution. After each injection of NADH, the current response (I) increased immediately and reached a steady state quickly. It exhibited a linear range from 1.0×10⁻⁶ to 1.0×10⁻⁴ mol L−1 according to the equation:
I (μA) = 0.00591c (μmol L−1) + 0.00271, r = 0.993 (1) where c is the NADH concentration.
Fig. 5. Amperometric response of NADH at various concentrations in the range from 1.0×10⁻⁶
mol L-1 to 1.0×10⁻⁴ mol L-1 in phosphate buffer solution (pH 7.0) at the nano-porous carbon
electrode. The inset is the calibration curve for NADH determination.
It is also important to emphasize that an NADH concentration as low as 1.0×10⁻⁶ mol L−1 was detected with high accuracy, indicating that the nano-porous carbon electrode could be used as a sensitive sensor for NADH.
Application to ethanol determination
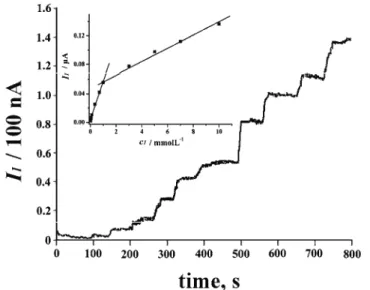
Electrochemical sensing of ethanol was performed in a phosphate buffer solution using the nano-porous carbon electrode in the presence of ADH and NAD+. The enzymes, together with their principal cofactor NAD+, were initially used free in solution at their optimum pH. The reaction that occurs in the solution was consistent with an earlier report,19 and can be described as follows:
measured as described above. The amperometric response of the nano-porous carbon electrode towards different concentrations of ethanol is shown in Fig. 6. The insert curves are the calibration curves for ethanol determination. It was found that amperometric current (I) was linearly related to ethanol concentration (c) in the concentration range from 1.0×10⁻⁵ mol L–1 to 1.0×10⁻³ mol L–1 and
1.0×10⁻³ mol L–1 to 1.0×10⁻² mol L–1 according to the equations:
I1 (nA) = 56.510c1 (mmol L−1) + 3.580, r = 0.995 (3)
and
I2 (nA) = 8.941c2 (mmol L−1) + 49.26, r = 0.996 (4)
At higher concentrations, the slope of the curve decreases, most likely be-cause of control by the enzymatic reaction. A similar behavior was reported previously.8
Fig. 6. Amperometric response of ethanol at various concentrations in the range from 1.0×10⁻⁵
mol L-1 to 1.0×10⁻² mol L-1 in phosphate buffer solution containing 1 mg mL-1 ADH and
3.0 mmol L-1 NAD+ at the nano-porous carbon electrode. The inset shows
the calibration curves for ethanol determination.
CONCLUSIONS
In this present work, a nano-porous carbon electrode was fabricated by elec-trochemically treatment in NaOH solution with oxidation at 1.80 V following by reduction at –1.00 V. The electrochemical performances of the obtained nano- -porous carbon electrode towards NADH were investigated thoroughly by vol-tammetry and amperometry. The overpotential for the oxidation of NADH was decreased substantially and the current response was improved significantly. In cooperation with NAD+ and ADH, the nano-porous carbon electrode was
suc-cessfully utilized for ethanol determination, which indicates that the obtained electrode can potentially be applied in the analysis of ethanol in real samples.
Acknowledgements. The authors gratefully acknowledge the financial supports from the Natural Science Foundation of Hubei Province (No. 2007ABA127), the State Ethnic Affairs Commission (No. 07ZN06) and the Nature Science Foundation of South-Central University for Nationalities (XTZ09005) and the special fund for Basic Scientific Research of Central Colleges, South-Central University for Nationalities (No. ZZZ10002).
A А Ђ А А NADH А А
А
-XIAOQIN LIU, BUHAI LI CHUNYA LI
Key Laboratory of Analytical Chemistry of the State Ethnic Affairs Commission, College of Chemistry and Materials Science, South-Central University for Nationalities, Wuhan 430074, China
-
0,1 mol L-1 NaOH, NADH
270 mV 1,0×10⁻⁶ 1,0×10⁻⁴ mol L-1. ђ
ђ
. 5,0×10⁻⁵
1,0×10⁻² mol L-1. ђ
.
( 27. , 6. 2010)
REFERENCES
1. C. R. Raj, S. Behera, Biosens. Bioelectron. 21 (2005) 949
2. A. Barzegar, A. A. Moosavi-Movahedi, M. R. Ganjali, J. Appl. Electrochem.39 (2009) 1111
3. P. C. Pandey, S. Upadhyay, B. C. Upadhyay, H. C. Pathak, Anal. Biochem.260 (1998) 195 4. X. H. Kang, Z. B. Mai, X. Y. Zou, P. X. Cai, J. Y. Mo, Anal. Biochem.369 (2007) 71 5. H. N. Choi, Y. K. Lyu, J. H. Han, W. Y. Lee, Electroanal.19 (2007) 1524
6. W. Vastarella, R. Nicastri, Talanta66 (2005) 627
7. A. Curulli, E. Valentini, G. Padeletti, M. Viticoli, D. Caschera, G. Palleschi, Sens. Actua-tors B111–112 (2005) 441
10. G. N. Kamau, W. S. Willis, J. F. Rusling, Anal. Chem.57 (1985) 545 11. H. H. Zhang Jr., L. A. Coury, Anal. Chem.65 (1993) 1552
12. D. T. Fagan, I. F. Hu, T. Kuwana, Anal. Chem.57 (1985) 2759
13. R. J. Bowling, R. T. Packard, R. L. McCreery, J. Am. Chem. Soc. 111 (1989) 1217 14. Q. L. Zhao, Z. L. Zhang, L. Bao, D. W. Pang, Electrochem. Commun.10 (2008) 181 15. R. C. Engstrom, Anal. Chem. 54 (1982) 2310
16. N. Cenas, J. Rozgaite, A. Pocius, J. Kulys, J. Electroanal. Chem. 154 (1983) 121 17. L. J. Kepley, J. A. Bard, Anal. Chem. 60 (1988) 1459
![Fig. 3. Nyquist plots for the bare GCE (a) and nano-porous (b) carbon electrode in the presence of 2.0 mmol L -1 K 4 [Fe(CN) 6 ]/K 3 [Fe(CN) 6 ] in 0.5 mol L -1 KCl solution](https://thumb-eu.123doks.com/thumbv2/123dok_br/18117797.323814/5.892.262.630.699.985/nyquist-plots-porous-carbon-electrode-presence-kcl-solution.webp)