Article
J. Braz. Chem. Soc., Vol. 26, No. 12, 2629-2639, 2015. Printed in Brazil - ©2015 Sociedade Brasileira de Química 0103 - 5053 $6.00+0.00
*e-mail: [email protected]
Low Temperature Synthesis of Luminescent RE
2O
3:Eu
3+
Nanomaterials Using
Trimellitic Acid Precursors
Ivan G. N. Silva,a Danilo Mustafa,b Maria C. F. C. Felinto,c Wagner M. Faustino,d
Ercules E. S. Teotonio,d Oscar L. Maltae and Hermi F. Brito*,a
aDepartamento de Química Fundamental, Instituto de Química da Universidade de São Paulo,
Av. Prof. Lineu Prestes 748, 05508-900 São Paulo-SP, Brazil
bDepartamento de Física dos Materiais e Mecânica, Instituto de Física da Universidade de São
Paulo, Rua do Matão Travessa R 187, 05508-090 São Paulo-SP, Brazil
cCentro de Química do Meio Ambiente, Instituto de Pesquisas Energéticas e Nucleares,
Av. Prof. Lineu Prestes 2242, SP, 05508-000 São Paulo-SP, Brazil
dDepartamento de Química, Universidade Federal da Paraíba, 58051-900 João Pessoa-PB, Brazil
eDepartamento de Química Fundamental, Universidade Federal de Pernambuco,
Av. Prof. Moraes Rego, 1235, 50670-90 Recife-PE, Brazil
[RE(TLA)·(H2O)n:Eu3+] (RE3+: Y, Gd and Lu; TLA: trimellitic acid) precursor complexes were synthesized by an one step aqueous co-precipitation method. After annealing for 1 h, RE2O3:Eu3+ nanophosphors were formed through the benzenetricarboxylate low temperature thermolysis method (500-1000 °C). The compounds were characterized by using different techniques [elemental analysis (CHN), Fourier transform infrared spectroscopy (FTIR), thermogravimetry (TG/DTG), X-ray powder diffraction (XPD) and scanning electron microscope (SEM)]. The XPD data indicated that the Y2O3:Eu3+ materials have crystallite size range from 11 to 62 nm. The SEM and transmission electron microscopy (TEM) images show that the annealed materials keep morphological similarities with the precursor complexes. The photoluminescence properties were studied based on the excitation and emission spectra, and luminescence decay lifetimes of the 5D
0 emitting level of the Eu3+ ion. The experimental intensity parameters (Ωλ), lifetimes (τ), as
well as radiative (Arad) and non-radiative (Anrad) decay rates were calculated and discussed. The RE2O3:Eu3+ phosphors (RE: Y3+ and Lu3+) annealed at 500 to 1000 °C have emission quantum efficiency (intrinsic quantum yield) values from 60 to 82%, indicating that this material can be potentially used for optical markers applications.
Keywords: low temperature method, benzenetricarboxylate precursors, rare earth sesquioxides,
photoluminescence materials
Introduction
Polycarboxylate ligands have a wide variety of structure providing large range of chemical properties when combined with metal ions. It has been drawing the attention in the areas such as metal framework systems (MOF),1,2 selective markers for medical applications,3
magnetic materials,4 gas storage,5 drug delivery,6 precursors
for materials,7 etc.
Rare earth (RE) containing materials show a versatility for application in the areas of science and technology specially in catalysis, permanent magnets in hybrid cars batteries,8,9 electroluminescent materials, persistent
phosphors, structural probes, luminescent markers, display panels, etc.10-15 Most of those applications are consequence
of their intrinsic characteristic: sharp intraconfigurational 4fN transitions, archiving high monochromatic emission
colors and a wide range of emissions, from infrared to ultraviolet,16 e.g., Nd3+, Eu3+, Gd3+, Tb3+ and Tm3+ ions
One very important feature of the RE3+ is their 4f-4f
transitions, forbidden by the Laporte’s rule. Associated to that, the shielding from the chemical environment by the filled 5s and 5p sub-shells17 over the 4f electrons
lead to a characteristic sharp lines spectra with small absorptivity and emission intensities. Taking into account the RE3+ intraconfigurational transitions, these ions can be
divided in four groups depending on their spectroscopic features:
(i) Sc3+(3d0), Y3+(4d0), La3+ (4f0) and Lu3+(4f14) where the
4f electrons are non-optically active due to their completely empty or fully occupied subshells;16
(ii) Gd3+(4f7) is a singular case due to its half-filled
4f layer, and therefore very stable. The energy difference between the lower emitting level (6P
7/2) and the fundamental
level (8S
7/2) is approximately 32000 cm−1 opening the
opportunity for its application as inorganic matrices. Due to the chemical similarity with other RE3+ ions, it is
extensively used to study the emission of the ligands in coordination complexes;
(iii) Sm3+(4f5), Eu3+(4f6), Tb3+ (4f8) and Dy3+(4f9): in
these ions, the energy gap between the emitting and the lower levels are large enough to reduce the non-radiative decay process and accept energy from the ligands, interconfigurational transitions or charge transfer bands excited levels (Figure 1);
(iv) Ce3+(4f1), Pr3+(4f2), Nd3+ (4f3), Ho3+(4f10), Er3+(4f11),
Tm3+(4f12) and Yb3+ (4f13): in these ions the energy gap
between the emitting and lower levels are small, increasing the non-radiative decay process usually mediated by high energy vibrational modes in ligands (typically water molecules) or matrices (oxycarbonates, hydroxides, etc.).
In these cases, the process accounts for the decreasing in the final emission efficiency.
To overcome the small absorptivity coefficients, luminescence sensitizers can be used to absorb and transfer the energy efficiently to the RE ions, keeping their desirable atomic characteristics. This phenomenon is a key feature in design of luminescent materials.16,18,19
In inorganic matrices such as vanadates, molybdates, tungstates and sesquioxides containing RE3+ ion, generally
is observed an efficient energy transfer from the ligand metal charge transfer (LMCT) band to the metal ions. In the special case, the Eu3+ ion shows a high absorption intensity
arising from the allowed LMCT transition, yielding a high intensity luminescence.20
In solid state reactions, typically, is necessary high temperatures and long reaction time periods to prepare luminescent materials. This way to synthesize materials is known as ceramic method, which promotes heterogeneous distribution of the activator ion within the matrix and generate materials with high crystallite and particle sizes. Alternative methods to obtain materials in milder reaction conditions as: sol-gel, combustion or Pechini methods,21,22
are key to overcome the experimental limitation and improve their properties.
This report demonstrate the synthesis, characterization and optical properties of [RE(TLA):Eu3+ (x mol%)]
complexes (RE3+: Y, Gd and Lu; x: 0.1, 0.5, 1.0, and
5.0 mol%) and their low temperature annealing into the high luminescent RE2O3:Eu3+ phosphors. All the precursor
complexes and resulting nanophosphors were characterized by elemental analysis (CHN), Fourier transform infrared (FTIR), thermogravimetry (TG), derivative thermogravimetry (DTG), X-ray powder diffraction (XPD) and scanning electron microscopy (SEM). The photoluminescence properties of the doped materials were studied based on the excitation and emission spectra and luminescence decay curves of the Eu3+ ion 5D
0 excited level.
Experimental
High purity RE2O3 (RE3+: Y, Eu, Gd and Lu; CSTARM,
99.99%, China) were used to prepare the respective RECl3.
(H2O)6 salts by reaction with concentrated HCl solution
until total decomposition (ca. 60-80 °C) of the solid and final pH close to 6. The trimellitic acid (TLA) (in the form of 1,2,4-benzenetricarboxylic acid 1,2-anhydride or 1,3-dihydro-1,3-dioxo-5-isobenzofurancarboxylic acid; Aldrich, 97%, Germany) was solubilized in water by drop-wise addition of 1 mol L−1 sodium hydroxide up to
pH close to 6.
For the preparation of the [RE(TLA):Eu3+] complexes,
50 mL of RECl3(aq) (0.05 mol L−1) was slowly added to a
200 mL solution of Na3(TLA)(aq) (0.0125 mol L−1) at 1:1
Figure 1. Partial energy diagram of trimellitic acid (TLA) ligand from [RE(TLA)·(H2O)n] (RE3+: Y, Gd and Lu) precursor (singlet and triplet states), Eu3+ ion and RE
molar ratio at ca. 100 °C. The reaction mixture was refluxed for 1 h, the precipitate was filtered and washed four times with distilled water, dried and stored at reduced pressure. The [RE(TLA):Eu3+] complexes obtained are
non-hygroscopic, white crystalline powders, stable in air. The RE2O3:Eu3+ nanophosphors were obtained by annealing
the [RE(TLA):Eu3+] complexes at 500, 600, 700, 800,
900 and 1000 °C in a static air atmosphere, resulting in RE2O3:Eu3+ nanophosphors.
Elemental analyses were performed with a Perkin-Elmer CHN 2400 analyzer. The FTIR were acquired from 400 to 4000 cm−1 in KBr pallets form by using a
Bomem MB100 FTIR. Thermogravimetry was performed from 30 to 900 °C (heating ramp of 5 °C min−1, synthetic
air dynamic atmosphere) in a TA HI-RES TGA 2850 equipment. The XPD patterns were obtained in a Miniflex Rigaku II equipment (CuKα1) from 5 to 70° (2θ). The SEM
micrographs were recorded in a JEOL JSM 7401F field emission scanning electron microscope. The transmission electron microscope (TEM) micrographs were recorded in a JEOL USA JEM-2100 LaB6 transmission electron
microscope.
The luminescence study was based on the excitation and emission spectra recorded at room (300 K) and liquid nitrogen (77 K) temperatures. The measurements were performed in a SPEX-Fluorolog 3 instrument with double monochromators in front face mode (22.5°) using a 450 W Xenon lamp as excitation source. Luminescence decay curves were obtained by using a 150 W pulsed lamp and recorded in a SPEX 1934D phosphorimeter.
Results and Discussion
Characterization
A combination of elemental and thermogravimetric analysis (Table S1 and Figure 2) suggests an 1:1 molar ratio between the RE3+ ion and TLA ligand
([RE(TLA)·(H2O)n:Eu3+]; n: 4, 4 and 3 for Y3+, Gd3+ and Lu3+,
respectively).23 The TG curves of coordination compounds
show a water molecules mass-loss in the temperature interval between 50 and 230 °C. Although the organic moiety decomposition of the complexes presents only one single-step between 450 and 570 °C. In this case, it was used annealing temperature of 500 °C during 1 h, in order to eliminate all the organic part leading to formation of the RE2O3:Eu3+ luminescent material.
The infrared absorption spectra (Figure S1) present similar spectral profile for the RE3+ complexes and Eu3+
-doped matrices. The absorption bands between 1300 and 1600 cm–1 in the FTIR spectra of [RE(TLA)·(H
2O)n:Eu3+]
are assigned to the carboxylate symmetric νs(C=O) and
asymmetric νas(C=O) stretching modes, respectively.19,24,25
The narrow absorption peak around 3070 cm–1 is assigned to
the C–H bond stretching of the [RE(TLA):Eu3+] complexes
and the broad band between 3100-3700 cm–1 correspond to
the O–H stretching from the water molecules.26
The sharp absorption bands around 510 and 580 cm−1
correspond to the characteristic RE3+−O stretching
vibration. It is worth mentioning that the broad bands from 1250 to 1600 cm−1 are assigned to stretching mode
of oxycarbonate remainder from the decomposition of the organic moistly of TLA and decreases with increasing annealing temperature (Figure S1), due to oxycarbonate decomposition.23 The broad absorption band located from
2800 to 3700 cm−1 is assigned to the superficial hydroxyl
groups in the nanomaterials. Therefore, the RE2O3:Eu3+
materials originated from the [RE(TLA)] precursor complexes present similar chemical behavior compared to the sesquioxides prepared from the [RE(TMA)] complexes as reported by Silva et al.23
The X-ray diffraction patterns of the [RE(TLA):Eu3+]
complexes are similar to the powder diffraction patterns (PDF) for [Gd(TLA)]:Eu3+ and [Y(TLA)]:Eu3+]
(00-056-1733) and [Lu(TLA)]:Eu3+] (00-058-1915), Y3+
and Gd3+ complexes are isomorphs. Consequently, there
is no change in position or formation of new diffraction
100 200 300 400 500 600 700
0 10 20 30 40 50 60 70 80 90 100
[RE(TLA):Eu3+]
Y Gd Lu
Synthetic ir, 5a °C min-1
-1
5 mg, 50 cm3min-1
DTG
RE2O3
TG
Temperature / C°
H2O
TLA M as s re m a in
ing / %
(a)
Synthetic ir, 5a °C min
5 mg, 50 cm3
min-1
Temperature / C°
100 200 300 400 500 600 700
0 10 20 30 40 50 60 70 80 90 100
[RE(TLA):Eu3+(5.0 mol%)]
Y Gd Lu DTG TG TLA
H2O
RE
2O3:Eu
3+ (b) Mas s remaini n g / %
Figure 2. TG and DTG curves (a) [RE(TLA)] and (b) [RE(TLA):Eu3+ (5.0 mol%)] (RE3+: Y, Gd and Lu).
100 200 300 400 500 600 700
0 10 20 30 40 50 60 70 80 90 100
[RE(TLA):Eu3+] Y Gd Lu
Synthetic ir, 5a °C min-1
-1
5 mg, 50 cm3min-1
DTG
RE2O3
TG
Temperature / C° H2O
TLA M as s re m a in
ing / %
(a)
Synthetic ir, 5a °C min 5 mg, 50 cm3
min-1
Temperature / C°
100 200 300 400 500 600 700
0 10 20 30 40 50 60 70 80 90 100
[RE(TLA):Eu3+(5.0 mol%)] Y Gd Lu DTG TG TLA H2O
RE 2O3:Eu
peaks at different concentrations of the dopants. This result is consistent with the Vegard’s rule27,28 which suggests a
formation of a solid solution between the Eu3+ dopant and
the RE3+ in the host matrices due to the high similarity in
the radii of these RE3+ ions.27
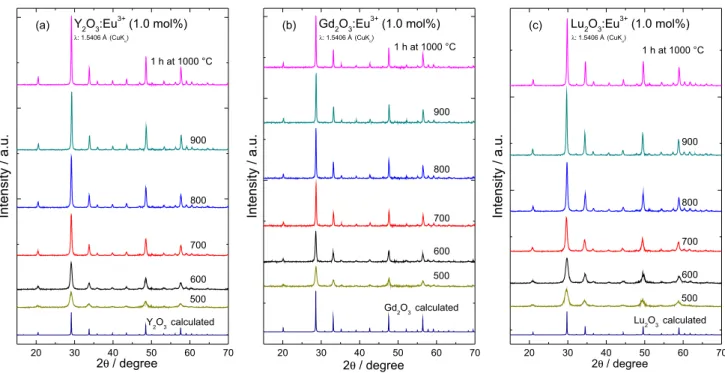
The XPD patterns of the annealed materials at 500, 600, 700, 800, 900 and 1000 °C (Figure 3) reveal a formation of RE2O3:Eu3+ in a cubic phase crystallization with the Ia
–
3 space group.29 The absence of 2θ shift and reflections of
impurities in the patterns of the RE2O3:Eu3+ indicates the
formation of pure RE3+ sesquioxides. The XPD data of the
Y2O3, Gd2O3 and Lu2O3 matrices (Figure 3) are very similar.
Slight differences in the (222) reflection around 28°, moving to higher 2θ values with decreasing of the ionic radius of the RE3+ in the matrix, as predicted by Bragg’s law.30
The average crystal size of the doped materials was estimated from the powder diffraction data by using the Scherrer’s formula (Figure 4).23,31 The crystallite size of the
RE2O3 materials increases as function of the RE3+ radius
and annealing temperature. This behavior can be assigned to the higher reactivity of the Gd2O3, with lower melting
point (2339 °C) compared to Y2O3 (2410 °C) and Lu2O3
(2427 °C).32 Therefore, the sintering process is favored for
the gadolinium matrix due to the dependence of the partial melting of the nanocrystals.23
The narrowing of the diffraction peaks of RE2O3:Eu3+
(1.0 mol%) (RE3+: Y, Gd and Lu) phosphors presented in
the XPD patterns (Figure 3) as function of the annealing temperature, indicates that the crystallite size increases from
11, 17, 18, 37, 46 and 62 nm as the annealing temperature increases from 500, 600, 700, 800, 900 and 1000 °C (Y2O3),
respectively (Figure 4). This behavior is related to the sintering of the nanocrystallites favored at high temperatures. Although the Gd2O3:Eu3+ annealed at 1000 °C was also
included in this work, the Scherrer’s formula is recommended only for crystallite sizes up to 200 nm (Figure 4).
The SEM images of the [RE(TLA):Eu3+ (1.0 mol%)]
precursors shows rods and a flower like morphologies (stacking of micrometric sheets of the material) for Y3+/Gd3+ (Figures 5a and 5b) and Lu3+ complexes, respectively
(Figure 5c). After annealing up to 1000 °C, the RE2O3:Eu3+
materials retained the original morphology of the correspond precursor complex (Figures 5d-5f). The nanosesquioxides
20 30 40 50 60 70
Intensity / a.u. Intensity / a.u. Intensity / a.u.
2θ/ degree
Y2O3calculated 500 600 700 800 900 1 h at 1000 °C Y2O3:Eu3+(1.0 mol%)
(a)
20 30 40 50 60 70
Gd2O3calculated 500 600 700 800 900 1 h at 1000 °C
2θ/ degree Gd2O3:Eu3+(1.0 mol%)
(b)
λ: 1.5406 Å (CuKα)
λ: 1.5406 Å (CuKα) λ: 1.5406 Å (CuKα)
20 30 40 50 60 70
2θ/ degree
Lu
2O3calculated
500 600 700 800 900 1 h at 1000 °C Lu2O3:Eu3+(1.0 mol%)
(c)
Figure 3. XPD patterns of (a) Y2O3:Eu3+; (b) Gd2O3:Eu3+ and (c) Lu2O3:Eu3+ (1.0 mol%) materials annealed for 1 h at different temperatures; reference pattern: PDF: 86-2477 and 86-2475, respectively.
500 600 700 800 900 1000
0 30 60 90 120 150 180 210 240
Annealed for 1 h
Y Gd Lu C ry s ta lli te s iz e / nm
Re2O3:Eu3+(1.0 mol%)
Annealing temperature / C°
Figure 4. Correlation between the sesquioxides crystallite size and annealing temperature for RE2O3:Eu3+ (1.0 mol%) materials.
20 30 40 50 60 70
Intensity / a.u. Intensity / a.u. Intensity / a.u.
2θ/ degree
Y2O3calculated 500 600 700 800 900 1 h at 1000 °C
Y2O3:Eu3+(1.0 mol%) (a)
20 30 40 50 60 70 Gd2O3calculated
500 600 700 800 900 1 h at 1000 °C
2θ/ degree Gd2O3:Eu3+(1.0 mol%) (b)
λ: 1.5406 Å (CuKα)
λ: 1.5406 Å (CuKα) λ: 1.5406 Å (CuKα)
20 30 40 50 60 70 2θ/ degree
Lu
2O3calculated 500 600 700 800 900 1 h at 1000 °C
Lu2O3:Eu3+(1.0 mol%) (c)
500 600 700 800 900 1000
0 30 60 90 120 150 180 210 240
Annealed for 1 h
Y Gd Lu C ry s ta lli te s iz e / nm
Re2O3:Eu3+(1.0 mol%)
exhibit higher porosity due to the decomposition of the organic moiety. This property is important for the design of nanomaterials with controlled morphology. Since it is possible to modify the complex morphologies, the desired nanoparticle shapes can be obtained by choosing the suitable synthetic method and reaction conditions.33,34
The TEM micrographs (Figures 5g and 5h) show the cubic shape of the crystallites with high crystallinity. The particles retained the shape of the precursor agglomerates, shown in the SEM microscopy. At higher magnification no defects were observed in the crystals (except for the edges and crystallite contact points), suggesting the formation of a solid solution between the Eu3+ ions and the host matrices,
compatible with the similar RE3+ ionic radii and chemical
behavior of the Eu3+ and RE3+ matrices.
Photophysical properties of materials
[RE(TLA):Eu3+] precursor complexes
The excitation spectra of [RE(TLA):Eu3+ (x mol%)]
(RE3+: Y, Gd and Lu) compounds were obtained by
monitoring the hypersensitive transition 5D
0 → 7F2
(619 nm) at 77 K (Figure 6). For all the complexes, the absorption bands are dominated by a high intensity broad TLA ligand band centered at 295 nm assigned to the S0→ S1 transition, indicating an efficient energy transfer
TLA → Eu3+. The sharp peaks are assigned to the absorption of the Eu3+ ion originated from the ground state 7F
0 to the 5L
6 and 5D2 excited levels. The excitation spectra of the
[RE(TLA):Eu3+ (x mol%)] (RE3+: Y and Gd) compounds
show similar profiles suggesting that this system presents equivalent chemical environments around RE3+ ions and
optical behaviors. On the other hand, [Lu(TLA):Eu3+
(x mol%)] shows slightly different spectral profile. For all [RE(TLA):Eu3+] systems, the 7F
0 → 5L6 transition
(25445 cm–1 for [Y(TLA):Eu3+ (5.0 mol%)]) exhibits the
highest intensity among the intraconfigurational transitions in the excitation spectra.
The emission spectra of the [RE(TLA):Eu3+ (x mol%)]
complexes (RE3+: Y, Gd and Lu), were recorded under
excitation in the TLA ligand band (ca. 295 nm) at 77 K, to reduce the vibronic coupling compared to the room temperature case. The emission energy levels of 5D
0→7FJ
transitions (J = 0-4) of the Eu3+ ion, can be attributed as the
following (in cm–1): 7F
0 (17270); 7F1 (16920); 7F2, (16210); 7F
3 (15337) and 7F4 (14350), based at the [Y(TLA):Eu3+
5.0 mol%)]. The efficient energy transference TLA → Eu3+ ion is evidenced by the absence of ligand broad emission band in the emission spectra in the spectral range from the 400 to 700 nm.
Using the optical data obtained from the emission spectra, it is possible to calculate the radiative rates (A0→J)
from the 5D
0→7FJ transitions using equation 1:16,17
0→1 0→J
0→1
0→J A
σ S
S σ A
0→J 0→1
= (1)
where σ0→1 and σ0→2,4 correspond to the energy barycenter of the 5D
0→7F1 and 5D0→7F2,4 transitions, respectively.
The S0→1 and S0→J are the areas calculated under the
emission of the spectral curve corresponding to the
5D
0 → 7F1 and 5D0 → 7FJ transitions, respectively.35
Since the magnetic dipole 5D
0→7F1 transition is almost
insensitive to changes with the chemical environment around the Eu3+ ion, the A
0→1 rate can be used as an
internal standard to determine the A0→J coefficients for
Eu3+ containing compounds.16
The lifetime (τ) of the luminescent compounds were obtained from the luminescence decay curve using a first order exponential decay, with excitation at the 7F
0→5L6
band. The emission quantum efficiency (η, or intrinsic Figure 5. SEM images of [RE(TLA):Eu3+ (1.0 mol%)] precursor
quantum yield, QLn
Ln, as it has been defined by Bünzli)36 of
the 5D
0 emitting level is determined according to equation 2:
Arad + Anrad
Arad
η= (2)
where the total decay rate, Atot = 1/τ = Arad + Anrad and the
Arad = ΣJ A0→J. The Arad and Anrad quantities are the radiative
and non-radiative rates, respectively. Table 1 shows the experimental values of the radiative (Arad), non-radiative
(Anrad) rates and 5D0 emitting level emission quantum
efficiency (η).
The [RE(TLA):Eu3+ (x mol%)] lifetime values (Table 1
and Figure 6c) show higher values for Gd3+ and Y3+
containing complexes when compared to the Lu3+ ion case.
On the other hand, there are no changes in the lifetime behavior doping with an increasing concentration from 0.1, 0.5, 1.0 and 5.0 mol%, within the same system.
The 5D
0→7F2 and 5D0→7F4 transitions can be used
to estimate the experimental intensity parameters (Ωλ, λ = 2 and 4). The Ω6 intensity parameter is not included in
this study since the 5D
0→7F6 transition was not observed
for these systems. The coefficient of spontaneous emission, A, is given by equation 3:
2 0 5 ( )λ J 7
λ λ
0→J χ Ω F U D
4e2ω3
A = ∑ (3)
where, χ = n (n + 2)2/9 is the Lorentz local field correction
and n is the refractive index of the medium (refractive index used: 1.5 for all [RE(TLA):Eu3+] complexes and between
1.5 and 1.6 for RE2O3:Eu3+ materials). The squared reduced
matrix elements 〈7F
J||U(λ)||5DJ〉2 are 0.0032 and 0.0023
calculated for J = 2 and 4, respectively.35,37
The Ωλ parameters depend mainly on the local geometry, bonding atoms and polarizabilities in the first coordination sphere of the RE3+ metal ion, and are governed by both
forced electric dipole (FED) and dynamic coupling (DC) mechanisms. Moura et al.38 reported that the Ω
2 parameter
values are very sensitive to small angular changes in the local coordination geometry (much more than the Ω4,6 parameters). This spectroscopic behavior is associated with the hypersensitivity of certain 4f-4f transitions, to changes in the chemical environment, that are usually ruled by the Ω2 intensity parameter. On the other hand, the Ω4 and Ω6 values are most sensitive the chemical bond distances to the ligating atoms around the lanthanide ion. Indeed, as concluded by Moura et al.,38 covalency in the ion-ligand
bonding becomes more important with the increasing rank of the Ωλ, supporting the idea that the Ω4 and Ω6 parameters
are better probes then Ω2 to quantify covalency in these compounds.
The Ωλ (λ = 2 and 4) parameter values for the [RE(TLA):Eu3+ (x mol%)] compounds (x = 0.1, 0.5, 1.0
and 5.0 mol%) are presented in Table 1. The Ω2 values (ca. 6 ×10–20 cm2) found for these doped complexes are
systematically larger than the [RE(TMA):Eu3+] (RE3+: Y
and Lu) anhydrous complexes (ca. 2 ×10–20 cm2) values
[RETMA] reported by Silva et al.39 reflecting the higher
hypersensitive character of the 5D
0→7F2 transition.23,40,41
The emission quantum efficiency values of the [RE(TLA):Eu3+ (x mol%)] are lower for the complexes
containing Y3+ and Gd3+ (η ca. 10%) and Lu3+ (η ca. 6%)
ions, which indicate a strong non-radiative decay pathway mediated by water molecules (Table 1). It is also observed that increasing the Eu3+ concentration from 0.1 to 5.0 mol%
produces no change in the emission quantum efficiency values, suggesting that the luminescence quenching concentration effect is not operative for these systems.
RE2O3:Eu3+ materials
The excitation spectra of RE2O3:Eu3+ annealed
phosphors (RE3+: Y, Gd and Lu) were recorded at 77 K in
the spectral range from 200 to 590 nm, with the emission monitored at 613 nm (Figure 7 and Figure S3). They show the presence of a broad absorption band centered around (ca. 39000 cm–1) assigned to the O2−(2p) → Eu3+(4f6)
LMCT transition. Besides, the narrow absorption bands arisen from 4f-4f transitions from the RE3+ ion (ca. 17000
to 34000 cm–1) are observed.
The excitation spectra recorded at 300 K (Figure S4) show the presence of the overlapped 7F
0→5D1 and 7F1→ 5D1
transitions (ca. 19000 cm–1) allowed by magnetic-dipole
mechanism (∆J = 0, ±1, but 0 ↔ 0 is forbidden) for both the C2 and S6 symmetries. This optical results are due to the
thermal population of the 7F
1 level that are in agreement
with the results previously reported for RE2O3:Eu3+.42,43
The absorption bands assigned to the 7F
0→5D2 transition
allowed by induced electric dipole and dynamic coupling mechanisms were observed from 21500 to 21900 cm–1.
In addition, a weak absorption band around 24100 cm–1
is assigned to the forbidden 7F
0 → 5D3 transition (by ∆J
selection rules) as a result of the relaxation of the selection rule due to the J-mixing effects in the 7F
J manifolds.
Moreover, the other absorption bands (Figure 7) originated from 4f-4f transitions of the Eu3+ ion were observed such
as (in nm): the 7F
0→5L6 (394), 5G2−6 (387), 5L7,8 (376), 5D4
(363), 5H
J’, 5FJ’, 5IJ’ and 3P0 (between 286 and 335).
It is worth mentioning that the excitation spectra of the Gd2O3:Eu3 present the characteristic strong
absorption (nm): 8S
7/2→6P7/2 (313), 8S7/2→6P5/2 (307) and 8S
7/2→6P3/2 (302) transitions, indicating efficient energy
transfer from the Gd3+ to the Eu3+ ion upper levels.44 The 8S
7/2 → 6IJ (J = 7/2,9/2,17/2) (276) transitions overlap
with the LMCT band. This high intensity absorption band indicates an efficient Gd3+ to Eu3+ energy transfer.45
The luminescent materials prepared by the benzene-tricarboxylate method present comparable excitation features, indicating the reproducibility of the method even when using different benzenetricarboxylate (BTC) ligands.23
The emission spectra of the RE2O3:Eu3+ (RE3+: Y, Gd
and Lu) annealed at temperatures from 500 to 1000 °C were recorded at 77 K from 400 to 750 nm, under excitation in the LMCT band at 260 nm (Figure 7). All Table 1. Experimental values of intensity parameters (Ωλ), radiative (Arad) and non-radiative (Anrad) rates, emission lifetimes and emission quantum efficiencies of the 5D
0 emitting level determined for the [RE(TLA):Eu3+ (x mol%)] (RE3+: Y, Gd and Lu) phosphors based on the emission spectra recorded at 77 K
[RE(TLA):Eu3+ /
(x mol%)] Ω2 / (10–20 cm2) Ω4 / (10–20 cm2) Arad / s−1 Anrad / s−1 Atot / s−1 τ / ms η / % Y3+
0.1 6.4 1.6 264 2492 2756 0.363 10
0.5 6.2 1.7 258 2642 2900 0.345 9
1.0 6.1 1.7 257 2475 2732 0.366 9
5.0 6.1 1.7 257 2948 3205 0.312 8
Gd3+
0.1 4.7 1.7 216 1936 2151 0.465 10
0.5 4.8 1.8 219 1862 2081 0.481 11
1.0 5.1 1.7 225 1928 2153 0.464 10
5.0 4.7 1.8 217 1870 2087 0.479 10
Lu3+
0.1 5.5 1.3 234 3587 3821 0.262 6
0.5 5.4 1.4 229 3693 3922 0.255 6
1.0 5.4 1.3 229 3641 3870 0.258 6
5.0 5.4 1.3 229 3792 4021 0.249 6
the spectra exhibit only the sharp lines arising from the
5D
0,1,2,3→7F0-6, transitions of the Eu3+ ion. All materials
show only one emission line assigned to 5D
0→7F0 transition
(ca. 17270 cm–1) of the C
2 site of the cubic C-type. The 5D
0→ 7F1 transition is present in both sites in the region
of 16666, 16846 and 17015 cm–1 as well at 16770 and
17165 cm–1 originating from the C
2 and S6 sites.42,43
As reported by Boyer et al.46 and Meltzer et al.,47 the
refractive index (n) of the bulk RE2O3:Eu3+ is around 1.9
and the 5D
0 lifetime (τ) of europium ion is 1.0 ms. On the
other hand, these values can be different in the case of the RE2O3 nanostructured materials, with average sizes around
20-30 nm (crystallite size inferior to the wavelength of exciting radiation). Moreover, the morphology and surface/ volume ratio of the nanoparticles may play a role in the profile of the decay curves.
The radiative rate (A01) of the 5D0→7F1 transition of Eu3+
ion (allowed by the magnetic dipole mechanism) is formally insensitive to the ligand field environment. Therefore it can be used as a reference transition whose value is 50 s–1
assuming a refractive index equal to 1.6.17,48,49 Based on
this value, the refractive indices were determined and compared to the lifetime and crystallite size values reported previously.46-48 The experimental intensity parameters (Ω
2,4)
and lifetimes (0.8-1.9 ms) values were obtained using the effective refractive index values between 1.5 and 1.6. The values of the experimental intensity parameters (Ω2,4) the radiative (Arad) and non-radiative (Anrad) rates and emission
quantum efficiencies (η) of the 5D
0 emitting level of the
RE2O3:Eu3+ are presented in Table 2.
The values for Ω2 (ca. 12) and Ω4 (ca. 2-3) are very similar in the same matrix (Table 2) for different annealing temperatures as shown in the spectral profiles (Figure 7b).50 These results are a reflection of the observed
emission intensity variations of the 5D
0→7F2 transition
of the Eu3+ ion. This optical behavior demonstrates that
the Eu3+ ion acts as efficient luminescence probe even
for the samples annealed at different temperatures. In addition, Ω2 and Ω4 values are also comparable changing the RE3+ matrix, due to the similarity in the radii in the
lanthanide series.
The experimental intensity parameter values for the phosphors using the TLA ligand as precursor are smaller for all the systems, as compared to those originated from the TMA ligand, especially for the of Gd3+ matrix.19
According to Table 2, the RE2O3:Eu3+ phosphors present
an emission quantum efficiency values varying from 37 to 82% with the annealing temperature of 500-1000 °C. Among the materials, the Lu2O3:Eu3+(1.0 mol%) with
annealing at 900 °C present the highest emission quantum efficiency (η = 82%). This phenomenon is probably associated to the removal of oxycarbonate from the matrices with increasing the annealing temperature. It is important to mention that the RE2O3:Eu3+ phosphors prepared by the
benzenetricarboxylate method using the TLA ligand is cheaper than compared with the TMA ligand.
The Commission Internationale de l’Eclairage (CIE) chromaticity coordinates generated from the emission spectra of Eu3+ doped RE
2O3 (Figure 8) are x: 0.650
and y: 0.335.49 The color coordinates show virtually no
200 300 400 500
500 600 700 800 900 1h anealing at 1000o
C
λ
em.: 613 nm, 77 K
5 D0 5H J 5F J 5 IJ 7 F0,1 2S+1 LJ LMCT 3 P0 5 D1 5 D3 5 D4 5 G26 5
L610 5
D2
(O
2-Eu3+
)
500 600 700
7
F2
Wavelength / nm Wavelength / nm
λ
exc.: 260 nm, 77 K
500 600 700 800 900 1h anealing
at 1000o
C
5
D1 5
D0 7F 0 7F 1 7F 3 7F 4
(a) Y2O3:Eu3+(1.0 mol%) (b) Y2O3:Eu3+(1.0 mol%)
No rm a liz e d i n te n s it y / a .u . N o rm a liz e d in ten s ity / a.u.
Figure 7. The (a) excitation spectra of Y2O3:Eu3+ (1.0 mol%), with emission monitored at 613 nm; (b) emission spectra, with excitation at 260 nm, recorded at 77 K.
200 300 400 500
500 600 700 800 900 1h anealing
at 1000o
C λ
em.: 613 nm, 77 K
5 D0 5H J 5F J 5 IJ 7 F0,1 2S+1 LJ LMCT 3 P0 5 D1 5 D3 5 D4 5 G26 5
L610 5
D2
(O 2-Eu3+
)
500 600 700
7
F2
Wavelength / nm Wavelength / nm
λ
exc.: 260 nm, 77 K
500 600 700 800 900 1h anealing
at 1000o
C
5 D1 5
D0 7F 0 7F 1 7F 3 7F 4
(a) Y2O3:Eu3+(1.0 mol%) (b) Y2O3:Eu3+(1.0 mol%)
change for different sesquioxide matrices, concentration or annealing temperature. The phosphors containing Gd3+, Y3+, Lu3+ ions exhibit the same characteristic nearly
monochromatic emission. The images of the Y2O3:Eu3+
(1.0 mol%) nanomaterials under UV irradiation show identical strong red emission for all the phosphors annealed at temperatures from 500 to 1000 °C.
Table 2. Experimental values of intensity parameters (Ωλ), radiative (Arad) and non-radiative (Anrad) rates, emission lifetimes and emission quantum efficiencies of the 5D
0 emitting level determined for the RE2O3:Eu3+ (1.0 mol%) (RE3+: Y, Gd and Lu) phosphors, annealed for 1 hour, based on the emission spectra recorded at 77 K
RE2O3:Eu3+
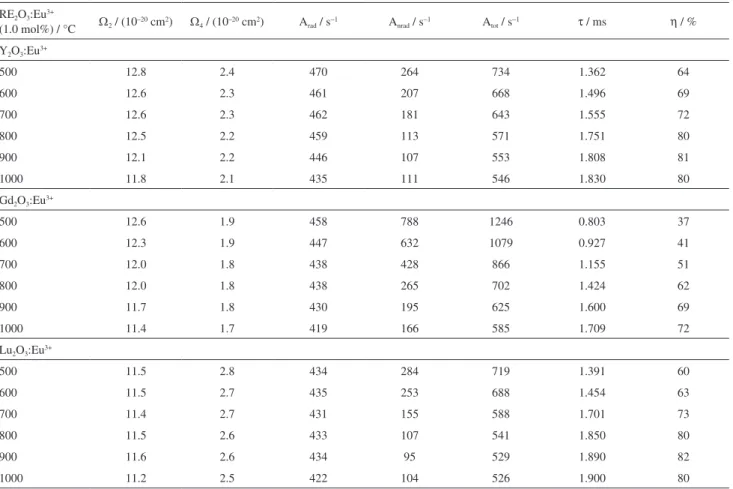
(1.0 mol%) / °C Ω2 / (10–20 cm2) Ω4 / (10–20 cm2) Arad / s−1 Anrad / s−1 Atot / s−1 τ / ms η / % Y2O3:Eu3+
500 12.8 2.4 470 264 734 1.362 64
600 12.6 2.3 461 207 668 1.496 69
700 12.6 2.3 462 181 643 1.555 72
800 12.5 2.2 459 113 571 1.751 80
900 12.1 2.2 446 107 553 1.808 81
1000 11.8 2.1 435 111 546 1.830 80
Gd2O3:Eu3+
500 12.6 1.9 458 788 1246 0.803 37
600 12.3 1.9 447 632 1079 0.927 41
700 12.0 1.8 438 428 866 1.155 51
800 12.0 1.8 438 265 702 1.424 62
900 11.7 1.8 430 195 625 1.600 69
1000 11.4 1.7 419 166 585 1.709 72
Lu2O3:Eu3+
500 11.5 2.8 434 284 719 1.391 60
600 11.5 2.7 435 253 688 1.454 63
700 11.4 2.7 431 155 588 1.701 73
800 11.5 2.6 433 107 541 1.850 80
900 11.6 2.6 434 95 529 1.890 82
1000 11.2 2.5 422 104 526 1.900 80
Ωλ: experimental values of intensity parameters; Arad: radiative rate; Anrad: non-radiative rate; Atot: total decay rate; τ: lifetime; η: quantum efficiency.
Figure 8. CIE diagram (center) and images and of [RE(TLA):Eu3+] (left) and RE
Conclusions
[RE(TLA):Eu3+] complexes present low total
decomposition temperature of the organic moistly producing the high luminescent RE2O3:Eu3+ materials at
500 °C. The benzenetricarboxylate method is reliable, efficient and reproducible for the synthesis of phosphors at low temperature. The red emission of the RE2O3:Eu3+
materials (RE3+: Y3+, Gd3+ and Lu3+) arise mainly from the
C2 symmetry site. The large values of the Ω2 experimental
parameters corroborates with the high intensity of the
5D
0 → 7F2 transition. Besides, these materials can act
as efficient red light conversion devices in the studied Eu3+-concentration range. Finally, the RE
2O3:Eu3+
phosphors prepared by the benzenetricarboxylate method using the [RE(TLA):Eu3+] present lower emission quantum
efficiency (η close to 80%) than from the [RE(TMA):Eu3+]
precursor complexes (η close to 90%). However they are cheaper, becoming an efficient and more economically viable system potentially usable as optical markers.
Supplementary Information
Supplementary information is available free of charge at http://jbcs.sbq.org.br as PDF file.
Acknowledgements
The authors acknowledge financial support from Conselho Nacional de Desenvolvimento Científico e Tecnológico (CNPq), Coordenação de Aperfeiçoamento de Pessoal de Nível Superior (CAPES) and Fundação de Amparo à Pesquisa do Estado de São Paulo (FAPESP).
References
1. Mustafa, D.; Silva, I. G. N.; Bajpe, S. R.; Martens, J. A.; Kirschhock, C. E. A.; Breynaert, E.; Brito, H. F.; Dalton Trans. 2014, 43, 13480.
2. Jiblaoui, A.; Leroy-Lhez, S.; Ouk, T.-S.; Grenier, K.; Sol, V.; Bioorg. Med. Chem. Lett. 2015, 25, 355.
3. Choi, J. R.; Tachikawa, T.; Fujitsuka, M.; Majima, T.; Langmuir 2010, 26, 10437.
4. Pan, Z.-R.; Xu, J.; Yao, X.-Q.; Li, Y.-Z.; Guo, Z.-J.; Zheng, H.-G.; CrystEngComm 2011, 13, 1617.
5. Atwood, D. A.; The Rare Earth Elements: Fundamentals and Applications; EIC Books; Wiley: Lexington, 2013.
6. Avichezer, D.; Schechter, B.; Arnon, R.; React. Funct. Polym. 1998, 36, 59.
7. Galvão, S. B.; Lima, A. C.; de Medeiros, S. N.; Soares, J. M.; Paskocimas, C. A.; Mater. Lett. 2014, 115, 38.
8. Sugimoto, S.; J. Phys. D: Appl. Phys. 2011, 44, 064001. 9. Ma, H.; Okuda, J.; Macromolecules 2005, 38, 2665.
10. Hong, Z. R.; Liang, C. J.; Li, R. G.; Li, W. L.; Zhao, D.; Fan, D.; Wang, D. Y.; Chu, B.; Zang, F. X.; Hong, L. S.; Lee, S. T.; Adv. Mater. 2001, 13, 1241.
11. Trojan-Piegza, J.; Niittykoski, J.; Hölsä, J.; Zych, E.; Chem. Mater. 2008, 20, 2252.
12. Gawryszewska, P.; Sokolnicki, J.; Legendziewicz, J.; Coord. Chem. Rev. 2005, 249, 2489.
13. Cotton, S.; Spectrochim. Acta, Part A 1990, 46, 1797. 14. Kumar, P.; Dwivedi, J.; Gupta, B. K.; J. Mater. Chem. C 2014,
2, 10468.
15. Moine, B.; Bizarri, G.; Opt. Mater. 2006, 28, 58.
16. Brito, H. F.; Malta, O. L.; Felinto, M. C. F. C.; Teotonio, E. E. S. In The Chemistry of Metal Enolates, Part 1; John Wiley & Sons: West Sussex, England, 2009.
17. De Sá, G. F.; Malta, O. L.; Donegá, C. M.; Simas, A. M.; Longo, R. L.; Santa-Cruz, P. A.; da Silva, E. F.; Coord. Chem. Rev. 2000, 196, 165.
18. Biggemann, D.; Mustafa, D.; Tessler, L. R.; Opt. Mater. 2006, 28, 842.
19. Souza, E. R.; Silva, I. G. N.; Teotonio, E. E. S.; Felinto, M. C. F. C.; Brito, H. F.; J. Lumin. 2010, 130, 283.
20. Kodaira, C. A.; Brito, H. F.; Felinto, M. C. F. C.; J. Solid State Chem. 2003, 171, 401.
21. Huang, H.; Xu, G. Q.; Chin, W. S.; Gan, L. M.; Chew, C. H.; Nanotechnology 2002, 13, 318.
22. Aitasalo, T.; Dereń, P.; Hölsä, J.; Jungner, H.; Lastusaari, M.; Niittykoski, J.; Stręk, W.; Radiat. Meas. 2004, 38, 515. 23. Silva, I. G. N.; Rodrigues, L. C. V.; Souza, E. R.; Kai, J.; Felinto,
M. C. F. C.; Hölsä, J.; Brito, H. F.; Malta, O. L.; Opt. Mater. 2015, 40, 41.
24. Nakamoto, K.; Infrared and Raman Spectra of Inorganic and Coordination Compounds; John Wiley & Sons: New York, 1997. 25. Silva, I. G. N.; Kai, J.; Felinto, M. C. F. C.; Brito, H. F.; Opt.
Mater. 2013, 35, 978.
26. Łyszczek, R.; J. Therm. Anal. Calorim. 2007, 90, 533. 27. Shannon, R. D.; Acta Crystallogr. 1976, 32, 751. 28. Vegard, L.; Z. Phys. 1921, 5, 17.
29. Hölsä, J.; Turkki, T.; Thermochim. Acta 1991, 190, 335. 30. Davolos, M. R.; Feliciano, S.; Pires, A. M.; Marques, R. F. C.;
Jafelicci, M.; J. Solid State Chem. 2003, 171, 268.
31. Klug, H. P.; Alexander, L. E.; X-ray Diffraction Procedures for Polycrystalline and Amorphous Materials; Wiley: New York, 1975.
32. Adachi, G.; Imanaka, N.; Chem. Rev. 1998, 1479.
33. Ren, H.; Liu, G.; Song, X.; Hong, G.; Cui, Z.; Proc. SPIE 6029, ICO20: Materials and Nanostructures 2006, 60291S. 34. Wang, F.; Deng, K.; Wu, G.; Liao, H.; Liao, H.; Zhang, L.;
35. Teotonio, E. E. S.; Fett, G. M.; Brito, H. F.; Faustino, W. M.; de Sá, G. F.; Felinto, M. C. F. C.; Santos, R. H. A.; J. Lumin. 2008, 128, 190.
36. Bünzli, J. C. G.; Coord. Chem. Rev. 2015, 293, 19.
37. Carlos, L. D.; Messaddeq, Y.; Brito, H. F.; Ferreira, R. A. S.; Bermudez, V. Z.; Ribeiro, S. J. L.; Adv. Mater. 2000, 12, 594. 38. Moura, R. T.; Carneiro Neto, A. N.; Longo, R. L.; Malta, O. L.;
J. Lumin. 2015, in press, DOI: 10.1016/j.jlumin.2015.08.016. 39. Silva, I. G. N.; Mustafa, D.; Andreoli, B.; Felinto, M. C. F. C.;
Malta, O. L.; Brito, H. F.; J. Lumin.2015, in press, DOI: 10.1016/j.jlumin.2015.04.047.
40. Ferreira, R. A. S.; Nobre, S. S.; Granadeiro, C. M.; Nogueira, H. I. S.; Carlos, L. D.; Malta, O. L.; J. Lumin. 2006, 121, 561. 41. Silva, I. G. N.; Brito, H. F.; Souza, E. R.; Mustafa, D.; Felinto,
M. C. F. C.; Carlos, L. D.; Malta, O. L.; Z. Z. Naturforsch., B: J. Chem. Sci. 2013, 69b, 231.
42. Zych, E.; Karbowiak, M.; Domagala, K.; Hubert, S.; J. Alloys Compd. 2002, 341, 381.
43. Karbowiak, M.; Zych, E.; Holsa, J.; J. Phys.: Condens. Matter 2003, 15, 2169.
44. Buijs, M.; Meyerink, A.; Blasse, G.; J. Lumin. 1987, 37, 9. 45. Macedo, A. G.; Ferreira, R. A. S.; Ananias, D.; Reis, M. S.;
Amaral, V. S.; Carlos, L. D.; Rocha, J.; Adv. Funct. Mater. 2010, 20, 624.
46. Boyer, J. C.; Vetrone, F.; Capobianco, J. A.; Speghini, A.; Bettinelli, M.; J. Phys. Chem. B 2004, 108, 20137.
47. Meltzer, R. S.; Feofilov, S. P.; Tissue, B.; Yuan, H. B.; Phys. Rev. B 1999, 60, R14012.
48. Whiffen, R. M. K.; Antić, Ž.; Speghini, A.; Brik, M. G.; Bártová, B.; Bettinelli, M.; Dramićanin, M. D.; Opt. Mater. 2014, 36, 1083.
49. Santa-Cruz, P. A.; Teles, F. S.; Spectra Lux Software v.2.0 Beta, Ponto Quântico Nanodispositivos, RENAMI, 2003.
50. Binnemans, K.; Coord. Chem. Rev. 2015, 295, 1.
Submitted: August 26, 2015
Published online: November 16, 2015
![Figure 1. Partial energy diagram of trimellitic acid (TLA) ligand from [RE(TLA)·(H 2 O) n ] (RE 3+ : Y, Gd and Lu) precursor (singlet and triplet states), Eu 3+ ion and RE 2 O 3 :Eu 3+ (LMCT) state.](https://thumb-eu.123doks.com/thumbv2/123dok_br/18998895.463085/2.892.77.408.792.1052/figure-partial-energy-diagram-trimellitic-precursor-singlet-triplet.webp)
![Figure 2. TG and DTG curves (a) [RE(TLA)] and (b) [RE(TLA):Eu 3+](https://thumb-eu.123doks.com/thumbv2/123dok_br/18998895.463085/3.892.484.819.103.544/figure-tg-dtg-curves-tla-b-tla-eu.webp)
![Figure 5. SEM images of [RE(TLA):Eu 3+ (1.0 mol%)] precursor complexes (a; b; c); RE 2 O 3 :Eu 3+ (1.0 mol%) phosphor annealed during 1 h (d; e; f) and TEM images of RE 2 O 3 :Eu 3+ (1.0 mol%) annelaed during 1 h at 1000 °C (g; h).](https://thumb-eu.123doks.com/thumbv2/123dok_br/18998895.463085/5.892.97.437.109.632/figure-images-precursor-complexes-phosphor-annealed-images-annelaed.webp)
![Figure 6. The (a) excitation spectra of [RE(TLA):Eu 3+ (5.0 mol%)] (RE 3+ : Y, Gd and Lu), with emission monitored at 616 nm; (b) emission spectra, with excitation at 295 nm, recorded at 77 K and (c) correlation between [RE(TLA):Eu 3+ (x%)] lifetimes an](https://thumb-eu.123doks.com/thumbv2/123dok_br/18998895.463085/6.892.76.787.113.461/excitation-emission-monitored-emission-excitation-recorded-correlation-lifetimes.webp)
![Table 1. Experimental values of intensity parameters (Ω λ ), radiative (A rad ) and non-radiative (A nrad ) rates, emission lifetimes and emission quantum efficiencies of the 5 D 0 emitting level determined for the [RE(TLA):Eu 3+ (x mol%)] (RE 3+ : Y,](https://thumb-eu.123doks.com/thumbv2/123dok_br/18998895.463085/7.892.97.824.166.522/experimental-intensity-parameters-radiative-radiative-lifetimes-efficiencies-determined.webp)