ACTA
Glyphosate Determination in Soil, Water and Vegetables
Using DPV Optimized by Response Surface Methodology
Reinaldo F. Teófilo1, Efraim L. Reis1,*, César Reis1, Gilmare A. da Silva1, José F. Paiva2 and Lauro T. Kubota3
1
Departamento de Química, Universidade Federal de Viçosa, UFV, 36570-000, Viçosa, MG, Brasil
2
Departamento de Química, Universidade Federal de Ouro Preto, UFOP, 35400-000, Ouro Preto, MG, Brasil
3
Instituto de Química, Universidade Estadual de Campinas, UNICAMP, 13084-971, Campinas, SP, Brasil
Received 13th November 2007; accepted 19th April 2008
Abstract
A voltammetric procedure optimized by experimental design for glyphosate determination in soil, water and vegetable samples is described. The voltammetry experiments were performed using a hanging mercury drop electrode (HMDE). The DPV variables involved in the optimization process were: voltage step, pulse amplitude, pulse interval, voltage step time and concentration of the supporting electrolyte. A full 25 factorial design was chosen to evaluate these effects. From the results obtained by the factorial design the three most important factors were determined. These variables were evaluated with a central composite design. Under the optimized conditions, the operational range was from 0.050 to 100.0 mg dm-3 and the detection and quantification limits were 14 and 48 µg dm-3, respectively. The optimized method was successfully applied to glyphosate determination in soil, water and vegetables after purifying with an ion exchange resin and derivation.
Keywords: glyphosate, SWV, experimental design, voltammetry.
Introduction
Glyphosate [N-(phosphonomethyl)glycine] is a non-selective amino-phosphonate acid-type herbicide, systemic and pos-emergence, described by Baird et al. in 1971. It was introduced into commerce in 1973 [1]. Sale of this herbicide represents about 60% of the world market of herbicides, totaling 1.2 billion
*
dollars per year, making this product the non-selective herbicide most extensively applied, mainly due to its broad spectrum for the elimination of weeds. Nowadays, especially with biotechnology support, some plants have to become resistant to glyphosate, increasing its consumption by approximately 20% per year [2].
The extensive use of this herbicide is worrying the environmentalists, although the World Health Organization (WHO) has concluded that there is no carcinogenic evidence. Nevertheless, the environmental effects, as in the flora and thus in the microbiological soil population, are pernicious [3,4]. This situation is worsened due to its possible accumulation. Thus, a study of the physico-chemical properties of glyphosate, its interactions with water and soil components, as well as its extraction, detection and quantification in natural samples is necessary [2,5].
Most of the papers concerning glyphosate determination employ high performance liquid chromatography (HPLC) [6], ion exchange chromatography coupled to a pulsed amperometric detector (PAD) [7], ion chromatography (IC) [8] or gas chromatography coupled to a mass spectrometer (GC-MS) [9-12], all of which are expensive and require long analysis time.
The glyphosate molecule presents in its structure a secondary amino group that, when treated with nitrous acid, is converted to an N-nitro group [13]. This one can be easily reduced, making possible its determination by voltammetric strategies [14]. Bronstad and Friestad [15,16] showed the possibility of applying differential pulse polarography (DPP) as an inexpensive and fast technique for glyphosate determination. Nevertheless its sensitivity is not sufficient for practical application in natural sample monitoring. However, the sensitivity of the technique can be increased by optimization using chemometric approaches such as the use of factorial designs, response surface methodology (RSM) [17-19], or by the sequential simplex method [20]. In a preliminary recent study [21], a reasonable sensitivity for glyphosate determination was reached by applying experimental designs in the optimization of a method using square wave voltammetry (SWV); however, in that study no application in natural samples was realized.
Experimental
Reagents and chemicals
Glyphosate (99.9% pure) was acquired from Monsanto Co., hydrochloric acid (37%) was from Merck, sodium nitrite from Synth and ammonium sulphamate from Sigma. All chemicals were used as received. The 1.0 mg cm-3 glyphosate solution and 0.10 g cm-3 ammonium sulphamate were prepared and stored because they are stable for long times at room temperature. 10.0 mg cm-3 sodium nitrite solution was freshly prepared before each use due to its easy oxidation. Anion-exchange resin with strongly basic characteristics (Dowex 1-X8-100 chloride form, from Aldrid) and strongly acid cation-exchange resin (Dowex 50W X8-200 hydrogen form, from Sigma) were utilized. Potassium hydroxide was obtained from Carlo Erba, and methylene chloride was acquired from ECIBRA. Charcoal was purchased from Nuclear.
Instruments
Eletrochemical measurements utilizing differential pulse voltammetry (DPV) were carried out in a polarograph with a 757 VA Computrace Stand (Metrohm, Herisau, Switzerland), working with a hanging mercury drop electrode (HMDE), Ag/AgCl as reference and platinum as counter electrodes. The data were acquired and treated with VA Computrace 1.0134 software. Data analysis and all graphics were done with the spreadsheet in Microsoft Excel software [22]. 500 × 25 mm chromatographic columns with Teflon stopcocks were used and the solution pH was checked with a Procyon – PHD10 potentiometer using a combination electrode.
Resin treatment and column preparation
The anion-exchange resin, Dowex 1-X8, in the chloride form was converted to hydroxide through the addition of an excess of 1.0 mol dm-3 KOH solution. The resin immersed in the alkaline solution was kept over night in a plastic recipient. After this period, the suspension was transferred to a glass fiber filter where the resin was washed with deionized water until complete neutralization. The hydroxide resin form was stored in water for posterior use. The cation-exchange resin was utilized without any prior treatment.
The column was prepared utilizing 20 cm3 of the anion-exchange resin. Glass wool was used as a support also at the top to avoid a vortex process. A peristaltic pump was employed to control the eluate output flow from the chromatographic system.
Sample origin and preparation
field. The feed and soil samples for fortification were collected in a virgin area and the fortified aqueous samples were prepared utilizing distilled water.
The soil and feed samples were dried keeping them in contact with air; subsequently they were ground, mixed and quartered. In the next step, the seed samples were pulverized in a vegetable grinder and the soil samples were passed through an 80 mesh sieve.
Water samples
A water sample of 500 cm3 was transferred to a plastic recipient where the pH was increased through addition of 5.0 mol dm-3 KOH. After that, the sample was percolated through the resin in the chromatographic column at 1.5 cm3 min-1.
Vegetable sample
A mass of 25.0 g of vegetable sample was transferred to an erlenmeyer flask (500 cm3) and in the same recipient were added 200 cm3 of distilled water and 80 cm3 of dichloromethane. The flask was shaken for 10.0 min with a speed rate of 200 rpm. All the volume was transferred to the centrifuge flasks and submitted to centrifugation during 20 min at a speed rate of 4000 rpm. The supernatant was filtered by suction through a slow filtration filter (pore 8 µm) and transferred to a recipient (500 cm3) containing 30 g of the cation-exchange resin. The content in the recipient was submitted to an ultrasonic bath for 10 min and then the mixture was filtered by suction. The cation-exchange resin was washed with 200 cm3 of deionized water and the pH of the sample was adjusted to 10 by adding 5.0 mol dm-3 KOH. The sample was percolated through the anion-exchange column at a flow rate of 1.5 cm3 min-1.
Soil sample
An amount of 50 g of the homogenized soil was added to 125 cm3 of a 0.2 mol dm-3 KOH solution in a flask that was closed and mechanically shaken for 15 min. All the volume was centrifuged during 20 min at 4000 rpm and the supernatant was transferred to a plastic flask. An additional 125 cm3 volume of 0.2 mol dm-3 KOH was added to the agitator flask containing the centrifuged soil. This was mixed using a glass rod and then transferred to a 250 cm3 flask, and agitated again for 15 min. The mixture was centrifuged and the supernatant was combined with the first extracted portion. The combined volume was transferred to the anion-exchange column and percolated at a flow rate of 1.5 cm3 min-1.
The collection, derivatization and analysis of glyphosate
fraction volume was the one that really contains the analyte. To both fractions of 20 cm3 were added 2 cm3 of concentrated HCl, while to the 40 cm3 fraction were added 4 cm3 of the same acid. Consecutively, masses of 0.25 and 0.5 g of activated coal were added to the 20 and 40 cm3 fractions, respectively. The mixtures were shaken for five minutes, and then filtered by suction utilizing filter paper. The filtered fractions of 20 and 40 cm3 were transferred to 25 and 50 cm3 volumetric flasks, respectively, for the derivatization step.
The preparation of the 500 mg dm-3 derivatized glyphosate solution was performed by adding 50.0 cm3 of the stock solution, 20.0 cm3 of 5.0 mol dm-3 HCl and 5.0 cm3 of 10.0 mg cm-3 sodium nitrite into a 100.0 cm3 volumetric flask. The solution was held for 15 minutes to complete the reaction. After that, 5.0 cm3 of 0.10 g cm-3 ammonium sulphamate was added to consume the excess nitrite, and the volume was completed with deionized water.
The following voltammetric procedures were carried out: (i) 10.0 cm3 of the sample were transferred to the electrochemical cell and nitrogen was bubbled for 300 seconds in the first step, and 30 seconds in the successive steps. The nitrogen flow was kept over the solution during the measurements. (ii) The equilibrium time was set to 10 s before cathodic sweeping between –0.5 and –0.9 Volts for the blank and after standard solution addition (0.1 cm3) of 500 mg dm-3 of nitrosaminated glyphosate. The instrument was set up to carry out three scans for each assay at the mean current values of the maximum peak in the nitrosaminated glyphosate determination (-0.70 V). (iii) Quantification was performed through standard addition.
Voltammetric parameters
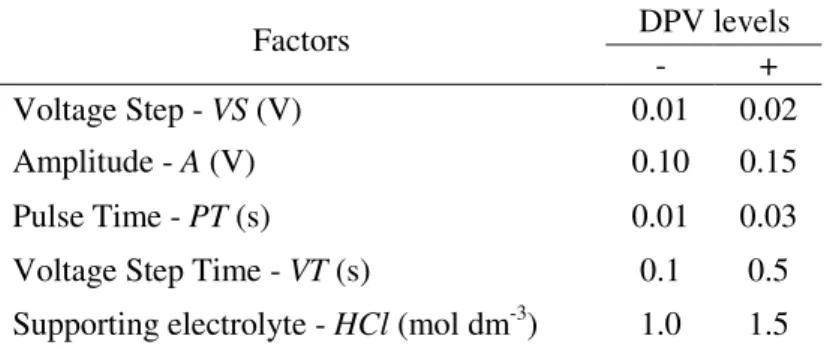
The aim of a factorial design is the verification of the influence dimension that specific factors have on about the experimental response. HCl was chosen as the supporting electrolyte based on the investigations carried out by Friestad and Bronstad [15,16]. Other factors, such as the voltage step, pulse amplitude, voltage step time and the pulse time were chosen as suggested by the literature [18-21]. However, these factor levels were defined based on previous univariate studies. The parameters purging time, purging additional time, equilibrium time and drop area were fixed in 300, 30 and 15 seconds and 0.6 mm2, respectively. Then, a 25 full factorial design was built (Table 1).
From the results of the factorial design, the selected variables were studied applying a central composite design (CCD).
Table 1. Factors and levels set to the factorial design. DPV levels Factors
- +
Voltage Step - VS (V) 0.01 0.02
Amplitude - A (V) 0.10 0.15
Pulse Time - PT (s) 0.01 0.03
Voltage Step Time - VT (s) 0.1 0.5
Results and discussion
A 25 full factorial design, whose levels are presented in Table 1, was conducted with the aim to establish the influence that each factor set above exerts on the experimental response and, moreover, to verify the interactions between these factors and the nature of these.
Table 2. Significant effects.
Effect* Std.err. t-test
Mean 301.01 4.07 73.94
VS 44.97 8.14 5.52
A 117.73 8.14 14.46
PT -125.09 8.14 -15.36
AxPT -40.31 8.14 -4.95
AxVT 27.26 8.14 3.34
PTxVT 21.14 8.14 2.59
* = 0.05; Degree of freedom ( ) = 64.
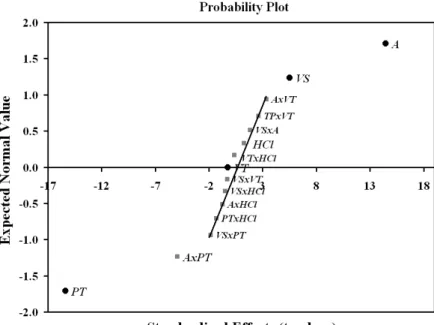
Figure 1. Probability effect plot for the 25 full factorial design.
The pulse time (PT) principal effect was negative and the most important one, indicating that a lower time during the pulse application, in other words, a lower drop polarization time, contributes to increasing the response.
glyphosate molecules. Nevertheless, the AxPT interaction effect suggests that when A factor alternates from the (-) level to the (+) level, keeping the PT factor in the (-) level, the mean response is higher than the same variation of the amplitude levels, within the (+) level of PT. So, applying the (-) of the PT level is necessary to use the (+) level of A factor. This fact certainly occurs due to the short time period where the capacitive current is more pronounced.
The VS effect was positive, indicating that higher increments, or fewer collected points during the scan, contribute to the increase in the response. Probably, the rapid polarization of the drop during the scan explains this influence in the voltammetric response, which is in agreement with the other effects.
Although the VT variable interactions were considered somewhat significant in Table 2, the probability plot (Fig. 1) shows that such interactions are significant. Based on these facts, it was decided to consider these as not-significant. Thus, the selected factors to the response surface study were VS, A and PT.
Response Surface Methodology (RSM)
Table 3 shows the variables utilized in the central composite design (CCD) of the response surface analysis with their respective levels. It can be observed that in this type of design the axial block levels need to be decoded to the experimental values of the variable levels studied. Thus, it is necessary to utilize the equation:
2 i i
z z x
z
− =
∆
where xi is the codified value of the CCD design, zi is the experimental value of the level, z is the mean value between the high (+) and low (-) levels, that corresponds exactly to the zero level value (0) and ∆z is the difference between the high (+) and low (-) levels. The VT and HCl variables had their levels fixed as 0.5 s and 1.0 mol dm-3, respectively.
Table 3. Levels utilized in the experimental design for response surface methodology.
Levels
-1.682 -1 0 1 1.682 VS (Volt) 0.0183 0.020 0.0225 0.025 0.0267
A (Volt) 0.083 0.100 0.125 0150 0.167 PT (s) 0.0083 0.010 0.0125 0.015 0.0167
Table 4. ANOVA table for the quadratic model of the DPV response surface.
SS df MS F Ftab(α = 0.015)
Regression 120930.9 9 13436.8 661.91 5.91
Residuals 162.4 8 20.3
Lack-of-fit 157.8 5 31.56 20.63 28.24
Pure error 4.6 3 1.53
Total SS 121093.3 17
SS – Square Sum, df – degrees of freedom, MS – Mean Square.
% explained variance = 99.86; % maximum explained variance = 99.99.
The quadratic model equation, presenting only the significant coefficients with α = 0.015 from the t Student test, is shown below:
2 2
0 62 0 34 0 34 0 34 0 35 0 35 0 44 0 44 0 44
367 08 4 20 90 99 21 52 5 48 5 23 1.82 1.45 6 30
p
. . . . . . . . .
i . . VS . A . PT . VS . A VS AP VS PT . A PT
± ± ± ± ± ± ± ± ±
= + + − − + + ⋅ + ⋅ − ⋅
According to the regression equation, the step factor presented here by the title A is emphasized by the value of its linear coefficient becoming, in this way, the highest influencing factor.
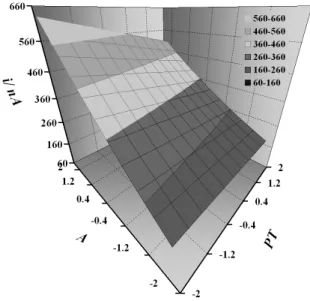
Fig. 2 presents the response surface obtained from the model equation where the A and PT variables are pointed out, with VS fixed at 1.682.
The response surface indicates that, to obtain higher current values, the amplitude must be conducted at its higher level in the design and the pulse time at its lower level. It can be observed that the linear terms are the more important ones for the model, which reflects in the surface, presenting a linear behavior. Note that there is a great current gain when working with the optimized variable levels, validating this work.
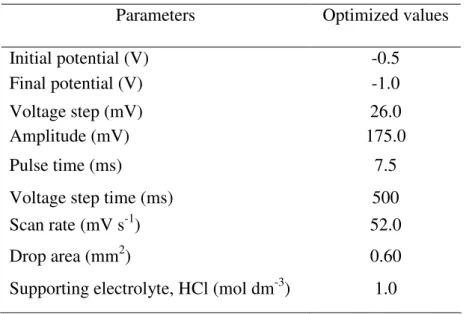
Table 5 relates the parameters with their respective values that optimize glyphosate herbicide voltammetric determination by the DPV technique.
Table 5. Optimized parameters for glyphosate herbicide analysis by DPV.
Parameters Optimized values
Initial potential (V) -0.5 Final potential (V) -1.0
Voltage step (mV) 26.0
Amplitude (mV) 175.0
Pulse time (ms) 7.5
Voltage step time (ms) 500
Scan rate (mV s-1) 52.0
Drop area (mm2) 0.60
Supporting electrolyte, HCl (mol dm-3) 1.0
Linearity and limits
The method for glyphosate determination utilizing differential pulse voltammetry was investigated in two linear portions (Fig. 3). The half-wave potential of the glyphosate utilizing the optimized parameters was -0.70 V.
The determination of the detection and quantification limits was performed according to Burgess (2000) [26] where it was possible to obtain values of 0.014 and 0.048 mg dm-3, respectively.
Friestad and Brønstad [16] reported an improvement to the first glyphosate determination method using polarography [15]. The improved procedure presented detection and quantification limits of 0.5 and 1.0 mg dm-3, respectively, and linearity of 1.0 to 100 mg dm-3. In an earlier work using the SWV technique [21] a linear response range of 0.050 to 100.0 mg dm-3, and detection and quantification limits of 25.0 and 80.0 µg dm-3 were, respectively, obtained. Zhu et al. utilized ion chromatography equipped with a conductivity detector [8] and obtained a detection limit of 42 g dm-3 and a linear range of 0.042 up to 100 mg dm-3. Sato et al. utilized anion-exchange chromatography with integrated pulsed amperometric detection (IPAD) and under optimized conditions; the detection limit was 50 g dm-3 and the linear range from 0.1 up to 50 mg dm-3. Other chromatographic techniques with different detectors discussed by Stalikas and Konidari [6] presented a mean value of 15 g dm-3 for the detection limit by GC analysis. Thus, this work presents a great improvement in the determination of glyphosate by electrochemical techniques, principally by voltammetric techniques. The detection limit of 14.0 g dm-3 is in the range of the principal chromatographic methods and better than the existing electrochemical techniques, while the linear range of 0.01 to 100.0 mg dm-3 is in agreement with the electrochemical techniques reported in the literature.
Analytical application
The application of the optimized methodology to glyphosate herbicide analysis in natural and fortified samples with a stage of pre-purification is presented in tables 6 and 7, respectively.
Table 6. Glyphosate recovery from fortified samples.
Sample number. Glyphosate recovery (%) Watera Soilb Vegetablesc 1 90.4 80.6 81.2 2 107.6 57.2 94.8
3 94.6 72.6 108.0
Mean 97.5 70.1 94.6 CV (%) 9.2 17.0 14.0
a
0.5 µg dm-3 of glyphosate added to water samples.
b
5.0 µg g-1 of glyphosate added to soil samples.
c
10.0 µg g-1 of glyphosate added to vegetable samples.
matrix complexity. The water samples presented the best precision, probably because in such samples no prior extraction treatment was needed.
Table 7. Glyphosate analysis of natural samples.
Sample number Glyphosate quantification (mg dm-3) Watera Soilb Vegetablesc
1 0.44 6.04 1.43
2 0.53 5.22 2.13
3 0.54 4.18 1.95
Mean ± SD 0.50 ± 0.05 5.15 ± 0.93 1.14 ± 0.36
CV (%) 11 18 20
The precision expressed in terms of CV was relatively good. CV values between 12 to 23 % are normally found in this type of analysis [9,10], due to matrix complexity. The clean-up stage is the most critic step and the deviation can be related with this.
Interference measurements were not executed because, after the clean up step, even from the soil samples uncontaminated by glyphosate, no voltammetric peak was obtained. This indicates that the method is selective, sensitive and relatively precise although the aminomethyl phosphonic acid (AMPA) metabolite is not detected.
Table 7 presents the natural sample analyses, which were collected from a region where the glyphosate herbicide is continuously applied. Observe that the soil samples presented a higher concentration, followed by the vegetable and water samples. The water samples presented the lowest concentrations and the lowest CV values, probably due to the sampling and the sample manipulation in the clean up stage, respectively. In a general way, the precisions were very close to those obtained to the recovery measurements, indicating that the sample manipulation in the clean up stage is a crucial factor to the quality of the results. The minimum and maximum concentration values obtained for the real samples were 0.44 to 6.04 mg dm-3. At these concentrations probably only the soil samples could present responses without the optimization procedure, as the maximum current obtained through the optimization is approximately 6 times higher than the minimum current. In this way, the optimization was really essential detection of possible to detect glyphosate in these samples.
Conclusions
The analytical curve of the glyphosate nitrosamine was linear over a wide concentration range. The proposed method is quite sensitive and presents sufficient detectability to be employed in samples of agriculture interest.
The sensitivity of the technique was lowered down to the order of µg dm-3, limits comparable to those obtained by chromatographic methods. In the assays performed applying natural samples, the stages of cleaning, pre-concentration and derivatization are simpler and faster, compared with equivalent steps for chromatographic determinations. Thus, the prior sample clean-up allowed having a method where there are no interferences and the optimized procedure was satisfactorily accurate for glyphosate determination in samples, although the AMPA metabolite is not detected.
Acknowledgements
The authors thank CAPES and CNPq for financial support and the Prof. Carol Collins for her technical assistance.
References
1. D.D. Baird, R.P. Upchurch, W.B. Homesley, and J.E. Franz, in S.M. Carlisle and J.T. Trevors, Water Air Soil Pollut. 39 (1988) 409.
2. O.P. de Amarante, T. dos Santos, N.M. Brito, and M.L. Ribeiro, Quim. Nova 25 (2002) 589.
3. M.L. Morrison and E.C. Meslow, For. Sci. 30 (1984) 95.
4. J. Marsh, H.A. Davies, and E. Grossbard, Weed Res. 17 (1977) 77.
5. O.P. de Amarante, T. dos Santos, N.M. Brito, and M.L. Ribeiro, Quim. Nova 25 (2002) 420.
6. C.D. Stalikas and C.N. Konidari, J. Chromatogr. A 907 (2001) 1.
7. K. Sato, J.Y. Jin, T. Takeuchi, T. Miwa, K. Suenami, Y. Takekoshi, and S. Kanno, J. Chromatogr. A 919 (2001) 313.
8. Y. Zhu, F.F. Zhang, C.L. Tong, and W.P. Liu, J. Chromatogr. A 850 (1999) 297.
9. E. Borjesson and L. Torstensson, J. Chromatogr. A 886 (2000) 207.
10. A. Royer, S. Beguin, J.C. Tabet, S. Hulot, M.A. Reding, and P.Y. Communal, Anal. Chem. 72 (2000) 3826.
11. C.D. Stalikas and G.A. Pilidis, J. Chromatogr. A 872 (2000) 215.
12. Z.H. Kudzin, D.K. Gralak, J. Drabowicz, and J. Luczak, J. Chromatogr. A 947 (2002) 129.
13. J. March, “Advanced Organic Chemistry: Reactions, Mechanisms, and Structure”, John Wiley and Sons, New York (1992).
14. W.F. Smyth, P. Watkiss, J.S. Burmicz, and H.O. Hanley, Anal. Chim. Acta 78 (1975) 81.
15. J.O. Bronstad and H.O. Friestad, Analyst 101 (1976) 820.
16. H.O. Friestad and J.O. Bronstad, J. Assoc. Off. Anal. Chem. 68 (1985) 76. 17. P. Gratteri, S. Furlanetto, E. LaPorta, S. Pinzauti, and R. Leardi, Farmaco
18. M.A. Alonso, S. Sanllorente, L.A. Sarabia, and M.J. Arcos, Anal. Chim. Acta 405 (2000) 123.
19. S. Furlanetto, S. Orlandini, G. Aldini, R. Gotti, E. Dreassi, and S. Pinzauti, Anal. Chim. Acta 413 (2000) 229.
20. C.F. Oduoza, Chemometrics Intell. Lab. Syst. 17 (1992) 243.
21. R.F. Teófilo, E.L. Reis, C. Reis, G.A. da Silva, and L.T. Kubota, J. Braz. Chem. Soc. 15 (2004) 865.
22. R.F. Teófilo, M.M.C. Ferreira, Quim. Nova 29 (2006) 338.
23. B.B. Neto, I.S. Scarminio, and R.E. Bruns, “Como Fazer Experimentos. Pesquisa e Desenvolvimento na Ciência e na Indústria”, Editora da Unicamp, Campinas (2001).
24. D.C. Montgomery, “Design and Analysis of Experiments”, John Wiley and Sons, New York (2001).
25. R.H. Myers and D.C. Montgomery, “Response Surface Methodology: Process and Product Optimization Using Designed Experiments”, John Wiley and Sons, New York (2002).