Prevalence of overweight and
obesity and adiposity central
indexes among school-aged
children in Santa Catarina, Brazil
Prevalência de sobrepeso e
obesidade e indicadores de
adiposidade central em escolares de
Santa Catarina, Brasil
Gabriela Dalsasso RICARDO¹
Gilberto Veras CALDEIRA
2Arlete Catarina Tittoni CORSO
3¹ Graduate Program in Nutrition, Universidade Federal de Santa Catarina 2Departament of Nutrition, Universidade Federal de Santa Catarina
3Department of Nutrition, Graduate Program in Nutrition, Universidade Federal
de Santa Catarina
Funding:Research funded by the Conselho Nacional de Desenvolvimento Cientíico e Tecnológico (CNPq), Process # 402334/2005-1, and by the Fundo Nacional de Desenvolvimento da Educação (FNDE), in partnership with Centro Colaborador em Alimentação e Nutrição do Escolar Sul (CECA-NE Sul) and Centro Colaborador em Alimentação e Nutrição do Escolar do Estado de Santa Cata-rina (CECANE SC).
Correspondence to: Gabriela Dalsasso Ricardo. Av Governador Adolfo Konder, nº 20, apto 104. Cam-pinas, São José, Santa Catarina, Brasil. CEP – 88101400. E-mail: [email protected]
Resumo
Objetivo: Estimar a prevalência de
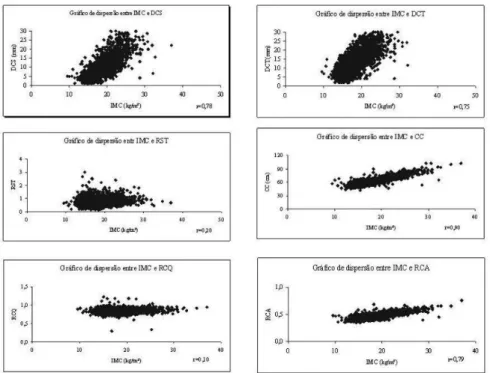
so-brepeso e obesidade entre escolares e sua associação com região, sexo, faixa etária e rede de ensino, e a correlação entre os índices antropométricos. Método: Estudo transversal com 4.964 escolares entre 6 a 10 anos de idade matriculados em 345 escolas do ensino fundamental do Estado de Santa Catarina. Foi utilizado o índice de massa corporal para diagnosticar sobrepeso e obe-sidade. Como indicadores de distribuição de gordura foram utilizadas circunferência de cintura, relação cintura-quadril, relação cintura-altura, dobras cutâneas triciptal e subescapular e razão subescapular-triciptal. Foram estimadas as razões de chance com IC 95% e calculada correlação de Pearson para avaliar a relação entre índice de massa corporal e índices antropométricos. Resul-tado: Do total dos escolares, 52,2% eram do sexo feminino. A prevalência de sobrepeso foi de 15,4% e de obesidade 6,0%. Não foi encontrada associação entre sobrepeso ou obesidade com regiões, sexo e faixa etária, somente entre sobrepeso e rede particular. Os escolares da rede particular apresenta-ram 1,46 (1,22-1,74) vezes mais chance de desenvolverem sobrepeso. Foi encontrada correlação forte entre o índice de massa corporal e a circunferência de cintura (r = 0,90). Conclusão: Os escolares da rede particular estão mais expostos ao sobrepeso e à obesidade, sugerindo que a condição socioeconômica dos escolares possa ser a explicação. A circunferência de cintura, além de indicador de adiposidade central, poderá ser utilizada como indicador de adiposidade total.
Palavras-chaves: Sobrepeso. Obesidade.
Abstract
Objective: To estimate the prevalence of
overweight and obesity in school children, their association with region, gender, age, school system, and correlation between anthropometric indexes. Method: Cross-sectional study with 4,964 children between 6 and 10 years of age of 345 elementary schools in the state of Santa Catarina. Body mass index was used to diagnose overweight and obesity according to Cole et al. (2000). Waist circumference, waist-to-hip ratio, waist-to-height ratio, triceps and subscapu-lar skinfold thickness and subscapusubscapu-lar-to- subscapular-to-triceps ratio were used as fat distribution indexes. We estimated the odds ratio with a 95% CI. To assess the relationship between BMI and anthropometric indexes, Pearson’s correlation was calculated. Results: 52.2% of the students were female. The prevalence of overweight and obesity were 15.4% and 6.0%. There was no association between overweight or obesity and regions, gender or age; only between overweight and the pri-vate network. Children in the pripri-vate school network were 1.46 (1.22-1.74) times more likely to develop overweight. The correlation between BMI and waist circumference was the strongest (r = 0.90). Conclusion: Chil-dren in the private school network are more exposed to overweight and obesity than those in the public network, suggesting that socioeconomic conditions of schools could be the explanation. The waist circumference indicator of central adiposity may be used as an indicator of total adiposity.
Key Words: Overweight. Obesity.
School-children. Anthropometric Indexes.
INTRODUCTION
Overweight and obesity are major glo-bal public health problems, affecting all population age groups1. There is a chief concern with these events occurring during childhood, given that overweight or obese children may have their health affected, developing cardiovascular diseases or dia-betes, among others2.
Studies have appointed high overweight and obesity prevalence rates during chil-dhood in some European countries: 32% in Portugal for children between 7 and 9 years of age, 31% in Spain for children between 2 and 9 years of age, and 27% in Italy for chil-dren between 6 and 11 years of age2. In Bra-zil, in past decades, national surveys have reported that the prevalence of overweight and obesity among 6 to 9 year-old children had an increase from 4.9% in 1974 to 17.4% in 1996/1997, showing the magnitude and severity the problem developed among children throughout the country3.
The diagnosis of overweight and obesity in epidemiological studies has been perfor-med by anthropometry, due to easy execu-tion and low cost, allowing for assessment of children growth and body dimensions at different ages. The body mass index (BMI) relects total body fat excess and has been greatly used for diagnosis of overweight and obesity in adults and children4,5. However, there has been concern regarding the type of fat distribution deposit, given it relates with the prognosis of health risk6.
According to Moreno et al. (2007), there are two types of central fat deposits: abdominal fat and trunk fat which can be described by a variety of anthropometric measures7. The present study used waist circumference, to-hip ratio and waist-to-height ratio as indicators of abdominal fat, and triceps skin fold thickness and subs-capular and subssubs-capular-to-triceps ratio as indicators of trunk fat.
prevalence of overweight and of obesity in children are restricted to studies performed in isolated cities8 or at public schools9,10, the present study intends to estimate the prevalence of overweight and obesity, verify the association of overweight and obesity with region, gender, age group and school network, and the correlation among anthropometric indexes in school children between 6 and 10 years of age in the State of Santa Catarina.
METHOD
Data analyzed in the present study are from a research Project named “Monitoring Implementation of the School Cafeteria Regulation Law on Food Habits and Nu-tritional Status of Schoolchildren of Santa Catarina” - (“Acompanhamento da imple-mentação da Lei de Regulaimple-mentação das Cantinas Escolares sobre os hábitos alimen-tares e o estado nutricional de escolares de Santa Catarina”). The State of Santa Catarina is located in the Center South Brazil, and has a population of 5,866,487 inhabitants and a territory of 95.4 thousand km² 11.
Data were collected between June 2007 andMay 2008, with schoolchildren enrolled in public and private schools, located in eight cities of the State of Santa Catarina.
The sampling plan included two focus units of interest: the school and students. To build the universe of schools of elementary school in the State of Santa Catarina, schools were divided into three regions: West (West and Mid West), Center (North, Mountain and Valley Areas) and Coast (Great Floria-nópolis, North and South Coast).
In the three geographical regions, scho-ols were located in eight reference munici-palities, classiied as those with the higher number of schoolchildren enrolled in the initial grades of elementary school: Chapecó and Joaçaba in the West, Blumenau, Jaraguá do Sul and Lages in the Center, Criciúma, Florianópolis and Joinville in the Coast.
According to the Educational Census conducted by the Ministry of Education in 2006 there were 4,007 elementary schools
in the State of Santa Catarina--one federal, 3,661 public (municipal and state) and 345 private (Available at: http://www.inep.gov. br/censo/basica/dataescolabrasil/). To cal-culate the sample, the federal school and the schools that declared not having schoolchil-dren in initial grades of elementary school were excluded. For the inal deinition of schools to be investigated, other criteria were introduced based on inancial-ope-rational aspects, such as whether schools were public or private and the number of schoolchildren enrolled.
In this manner, the study universe com-prised 140,878 schoolchildren enrolled at 569 public and private schools of the eight municipalities previously selected, separa-ted into six extracts of interest that included a combination of the three regions and both public and private schools.
The number of schools to be studied was calculated so as to guarantee a sample error of a maximum of plus or minus 6 per-centage points, for each of the six extracts of interest. Thus the inal sample comprised 347 schools, 266 public and 81 private, with the inclusion of schools located in urban and rural areas.
The sample of schoolchildren was ran-dom with a split proportional to grade, and depended on the number of schoolchildren enrolled in the grade drawn in each school. All participants had a Consent Form signed by their parents or guardians, totaling 5,686 schoolchildren authorized to take part in the survey.
Data that refer to the region, private or public school, age (calculated as the diffe-rence between date of collection and birth date) and gender were obtained at the se-cretariat of schools and copied to students’ identiication records. Ages were grouped into four groups: 6 and 7-year-olds, 8-year-olds, 9-year-olds and 10-year-olds.
Anthropometric weight, height, circu-mferences and skin fold data were collected according to procedures described in the Anthropometric Standardization Reference Manual, of Lohman et al. (1991)12. Weight was measured once on a digital, PP 180 Mar-te branded scale with capacity for 180kg and 100g accuracy. In order to attain height, a stadiometer manufactured by Altura Exata, with 1mm accuracy, was used in a single me-asurement. Weight and height were used to calculate BMI, in which weight in kilograms was divided by the square height in meters.
Circumferences and skin fold measu-rements were collected three times each, not consecutively, utilizing the mean of values for analysis. Weight and hip circu-mferences measurements were verified using a non elastic measuring tape with 0.1mm accuracy. The waist circumference measurement was read horizontally, at the narrowest width of the trunk, at the level of the natural waist. The quotient between waist circumference and hip allowed buil-ding the waist-to-hip ratio and the quotient between waist circumference and height allowed building the waist-to-height ratio.
In order to get triceps skin fold thickness and subscapular measurements, a scientiic Lange branded 0.1mm-accuracy adipome-ter was used. The quotient between subsca-pular and triceps skin fold thickness allowed building the subscapular-to-triceps ratio.
Dependent variables were overweight and obesity, classified according to the BMI by gender and age, according to cut-off points proposed by Cole et al. (2000)4, recommended by the International Obesity Taskforce – IOTF, based on overweight ou-tcome values (values equivalent to BMI over 25kg/m² and under 30kg/m² of adults) and obesity (values equivalent to BMI equal or
over 30kg/m² of adults). Independent varia-bles were region (West, Center and Coast), school network (public and private), gender (male or female) and age group.
Anthropometric variables were subsca-pular skin fold (SSF), triceps skin fold (TSF), subscapular-to-triceps ratio (STR), waist cir-cumference (WC), waist-to-hip ratio (WHR), waist-to-height ratio (WHtR), used to verify relationship with BMI in schoolchildren with no overweight, with overweight and with obesity.
Data were processed in Epi data ver-sion 3.0 and analyses were performed in SPSS 15.0 software. Descriptive statistics were used (frequency, mean and standard-deviation) and odds ratios estimated (Odds Ratio – OR), using non conditional logistic regression, and respective 95% conidence intervals. Two outcomes of the cross-sectional study with different levels of prevalence were assessed: overweight (15.4%) and obesity (6.0%). The non con-ditional logistic regression technique was chosen as showed to be more appropriate for low magnitude events13, as veriied for the prevalence of obesity. Variables with a p < 0.20 value in the univariate analysis, in the 2 test were selected for non conditional multivariate regression analysis. Means and standard-deviations of anthropometric va-riables were calculated for schoolchildren stratiied into three groups (not overweight, overweight and obese), performing analysis of variance (one-way ANOVA); to establish possible differences between group means, the Tukey test was used (p ≤ 0.05). The
Cata-rina (n.031/06 of 04/24/06) and followed the rules of Resolutions 196/96 and 251/97 of the National Health Council on research involving humans.
RESULTS
There were 345 schools that agreed to participate in the present study, 269 public and 76 private. Schools were distributed per region as follows: West, 55 public and 12 private schools, Center, 96 public and 14 private schools, and Coast, 118 public and 50 private schools.
The study had the participation of 4,964 schoolchildren with ages between 6 and 10 years, enrolled between the 1st and 4th grades of elementary school. We excluded from the inal sample 275 schoolchildren absent on the collection of anthropometric data, as well as 358 above 10 years of age, and 89 due to inconsistent data. Among the 4,964 schoolchildren, 2,375 (47.8%) were boys and 2,589 (52.2%) girls.
The prevalence of overweight found was 15.4% and of obesity 6.0%. Prevalence of overweight presented a difference only for the private school network, higher (19.7%) than the public school network (14.3%).
There was no association between overweight and obesity of schoolchildren with gender, age group and region (Tables 1 and 2). An association was veriied only between overweight and school network. Schoolchildren enrolled in the private scho-ol network were 1.46 (1.22-1.74) more likely to develop overweight than schoolchildren enrolled in the public network (Table 2).
Table 3 presents the central tendency and dispersion measures of anthropometric variables according to three groups (not overweight, overweight, obese) and gender of the schoolchildren. Male schoolchildren were observed to be different in the three groups (p ≤ 0.05) for subscapular skin fold
(SSF), triceps skin fold thickness (TSF), subscapular-to-triceps ratio (STR), waist circumference (WC), waist-to-hip ratio
Tabela 1 – Prevalência (%) e razão de chance (Odds ratio – OR) bruta de sobrepeso e obesidade de acordo com as variáveis sexo, faixa etária, rede de ensino e região em escolares de oito municípios do Estado de Santa Catarina, 2008. Table 1 – Prevalence (%) and unadjusted odds ratio (OR) between overweight and obesity and gender, age, region and education network of school children in eight cities of the state of Santa Catarina, 2008
Variables Obesity Overweight
% Unadjusted OR
CI 95% p-value % Unadjusted OR
CI 95% p-value
Gender 0.104 0.424
Female 5.5 1.00 15.9 1.00
Male 6.7 1.22 0.96-1.54 14.9 0.94 0.80-1.10
Region 0.893 0.683
Coast 5.9 1.00 15.2 1.00
Center 6.1 1.03 0.79-1.34 15.3 1.01 0.85-1.20
West 6.3 1.08 0.77-1.52 16.4 1.10 0.88-1.38
School Network 0.337 <0.001
Public 6.3 1.00 14.3 1.00
Private 5.1 0.86 0.63-1.17 19.7 1.46 1.22-1.74
Age Group 0.242 0.601
6 e 7 years 6.1 1.00 14.4 1.00
8 years 6.0 0.98 0.71-1.36 15.5 1.09 0.88-1.35
9 years 6.90 1.16 0.85-1.59 16.1 1.16 0.94-1.44
(WHR) and waist-to-height ratio (WHtR) measures. The group with obesity had higher values of STR and WHR measures when compared to the remaining groups. As to remaining measures, different means were observed among the three groups, in which values increased among groups with no overweight, with overweight and with obesity, respectively.
Differences among the three groups were also found among female schoolchil-dren (p ≤ 0.05) for SSF, TSF, STR, WC, WHR
and WHtR measures (Table 3). The group with obesity had a higher value for the WHR measure when compared to the other groups. As to the remaining measures, diffe-rent means were veriied among the three groups, values increasing in the groups with no overweight, with overweight and with obesity, similar to what was found in male schoolchildren.
Figure 1 presents the dispersion graphs between BMI and anthropometric varia-bles (SSF, TSF, STR, WC, WHR, WHtR) of all schoolchildren, with four strong positive correlations being observed between BMI and the following measures: SSF, TSF, WC, WHtR, and two weak correlations between BMI and STR, BMI and WHR.
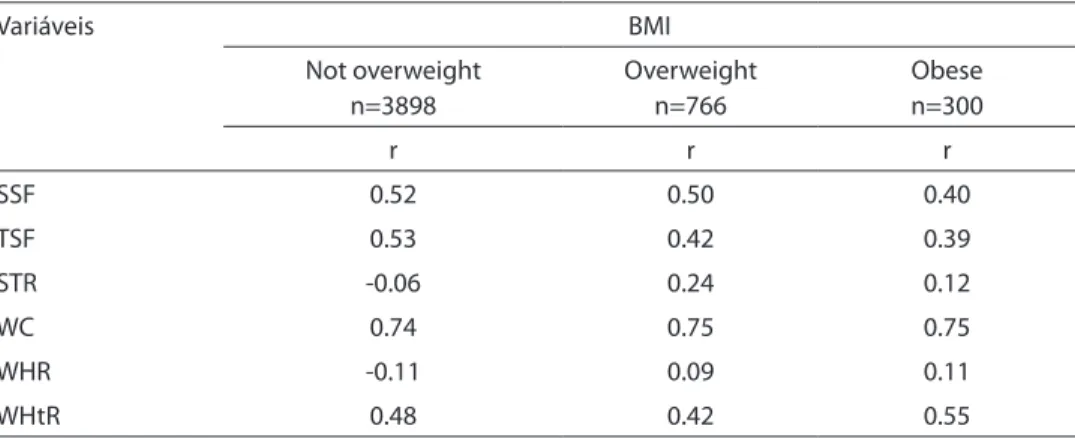
Table 4 presents Pearson correlation values for not overweight, overweight and obese schoolchildren; the only variable that kept a strong correlation in the three groups was waist circumference and the remaining
varied from weak to moderate.
DISCUSSION
Among the limitations of the present study, we should point out the fact the inal sample of schoolchildren depended on the number of children enrolled in the group selected at the school and on return of the Consent Form by guardians. The technical measurement error of the data collecting team was not determined, and although the team was experienced, the variations in the execution of the technique are unknown. However, 10% of the schoolchildren sample was measured twice in order to control the quality of anthropometric measures, a fact that minimized the limitation.
The present study is relevant from the social point of view as it is to the public health nutrition area, because there are no current data on the prevalence of overwei-ght and obesity in 6 to 10 year-old school-children of different municipalities of a State of the Federation. The data from the Family Budget Survey – POF 2002-200315 did not present the prevalence of overweight and obesity based on BMI for children less than 10 years old.
Comparison of the prevalence of overweight and obesity with results from other studies becomes complex due to the different age groups, the variety of methods applied and the cut-off points used in the
Tabela 2 – Razão de chance (Odds ratio – OR) ajustada de sobrepeso e obesidade e as variáveis sexo e rede de ensino em escolares de oito municípios do Estado de Santa Catarina. 2008. Table 2 – Adjusted odds ratio between overweight and obesity and gender. education network of school children in eight cities of the state of Santa Catarina. 2008
Variáveis Obesidade Sobrepeso
Adjusted OR CI 95% p-value Adjusted OR CI 95% p-value
Gender 0.105 0.434
Female 1.00 1.00
Male 1.22 0.96-1.54 0.94 0.80-1.10
School Network 0.341
Public 1.00 1.00 <0.001
Tabela 3 – Medidas de tendência central e de dispersão das variáveis antropométricas de acordo com o estado nutricional e sexo dos escolares de oito municípios do Estado de Santa Catarina, 2008.
Table 3 – Central trend measures and dispersion of anthropometric variables in accordance with nutritional status and gender of school children in eight cities of the state of Santa Catarina, 2008.
Variables Not overweight Overweight Obese
Males n= 1863 n=354 n=158
M DP M DP M DP p-value
SSF (mm) 5.44a 1.97 11.27b 5.11 18.39c 6.42 <0.001
TSF (mm) 8.81a 3.61 16.35b 5.14 21.90c 6.33 <0.001
STR 0.66a 0.21 0.70a 0.24 0.87b 0.30 <0.001
WC (cm) 57.50a 3.83 66.69b 5.47 75.27c 7.52 <0.001
WHR 0.84a 0.04 0.84a 0.04 0.87b 0.06 <0.001
WHtR 0.44a 0.03 0.49b 0.03 0.55c 0.04 <0.001
Females n=2035 n=412 n=142
SSF (mm) 6.60a 2.61 12.78b 5.21 20.37c 7.03 <0.001
TSF (mm) 10.82a 4.00 17.42b 4.96 23.81c 6.42 <0.001
STR 0.64a 0.22 0.75b 0.25 0.87c 0.25 <0.001
WC (cm) 56.07a 4.02 64.83b 4.85 74.28c 7.63 <0.001
WHR 0.81a 0.04 0.82a 0.05 0.85b 0.05 <0.001
WHtR 0.43a 0.03 0.48b 0.03 0.54c 0.04 <0.001
* Nas linhas, médias seguidas por letras diferentes, diferem estatisticamente pelo teste Tukey, ao nível de 5% de significância. * On the lines, the means followed by different letters are statistically different according to the Tukey test, at a 5% level of significance
Figura 1 – Gráicos de dispersão entre o IMC (kg/m²) e as variáveis antropométricas [DCS (mm), DCT, RST, CC (cm), RCQ, RCA] de todos os escolares de oito municípios do Estado de Santa Catarina, 2008.
diagnosis of overweight and obesity. This discussion is based on studies that used similar age groups and BMI for age and gender as diagnostic criteria.
In the present study a prevalence of 15.4% of overweight and 6.0% of obesity was estimated among schoolchildren. If you consider that overweight includes obe-sity, the prevalence reaches 21.4%. A study performed with the Brazilian population in the 1996-1997 period showed a prevalence of overweight including obesity of 17.4% in children between 6 and 9 years of age using the same diagnostic criterion3. A small variation in values found in Santa Catarina was observed, when compared to national igures. However, there is a difference of roughly 12 years between the studies.
A study performed previously in the state capital, Florianópolis, with 7 to 10 year-old schoolchildren, showed 15.5% of overweight and 5.5% of obesity in public and private schools8. The prevalence of overweight and obese schoolchildren of the eight municipalities of the State of Santa Catarina was also observed to be similar to the values found in the capital8.
The comparison of prevalence of overweight and of obesity found in interna-tional studies that used the same diagnostic criteria and similar age groups showed that
overweight and obesity values were close to those found in France (14.3 and 3.8%) and Germany (15.5 and 4.3%)16,17. Higher preva-lences were found in Chilpancingo/Mexico (28.1 and 13.7%) and in Sintra/Portugal (23 and 12.6%)18,19. Data highlight that overwei-ght and obesity affect both developed and developing countries, conirming the global epidemic of these events, and becoming one of the concerns in public health, not only because of the consequences in the health-disease process, but also due to the possibilities of association with other dise-ases that affect adult life.
Among variables, gender, age group, school network and region were selected in this study to assess the association with overweight and obesity. The only one with a statistically signiicant association was school network, because schoolchildren enrolled in the private network had a higher prevalence of overweight than those enrol-led in the public network, a similar result to other domestic studies20,21,22-24.
Schoolchildren enrolled in the private network of Santa Catarina were 1.46 (1.22-1.74) more likely to become overweight, and studies performed in the Brazilian cities of Natal/RN and Capão da Canoa/RS showed similar results24,25. Vieira et al. (2008), in the city of Pelotas/RS, veriied that
schoolchil-Tabela 4 – Distribuição dos valores de correlação de Pearson das variáveis antropométricas de escolares de oito municípios do Estado de Santa Catarina, 2008.
Table 4 – Distribution of Pearson’s correlation values for anthropometric variables of school children in eight cities of the state of Santa Catarina, 2008.
Variáveis BMI
Not overweight n=3898
Overweight n=766
Obese n=300
r r r
SSF 0.52 0.50 0.40
TSF 0.53 0.42 0.39
STR -0.06 0.24 0.12
WC 0.74 0.75 0.75
WHR -0.11 0.09 0.11
WHtR 0.48 0.42 0.55
*Todas as variáveis diferem estatisticamente ao nível de 5% de significância (valor de p<0.05).
dren enrolled in the private network had an extra 10% risk of being overweight in relation to the municipal network 20.
Socioeconomic variables such as fami-ly income, per capita family income and schooling of parents, frequently used in epidemiological studies, were not included in the present study to assess the socioeco-nomic status of schoolchildren. However, the school network in Brazil can be consi-dered a social class marker, indicating that students in the private network belong to a higher social class, given that schoolchil-dren that belong to higher socioeconomic level families generally go to private schools.
Although girls presented a higher preva-lence of overweight and boys a higher pre-valence of obesity, no statistically signiicant association was found between overweight and obesity and gender. Other studies per-formed in Brazil did not ind association between these variables either 21,24,26,27. On the other hand, a study performed in the city of Santos/SP revealed that the prevalence of overweight was higher for girls than for boys (p = 0.008) and the prevalence of obesity was higher for boys (p < 0.001)23. According to Reilly (2006), in developed countries chil-dhood obesity is common both in girls and boys, as was observed for schoolchildren of Santa Catarina28.
Prevalence of overweight and obesity were similar for all age groups in the pre-sent study, without a statistically signiicant association between variables. Studies with schoolchildren conducted in the Brazilian cities of Feira de Santana/BA, Natal/RN and Arapoti/PR also did not verify this associa-tion21,24,27. However, a study performed in the city of Pelotas/RS appointed that age had negative tendency when associated with overweight and obesity, that is, the higher the age, the lower the risk20.
Also in the present study, prevalence of overweight and obesity was similar in the three regions and no statistically signiicant association was found between these varia-bles. International studies have associated overweight and obesity with urban and rural areas, identifying a higher prevalence in
rural areas29,30. However, a study performed in Cajamar/SP with schoolchildren entering elementary school in public schools did not ind an association between overweight (in-cluding obesity) and urban and rural areas. 31 In Santa Catarina, all municipalities that took part of the present study have a Human Development Index – HDI above 0.8011. The HDI is a standardized way to assess and measure the well-being of a population and the value of 0.80 indicates appropriate living conditions according to criteria of wealth, schooling and mean life expectancy, which determine schooling, longevity and per capita family income. This may explain the similarities in the prevalence of overweight and obesity of schoolchildren found in the regions.
The BMI expresses the changes that may occur in the set of body components, but does not verify the fat distribution pattern. For that reason, clinicians and researchers have used a variety of measures as proxies to the distribution of body fat6. Thus, iden-tifying the relationship between BMI and other anthropometric indexes is very im-portant, given that the type of deposit of fat distribution relates to health risk prognosis6. In the present study, the variable that most correlated with BMI was WC in schoolchildren with no overweight, with overweight and with obesity. Other studies found a good correlation between these va-riables10,32, suggesting that WC be used in the diagnosis of overweight and child obesity33. Assis et al. (2007) compared, in schoolchil-dren of Florianópolis/SC, overweight and obesity deined by BMI and WC according to British references, having shown moderate agreement (k = 0.58) between the variables34. In this manner, it may be suggested that BMI and WC be utilized simultaneously in the diagnosis of overweight and obesity.
0.93; 0.91; r = 0.65; 0.50, for boys and girls, respectively)35. In Santa Catarina, a higher correlation between WC and BMI than with WHtR was also observed when analyzing these measures in schoolchildren with no overweight, with overweight and with obesity. These indings indicate that school-children that are overweight and obese diag-nosed by BMI present higher values of waist circumference and waist-to-height ratio. In adults, a WHtR with a value of 0.5 or less is considered normal and values over 0.5 can be classiied as a cardiovascular risk factor. This value has been used as a cutoff point and suggested to be applied in children and adolescents36. However, studies that involve diagnostic tests, such as sensitivity and speciicity for different age groups, will be necessary for deining cutoff points for the indicator.
WHR presented a weak correlation with BMI, and similar results were found in other studies10, 32. As BMI increases, WHR does not accompany the variation. This means that overweight and obese schoolchildren do not necessarily have a high WHR. These indings suggest that WHR is not a good indicator of abdominal fat related to overweight and obesity10, given that the measurement of the hip does not increase in children in this age group.
The correlation between BMI and skin folds was strong when all schoolchildren are considered, and it may be considered
a good indicator of fat, given that through the width of skin fold, fat located in certain regions of the body can be determined. Similar results were veriied by other stu-dies, inding a good correlation between these measurements37-39. However, when the analysis is performed with the ratio between skin folds, correlation becomes weak. This occurs, probably, due to small variation in ratio values40. The explanation may justify the result found in this study.
Conirming the magnitude and severity of high prevalence of overweight and obesity among schoolchildren throughout Brazil, the results of this study showed that per each 100 schoolchildren assessed, approximately 21, about one ifth, are overweight or obe-se. Schoolchildren enrolled in the private network are more exposed to overweight than those of the public network, suggesting that this fact may be explained by the socio-economic status. Among anthropometric indexes, waist circumference presented a better correlation with BMI. In addition to the indicator of central adiposity, waist circumference could be used as an indicator of total body fat, as of the deinition of cutoff points, according to the age and gender of children and adolescents.
These results may provide support for health intervention and promotion progra-ms and actions to prevent and reduce the prevalence of overweight and obesity in schoolchildren of Santa Catarina.
REFERENCES
1. World Health Organization. Obesity: preventing and
managing the global epidemic. Geneva; 2000. (WHO
Technical Report Series, 894).
2. World Health Organization European. Branca F,
Nikogosian H, Lobstein T. The challenge of obesity in the
WHO European Region and the strategies for response;
2007
3. Wang Y, Monteiro C, Popkin BM. Trends of obesity and underweight in older children and adolescents in the
United States, Brazil, China, and Russia. Am J Clin Nutr
2002; 75(6): 971-7.
4. Cole TJ, Bellizzi MC, Flegal KM, Dietz WH. Establishing a standard deinition for child overweight and obesity
worldwide: international survey. BMJ 2000; 6; 320(7244):
1240-3.
5. Barlow SE, Dietz WH. Obesity evaluation and treatment:
Expert Committee recommendations. Pediatrics 1998;
102(3): E29.
6. Mancini M. Obstáculo Diagnóstico e Desaios
Terapêuticos no Paciente Obeso. Arq Bras Endocrinol
7. Moreno LA, Mesana MI, González-Gross M, Gil CM,
Ortega FB, Fleta J, et al. Body fat distribution reference
standards in Spanish adolescents: the AVENA Study. Int J
Obes 2007; 31(12): 1798-805.
8. de Assis MA, Rolland-Cachera MF, Grosseman S, de
Vasconcelos FA, Luna ME, Calvo MC, et al. Obesity,
overweight and thinness in schoolchildren of the city
of Florianópolis, Southern Brazil. Eur J Clin Nutr 2005;
59(9): 1015-21.
9. Casanova M. Prevalência de sobrepeso incluindo
obesidade em escolares entre 6 a 10 anos de idade matriculados no ensino público municipal de Balneário
Camboríu, Santa Catarina, Brasil [dissertação de
mestrado]. Programa de Pós-Graduação em Nutrição: Universidade Federal de Santa Catarina; 2007.
10. Soar C, Vasconcelos F de A, Assis MA. Waist-hip ratio and waist circumference associated with body mass index
in a study with schoolchildren. Cad Saúde Pública 2004;
20(6): 1609-16.
11. Santa Catarina é destaque no desenvolvimento humano. Disponível em http://www.wk.com.br/Noticias/ santa-catarina-e-destaque-no-desenvolvimento-humano/802/ [Acessado em 13 de setembro de 2007].
12. Lohman TG, Roche AF, Martorell R. Anthropometric
Standardization Reference Manual. Champaign, Illinois:
Human Kinetics Books; 1991.
13. Francisco PMSB, Donalisio MR, Barros MBA, César CLG, Carandina L, Goldbaum M. Medidas de associação em estudo transversal com delineamento complexo: razão
de chances e razão de prevalência. Rev Bras Epidemiol
2008; 11(3): 347-55
14. Barbetta P. Estatística aplicada as ciências sociais.
Florianópolis: Editora UFSC; 2006.
15. Instituto Brasileiro de Geograia e Estatística e Pesquisa
de orçamentos familiares 2002-2003. Antropometria e
análise do estado nutricional de crianças e adolescentes
no Brasil. Rio de Janeiro; 2006.
16. Rolland-Cachera MF, Castetbon K, Arnault N, Bellisle F, Romano MC, Lehingue Y,et al. Body mass index in 7-9-y-old French children: frequency of obesity,
overweight and thinness. Int J Obes Relat Metab Disord
2002; 26(12): 1610-6.
17. Apfelbacher CJ, Loerbroks A, Cairns J, Behrendt H, Ring J, Krämer U. Predictors of overweight and obesity in ive to seven-year-old children in Germany: results from
cross-sectional studies. BMC Public Health 2008; 21(8):
171.
18. Moraes SA, Beltrán Rosas J, Mondini L, Freitas IC. Prevalência de sobrepeso e obesidade e fatores associados em escolares de área urbana de
Chilpancingo, Guerrero, México, 2004. Cad Saúde
Pública 2006; 22(6): 1289-301.
19. Ferreira RJ, Marques-Vidal PM. Prevalence and determinants of obesity in children in public schools of
Sintra, Portugal. Obesity 2008; 16(2): 497-500.
20. Vieira MFA, Araújo CLP, Hallal PC, Madruga SW, Neutzling MB, Matijasevich A, et al. Estado nutricional de escolares de 1a a 4a séries do Ensino Fundamental das escolas urbanas da cidade de Pelotas, Rio Grande do
Sul, Brasil. Cad Saúde Pública 2008; 24(7): 1667-74.
21. Oliveira AMA, Cerqueira EMM, Oliveira AC. Prevalência de sobrepeso e obesidade infantil na cidade de Feira de
Santana-BA: detecção na família x diagnóstico clínico. J
pediatr 2003; 79(4): 325-8.
22. Leão L SC S, Araújo LMB, Moraes LTLP, Assis AM. Prevalência de Obesidade em Escolares de Salvador,
Bahia. Arq Bras Endocrinol Metab 2003; 47(2): 151-7.
23. Costa RF, Cintra IP, Fisberg M. Prevalência de Sobrepeso
e Obesidade em Escolares da Cidade de Santos, SP. Arq
Bras Endocrinol Metab 2006; 50(1): 60-7.
24. Brasil LMP, Fisberg M, Maranhão HS. Excesso de peso de escolares em região do Nordeste Brasileiro: contraste
entre as redes de ensino pública e privada. Rev Bras
Saúde Matern Infant 2007; 7 (4): 405-12.
25. Suñé FR, Dias-da-Costa JS, Olinto MT, Pattussi MP. Prevalence of overweight and obesity and associated factors among schoolchildren in a southern Brazilian
city. Cad Saúde Pública 2007; 23(6): 1361-71.
26. Balaban G, Silva GAP, Motta MEFA. Prevalência de sobrepeso e obesidade em escolares de diferentes
classes socioeconômicas em Recife, PE. Pediatria 2001;
23(4): 285-9.
27. Salomons E, Rech CR, Loch MR. Estado nutricional de escolares de seis a dez anos de idade da rede municipal
de ensino de Arapoti, Paraná. Rev Bras Cineantropom
Desempenho Hum 2007; 9(3): 244-9.
28. Reilly JJ. Obesity in childhood and adolescence: evidence based clinical and public health perspectives.
Postgrad MedJ 2006; 82(969): 429-37.
29. Bertoncello C, Cazzaro R, Ferraresso A, Mazzer R, Moretti G. Prevalence of overweight and obesity among school-aged children in urban, rural and mountain
areas of the Veneto Region, Italy. Public Health Nutr
2008; 11(9): 887-90.
30. Joens-Matre RR, Welk GJ, Calabro MA, Russell DW, Nicklay E, Hensley LD. Rural-urban differences in physical activity, physical itness, and overweight
prevalence of children. J Rural Health 2008; 24(1): 49-54.
31. Mondini L, Levy RB, Saldiva SRDM, Venâncio SI, Aguiar Jeanice AA, Setfanini MLR. Prevalência de sobrepeso e fatores associados em crianças ingressantes no ensino fundamental em um município da região metropolitana
de São Paulo, Brasil. Cad Saúde Pública 2007; 23(8):
32. Freedman DS, Serdula MK, Srinivasan SR, Berenson GS. Relation of circumferences and skinfold thicknesses to lipid and insulin concentrations in children and
adolescents: the Bogalusa Heart Study. Am J Clin Nutr
1999; 69(2): 308-17.
33. McCarthy HD, Jarrett KV, Crawley HF. The development of waist circumference percentiles in British children aged 5.0-16.9 y. Eur J Clin Nutr 2001; 55(10): 902-7.
34. de Assis MA, Rolland-Cachera MF, de Vasconcelos FA, Bellisle F, Conde W, Calvo MC, Luna ME, Ireton MJ, Grosseman S. Central adiposity in Brazilian
schoolchildren aged 7-10 years. Br J Nutr 2007; 97(4):
799-805.
35. Sung RY, So HK, Choi KC, Nelson EA, Li AM, Yin JA, Kwok CW, Ng PC, Fok TF. Waist circumference and
waist-to-height ratio of Hong Kong Chinese children. BMC Public
Health 2008; 8: 324.
36. Ashwell M, Hsieh SD. Six reasons why the waist-to-height ratio is a rapid and effective global indicator for the health risks of obesity and how its use could simplify
the international public health message on obesity. Int J
of Food Sci and Nutr 2005; 56: 303–7.
37. Zambon MP, Zanolli ML, Marmo DB, Magna LA, Guimarey LM, Morcillo AM. Correlação entre o índice de massa corporal e a prega cutânea tricipital em crianças
da cidade de Paulínia, São Paulo. Rev Assoc Med Bras
2003; 49(2): 137-40.
38. Quadros TMB, Silva RCR, Pires Neto CS, Gordia AP, Campos W. Predição do índice de massa corporal
em crianças através das dobras cutâneas. Rev Bras
Cineantropom Desempenho Hum 2008;10(3): 243-8.
39. Januário RSB, Nascimento MA, Barazetti LK, Reichert FF, Mantoan JPB; Oliveira AR. Índice de massa corporal e dobras cutâneas como indicadores de obesidade
em escolares de 8 a 10 anos. Rev Bras Cineantropom
Desempenho Hum 2008; 10(3): 266-70.
40. Goran MI, Allison DB, Poehlman ET. Issues relating to normalization of body fat content in men and women.