ISSN: 1809-4430 (on-line) www.engenhariaagricola.org.br
1 Universidade Federal da Grande Dourados - UFGD/ Dourados - MS, Brasil.
3 Universidade Estadual Paulista - UNESP/ Botucatu - SP, Brasil.
Received in: 2-1-2017
Doi:http://dx.doi.org/10.1590/1809-4430-Eng.Agric.v38n2p 180-187/2018
ECONOMIC AND ENERGY VIABILITY OF SUNFLOWER IRRIGATED CROP
Eder P. Gomes
1, Arthur C. Sanches
2*, Edéria P. G. de Azevedo
3, Luciano O. Geisenhoff
1, Rodrigo A. Jordan
12*Corresponding author. Universidade de São Paulo-ESALQ/USP, Piracicaba, Brasil. E-mail: [email protected]
KEYWORDS
Helianthus annuus
L.,
operating cost of
production, energy
depreciation, central
pivot.
ABSTRACT
This study was carried out with the objective of assessing grain yield, economic analysis
and energy balance of three sunflower genotypes with and without irrigation. The
experiment was installed in the Experimental Farm of the Faculty of Agrarian Sciences of
the Federal University of Grande Dourados in the 2011/2012 and 2012/2013 harvests in
Dourados-MS, Brazil. The experimental design used was a random complete block design
with subdivisions, with and without irrigation (plots), with three genotypes (subplots) and
four replications, constituting 24 plots. There were no differences in productivity among
the genotypes. The irrigation increased the operational cost of the sunflower crop
production, but it did not economically obstruct the activity, due to the increase of
productivity of 74.5% and 30% in the harvests of 2011/2012 and 2012/2013. The energy
ratios of the sunflower crop were not altered by irrigation, equal to 5.7 and 8.7 in the
harvests of 2011/2012 and 2012/2013, respectively.
INTRODUCTION
Among the several technologies developed for the sunflower production, the appropriate choice of genotype with h igh grain y ield co mprises the main co mponent of the crop production system (Porto et al., 2007). Despite the tolerance to water deficit when compared to other annual crops, sunflower is sensitive to the availability of water in the soil, increasing grain yield under irrigation (Go mes et al., 2012).
The sunflower culture shows national average productivity of 1500 kg ha-1 (AGRIANUA L, 2012). However, if adequately managed, the productivity may increase to 1500 to 2200 kg ha-1 (Dos Santos et al., 2016; Oliveira et al., 2014; Porto et al., 2007). Under irrigation, grain yield is generally in the range of 2200 to 3000 kg ha -1 (Biscaro et al., 2008; Go mes et al., 2010; Guedes Filho et al., 2015; Schwerz et al., 2015), and can reach more than 4000 kg ha-1 in favorable soil and climatic conditions (Go mes et al., 2010; De Aquino et al., 2013), being able to reach 4.000 kg ha-1 in favorable edaphoclimatic conditions (Karam et al., 2007; Anastasi et al., 2010; Go mes et al., 2012).
Since the adoption of the National Program for the Production and Use of Biodiesel, introduced in 2005, it has been growing the oilseed production in the country, especially in family agricu lture (there are incentives to the overwhelming power plants that buy from this sector); however, different fro m the expectation of diversification,
soybean cultivation continues to predominate (Silva, 2013). W ith technical assistance and structured production chain, sunflower cultivation could become an interesting alternative in the summer harvest, with higher oil productivity (Jasper et al., 2010) and lower production costs in relation to soybean (AGRIANUAL, 2012).
In addition to economic v iability, studies of the energy ratio in different production systems can provide subsidies for the Brazilian agriculture to become increasingly sustainable (Capellesso & Cazella, 2013). The energetic ratio can be obtained by the energy value of the productivity on all the energy expenditures coming fro m the imp lantation of the culture, being an important instrument of technological choice (Assenheimer et al., 2009), avoid ing and replacing the genotypes and productive systems with relation less than one (Albuquerque et al., 2007).
Irrigation is among the technologies that most contributes to the increase of productivity (Lira et al., 2015; Pereira et al., 2015); however, it also increases the input (consumption) of energy in the agricultural system. In this sense, some studies have been carried out over the last years aiming to analyze the energetic ratio of irrigated crops (Go mes et al., 2013, Jordan et al., 2012a; Jordan et al., 2012b).
sunflower genotypes for two years, with and without irrigation, in the region of Dourados, Mato Grosso do Sul, Brazil.
MATERIAL AND MET HODS
The experiment was carried out at the Experimental Farm of the Faculty of Agricultural Sciences - FCA, Federal University of Grande Dourados - UFGD, in Dourados, Mato Grosso do Sul, located at the geographical
coordinates 22o12’ south latitude, 54o56’ west longitude and average altitude of 452 m.
The climate of the region is classified by Köppen as Cwa (hu mid mesothermic with rainy summer). The soil of the experimental area is classified as Red Latosol Distroferric (EMBRAPA, 2006). The values of the chemical analysis of the soil referring to the depth of 0 - 0.20 m are found in Tab le 1.
TABLE 1. Chemical analysis of the soil in the 0 – 0.20 m layer of the experiment with irrigated and non-irrigated sunflower in the years 2011/2012 and 2012/2013.
Experiment
pH (CaCl2) P V H++ A l3+ Al3+ Ca2+ Mg2+ K+
mg d m-3 % --- cmo lc d m-3 ---
2011/2012 5.00 15.20 62.0 5.76 0.08 6.66 2.21 0.53
2012/2013 5.00 11.20 64.5 4.90 0.05 6.59 2.25 0.37
For two years, the experimental area was prepared with plo wing and harrowing, 30 days before sowing, incorporating 1500 kg ha-1 and 1000 kg ha-1 of dolomitic limestone PRNT 80%, respectively, aiming to raise the base saturation by 70% (V). Afterwards, the irrigation system and the tensiometers were installed. In the sowings carried out on October 22nd, 2011 and October 31st, 2012, 150 kg ha-1 of the 8-20-20 formu lation and 1 kg ha-1 of boron in the form of borax were also applied. In the cover fertilization, 40 days after sowing (DAS), 50 kg ha-1 of nitrogen in the form o f urea was also applied.
The same experimental design was utilized in both years: random b locks, in schemes of subdivided plots, with and without irrigation (plots), with three genotypes (subplots) and four repetitions, comp rising 24 plots. The plots were implanted with an area of 36 m2, (15 m x 2.4 m), with four plant rows spaced in 0.60 m and with spacing between plants of 0.2 m. The subplots were implanted with 12 m2 (5 m x 2.4 m). It was utilized genotypes from EMBRA PA: BRS 321, EMBRAPA 122 V2000 and BRS 323.
The irrigation system was assembled using three lines of dripping tapes between the plant rows, with
spacing between the emitters of 0.40 m and drain of 3.65 L h-1 m-1, to 100 kPa of service pressure, obtaining an application intensity of 6.1 mm h-1. The service pressure was maintained by means of a drawer reg ister installed next to a pressure gauge with a resolution of 5 kPa.
Irrigation management was done from tensiometers installed at 0.2 m depth. The irrigation depth (ID) was determined by the difference between volumetric moisture in the field capacity (θcc) and the current volu metric humid ity (θa), mu ltiplied by the effective depth of the root, equal to 400 mm. The volu metric humidity was estimated by means of the soil water retention curve (θa = 0.4394 γ -0.077; R2 = 0.981). It was considered as soil water stress in the field capacity (γcc)the value of 6 kpa. Irrigation was suspended at 90 DAS (R8 stage - back of the yello wish chapter and green bracts).
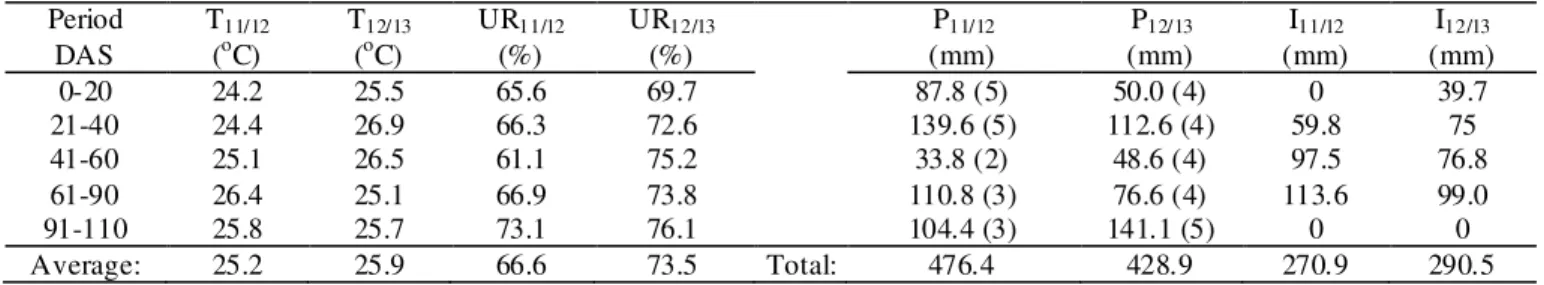
Table 2 shows the values of temperature, relative humid ity, rainfall and irrigation in the experimental periods. Irrigated treatments received 270.9 mm and 290.5 mm of water depth in the first and second year, respectively.
TABLE 2. Temperature (T), relative hu midity (RH), precip itation (P) and irrigation (I) during experimental cycles of sunflower cultivation *.
At the end of the cycles, on February 10th, 2012 and February 18th, 2013, 06 p lants were removed per subplot with the objective of evaluating productivity, correcting seed moisture to 13%. The productivity data were submitted to analysis of variance and Tukey tes t at 5% of probability.
The economic analysis was made based on the total production operating cost (TPO) and the effective operating cost (EOC), using market quotations. In the composition of the EOC it was considered the expenses
with inputs, labor, electric energy in the case of irrigation, tax and revenue expenses. TPO was obtained by adding EOC plus capital depreciation (Martin et al., 1994).
CE
EOR
TOR
MC
CI
EOC
LC
(1)where,
EOC
- effective operating cost, R$ ha-1; CI - cost of inputs, R$ ha-1;Period DAS
T11/12 (oC)
T12/13 (oC)
UR11/12 (%)
UR12/13 (%)
P11/12 (mm)
P12/13 (mm)
I11/12 (mm)
I12/13 (mm)
0-20 24.2 25.5 65.6 69.7 87.8 (5) 50.0 (4) 0 39.7
21-40 24.4 26.9 66.3 72.6 139.6 (5) 112.6 (4) 59.8 75
41-60 25.1 26.5 61.1 75.2 33.8 (2) 48.6 (4) 97.5 76.8
61-90 26.4 25.1 66.9 73.8 110.8 (3) 76.6 (4) 113.6 99.0
91-110 25.8 25.7 73.1 76.1 104.4 (3) 141.1 (5) 0 0
MC - maintenance cost, R$ ha-1;
TOR - tax on revenue, R$ ha-1;
EOR - expenditure on revenue, R$ ha-1; LC - labor cost, R$ ha-1,
CE - cost of electricity, R$ ha-1
CD
EOC
TPO
(2) where,TPO- total production operational cost, R$ ha
-1;EOC
- effective operational cost, R$ ha-1,CD
- capital depreciation, R$ ha-1Because it is a self-propelled system (central pivot simu lation), it was not considered a labor increase due to irrigation. In the region there is still no charge fo r the use of water.
Fro m the applied irrigation depth, the simu lation was based on the power, mechanical efficiency and power factor of the electric motor of a central pivot water pump for 100 ha with flat topography, with electrical power required for pu mping the order of 1.472 kW ha-1, which is considered in the calcu lation of the energy cost. It was also considered an application intensity of 0.43 mm h-1 and maintenance cost (MC) for central pivot estimated at 1.5% per year (Frizzone et al., 2005). The electric power was taxed according to the green horticultural price, adopting the energy prices (EP) established by CERGRA ND (Cooperative of Energizing and Rural Development of Grande Dourados) equal to R$ 0.2103 kWh-1 in the off-peak period with a discount of 80% fro m 9:30p m to 6:00am (R$ 0.0421 kWh-1). The monthly contracted demand rate (CDR), equal to R$ 13.96 kW-1, was converted to R$ 20.55 ha-1 month-1. It was considered a variable watering time for water depth equal to 9 mm, with irrigation time of 21 hours, avoiding peak time (5:30p m to 8:30p m) and obtaining, by weighted average, EP equal to R$ 0.1424 kWh-1. The energy cost was estimated as follows:
CDR
1.472
EP
IT
CE
(3)where,
EP- energy price, R$ kW h-1;
IT - Irrigation time per production cycle, h,
CDR - contracted demand rate (R$ ha-1)
The effective operating profit (EOP), which represents the economic viab ility in the short term, was obtained by the difference between the revenue (REV) and the effective operating cost (EOC):
EOC
REV
EOP
(4) where,EOP
- effective operational p rofit, R$ ha-1,REV
- revenue, R$ ha-1Total operating profit (TOP), wh ich represents long-term economic viab ility, was obtained by the difference between gross revenue (GR) and total production operating cost (TPO):
TPO
REV
TOP
(5) where,TOP
- Total operational profit R$ ha-1Capital depreciation (CD) was calculated using the capital recovery factor method (Tokairin et al., 2014), disregarding the residual value. In the case of irrigated plots, the irrigation system of the Central- Pivot type was considered (being the most used in irrigation of crops in the region), admitting a value of R$ 5500.00 ha-1, according to average practiced price in 2011, using an interest rate (R) of 7.5% per year. For the Central-Pivot, it was used a 20-year life span (n) and use capacity equal to 2000 h year-1 (Frizzone et al., 2005). For the other mach ines and equipment, life values were adopted according to Pacheco (2000).
1
R
1
F
1)
R(R
C
CD
nn
(6)where,
CD
- capital depreciation, R$ ha-1;C
- capital cost acquisition, R$ ha-1; R- annual interest rate, decimal;n
- life span, years,F- ratio between hours of use per cycle and hours per year, decimal
The energy viability analysis was performed using energy relations using the process analysis methodology (Hülsbergen et al., 2001):
UE
EE
ER
(7) where,
ER – energetic relationship, dimensionless;
EE - extracted energy, MJ ha-1,
UE
- utilized energy, MJ ha-1The UE was estimated as follows:
EEL
EML
EI
ED
UE
(8) where,ED- Energy depreciation of equip ment, MJ ha-1;
EI- Energy demand for the use of inputs, MJ ha-1;
EMO - energy employed in manual labor, MJ ha
-1,EEL- energy consumed in the form o f electricity, MJ ha-1
(ED) was estimated as reco mmended by Assenheimer et al. (2009), in the case of non-propelled equip ment (imp lements):
H
n
57.2M
ED
NPE
(9)In the case of the propelled equip ment (tractor and center pivot) the ED was calcu lated as follo ws:
H
n
69.8M
ED
PE
(10)where,
NPE
ED
- energy depreciation of non-propelled equipment, MJ ha-1;PE
ED
- energy depreciation of propelled equipment, MJ ha-1;M- mass of machinery and equipment, kg,
n
- life span, hH – usage time per cycle, h
The mass of machines and equipment was adopted as recommended by Assenheimer et al. (2009) and the life span according to Chechetto et al. (2010). The mass of the central pivot irrigation system, equal to 57.2 kg m-1, was obtained according to information fro m Valmont Industry and Co mmerce Ltd.
RES ULTS AND DISCUSS IONS
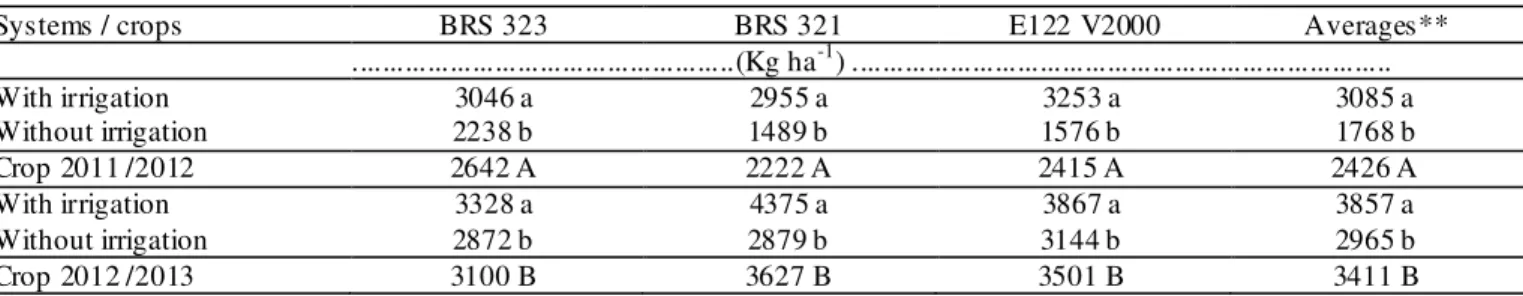
Productivity was affected by irrigation and harvests (P <0.05) independent of the cultivated genotype (P> 0.05). The highest yields were obtained in the 2012/2013 crop (Table 3), probably due to more favorable edaphoclimatic conditions (Tables 1 and 2), such as elevation of base saturation (V), higher temperature and better distribution of rainfall, mainly fro m 41 to 60 DAS (stage R4 - opening of the inflorescence).
The yields of sunflower obtained under irrigation are above the values found by Guedes Filho et al. (2015) and Biscaro et al. (2008), both in second crop cultivation (small harest). In the 2012/2013 harvest, productivity under irrigation approached the mark of 4.000 kg ha-1, surpassed in other surveys conducted in the first harvest (Anastasi et al., 2010, Go mes et al., 2012).
TABLE 3. Productivity of sunflower genotypes* in the 2011/2012 and 2012/2013 harvests with and without irrigation.
Systems / crops BRS 323 BRS 321 E122 V2000 Averages**
...(Kg ha-1) ...
With irrigation 3046 a 2955 a 3253 a 3085 a
Without irrigation 2238 b 1489 b 1576 b 1768 b
Crop 2011 /2012 2642 A 2222 A 2415 A 2426 A
With irrigation 3328 a 4375 a 3867 a 3857 a
Without irrigation 2872 b 2879 b 3144 b 2965 b
Crop 2012 /2013 3100 B 3627 B 3501 B 3411 B
*There weren't significant differences in yield between genotypes.
** Meaningful differences between systems (small letters) and between crops (capital letters).
Considering the irrigation depths applied in the two years of experiment equal to 270.9 mm in 2011/2012 and 290.5 mm in 2012/2013 (Tab le 2), adopting application intensity of 0.43 mm h-1, it was obtained in their respective years the irrigation time (IT) equal to 630 and 676 hours. Applying the equation 03, considering the energy price (EP) of R$ 0.1424 kWh-1 and the contracted demand cost (CDC) equal to R$ 20.55 ha-1 month-1, during the harvests 2011/2012 and 2012/2013 the energy costs (EC) for irrigation was equal to R$ 234.81 ha-1 and R$ 244.45 ha-1, respectively.
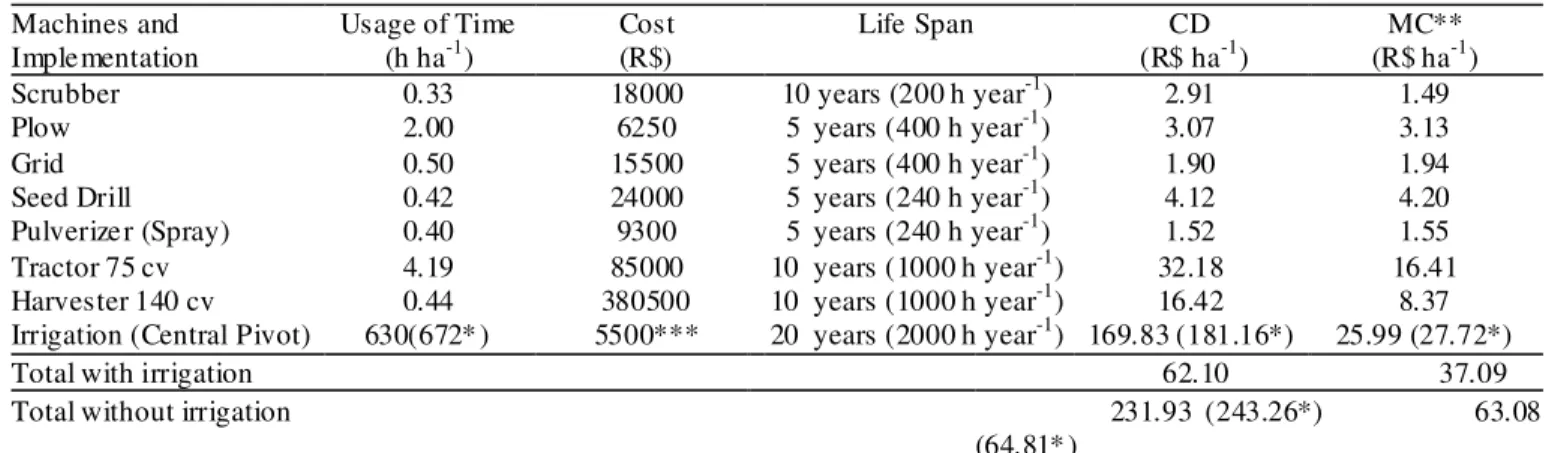
Table 4 shows the prices of the inputs used in sunflower cultivation in the two years of experiment, equal to R$ 619.19 in 2011 and R$ 599.30 in 2012. Tab le 5 shows the capital depreciation of the machinery and implements, equal to R$ 62.10 per year. The used time of the plow and grid was measured at the site. In the treatments that received irrigation, it was also considered the depreciation of the Central- Pivot type system, equals to R$ 169.83 in 2011/2012 and R$ 181.16 in 2012/2013.
TABLE 4. Prices of Input used in the sunflower crops*.
Unit ha-1 Unit price 2011 (R$)
Total price 2011 (R$ ha-1)
Unit price 2012 (R$)
Total price 2012 (R$ ha-1)
Formulated 8-20-20 (kg) 150 1.149 172.35 0.996 149.40
Dolo mitic limestone (kg) 1500 (1000)* 0.083 124.50 0.130 130.00
Urea (kg) 111 1.136 126.10 1.100 122.10
Bórax (kg) 1 4.000 4.00 4.000 4.00
Diesel (L) 60 2.180 130.80 2.180 130.80
Seeds (kg) 4.6 7.500 34.50 7.500 34.50
Desiccant (L) 3 7.100 21.30 7.000 21.00
Inseticide (L) 0.1 56.400 5.64 75.000 7.50
TABLE 5. Capital depreciation and maintenance cost of machines, imp lements and irrigation system.
(*) related to the crop 2012/2013; **[(50% acquisition cost (R$) x usage of time (h ha-1) / life span (h)]; *** cost per hectare
The table 6 shows the average values of productivity (PROD), revenue (REV), tax (TAX) and expenditure on revenue (EOR) for sunflower genotypes, with and without irrigation. The REV was obtained from the prices practiced in the months of February 2012 and 2013, when the sunflower sacks were sold at R$ 47.32 and R$ 55.47, respectively.
TABLE 6. Productivity, inco me, tax and expenses of sunflower cultivation with and without irrigation in the harvests of 2011/2012 and 2012/2013.
Sunflower Genotypes PROD11/12 (kg ha-1)
PROD12/13 (kg ha-1)
REV11/12 (R$ ha-1)
REV12/13 (R$ ha-1)
TAX11/12 (R$ ha-1)
TAX12/13 (R$ ha-1)
EOR11/12 (R$ ha-1)
EOR12/13 (R$ ha-1)
With irrigation 3085(51.4) 3857(64.3) 2432.25 3566.72 55.94 82.03 121.61 178.34
Without irrigation 1768(29.5) 2965(49.4) 1395.94 2740.22 32.11 63.03 69.78 137.01
For the co mposition of the effective operational cost - EOC (Table 07), the labor expense was considered from the work of two emp loyees in the agricultural operations (4.63 hours each, equal to the time used of the tractor plus harvester - Table 05), considering the work hour of each equal to R$ 9.38 (R$ 1500.00 month-1), obtaining R$ 86.81 ha-1. The revenue tax (TAX) and revenue on expenses (EOR) were obtained by applying percentages of 2.3% and 5% of revenues (REC), respectively (equation 01).
TABLE 7. Costs and operating profits fro m sunflower cultivation in the harvests of 2011/2012 and 2012/2013.
Sunflower Genotypes
EOC2011/12 (R$ ha-1)
EOC2012/13 (R$ ha-1)
TPO2011/12 (R$ ha-1)
TPO2012/13 (R$ ha-1)
EOP2011/12 (R$ ha-1)
EOP2012/13 (R$ ha-1)
TOP2011/12 (R$ ha-1)
TOP2012/13 (R$ ha-1)
With irrigation 1181.44 1255.74 1413.37 1499.00 1250.81 2310.98 1018.88 2067.72
Without irrigation 844.98 923.24 907.08 985.34 550.96 1816.98 488.86 1754.88
The irrigation increased the effective operating cost (EOC) of production by 41% and 36% in the 2011/2012 and 2012/2013 harvests, respectively. The increase in total production operational cost (TPO) with irrigation was 56% and 52% in the 2011/2012 and 2012/2013 harvest seasons, respectively. These costs were offset by increased productivity under irrigation, with increases of 127% and 27% for effective operational p rofit (EOP) in the harvests of 2011/2012 and 2012/2013, respectively (equation 04). The total operating profit (TOP) under irrigation obtained an increase of 108% and 18% in the harvests of 2011/2012 and 2012/2013, respectively (equation 05).
These results make feasible the irrigation technique in short (EOP) and long term (TOP). Guedes Filho et al. (2015), conducting the sunflower experiment under irrigation with the genotype EMBRAPA 122/V-2000, reached an average productivity of 2494 kg ha-1 with 100 kg ha-1 de N, and observed viability only in the short term. At the time the value of the bag was R$ 31.80.
At the current conjuncture, it seems unlikely the long term economic inviab ility for irrigated sunflower cultivation, since only the activity would become impracticab le at a price lower than R$ 27.50 a bag, or else (if the price of the bag remains at R$ 50.00) with the productivity less than 30 bags ha-1 (1800 kg ha-1).
The energy used in sunflower cultivation through inputs was 8564.76 and 7964.76 MJ ha-1 (average value as 8265 MJ ha-1), in the harvests of 2011/2012 and 2012/2013, respectively (Table 8), that is, 98.8% of the average energy used (EU) without irrigation (Table 11). Jordan et al. (2012a) also found that inputs were responsible for mo re than 90% of the energy demand in sunflower cultivation without irrigation. In general, inputs are main ly responsible for energy demand in conventional agriculture (Checheto et al., 2010; Go mes et al., 2013). Machines and
Implementation Usage of Time (h ha-1) Cost (R$) Life Span (R$ haCD -1) (R$ haMC** -1)
Scrubber 0.33 18000 10 years (200 h year-1) 2.91 1.49
Plow 2.00 6250 5 years (400 h year-1) 3.07 3.13
Grid 0.50 15500 5 years (400 h year-1) 1.90 1.94
Seed Drill 0.42 24000 5 years (240 h year-1) 4.12 4.20
Pulverizer (Spray) 0.40 9300 5 years (240 h year-1) 1.52 1.55
Tractor 75 cv 4.19 85000 10 years (1000 h year-1) 32.18 16.41
Harvester 140 cv 0.44 380500 10 years (1000 h year-1) 16.42 8.37
Irrigation (Central Pivot) 630(672* ) 5500*** 20 years (2000 h year-1) 169.83 (181.16*) 25.99 (27.72*)
Total with irrigation 62.10 37.09
Total without irrigation 231.93 (243.26*) 63.08
TABLE 8. Energy demanded for the use of inputs (EI) used in sunflower cultivation.
Input Unit Energy Un it (MJ) Quantity (unit ha-1) EI (MJ ha-1)
Nitrogen (N) kg 50.3 62 3118.6
Phosphorum (P2O5) kg 12.6 30 378
Potassium (K2O)
Boron kg kg
6.8 15.35
30 1
204 15.35
Dolo mitic Limestone kg 1.2 1500 (1000*) 1800
Diesel L 35.5 47.7 1693.35
Treated seeds kg 25.1 4.6 115.46
Inseticide L 400 0.1 40
Desiccant L 400 3 1200
Total 8564.76 (7964.76**)
(*) Quantity used in the 2012/2013 harvest; (**) energy by the use of inputs employed in the 2012/2013 harvest.
The average energy used (EU) to produce the sunflower crop without irrigation was 8365 MJ ha-1 (Table 10), with 100.03 MJ consumed in the form of energy depreciation (Table 9), 9 MJ of energy of hand of (EHO). In the estimation of EHO it was considered a daily requirement (8 hours) of 2000 kcal (8.38 MJ), with 4.3 hours of work (the same as mach ine hours), emp loying two employees in agricultural operations.
TABLE 9. Energy depreciation (ED) as a function of the time using machines and equipment used in the cultivation of sunflower in a conventional system.
Machines - implements Mass (kg) Life span (h) Usage of time (h) ED (MJ ha¹)
Pulverizer (Spray) 110 1200 0.4 2.10
Plow 402 2000 2 22.99
Grid 1422 2000 0.5 20.33
Seed Drill 899 1200 0.42 20.02
Cultivator 493 2000 0.54 7.61
Tractor 75 cv 899 10000 3.86 24.22
Harvester 140 cv 899 10000 0.44 2.76
Total 100.03
Table 10 shows the energy consumed by irrigation in the form of electric energy (EEL) and energy depreciation (ED), adding an average energy demand of 3827 MJ ha-1, that is, an increase in consumption Energy consumption of 45.8% due to irrigation, main ly because of electricity.
TABLE 10. Energy spend in the form of electricity (EEL) and energy depreciation (ED) in the irrigation system
Year Irrigation (mm) Time used (h) EEL (kWh ha¹) EEL (MJ ha¹) ED (MJ ha¹)
2011/2012 270.9 630 927.36 3338.50 354.78
2012/2013 290.5 676 994.46 3580.06 380.69
The highest energy ratio was obtained in the 2012/2013 harvest (p <0.05); however, without effect under irrigation (p> 0.05) (Table 11). Contrary behavior was verified by Jordan et al. (2012a), in a study conducted with the sunflower crop, where the energy ratio was lower with irrigation.
TABLE 11. Used energy (UE), extracted energy (EE), energy ratio (ER) with and without irrigation in the sunflower crop.
Genotype UE11/12
(MJ ha¹) (MJ ha¹) EE11/12 ER11/12 (MJ ha¹) UE12/13 (MJ ha¹) EE12/13 ER12/13
With irrigation 12358 77434 6.27 Aa 12026 96811 8.05 Ab
Without irrigation 8665 44377 5.12 Aa 8065 74422 9.23 Ab
Capital letter: among systems; small letter: among crops.
CONCLUS IONS
1. The sunflower genotypes showed similar yields in both years;
2. The cultivation of the irrigated sunflower crop is economically v iable in a short and long term; 3. The irrigation does not alter the energy ratio of the sunflower crop;
REFERENCES
AGRIANUAL (2012): Anuário da Agricultura
Brasileira. São Pau lo: FNP consultoria e co mércio, 546p.
Albuquerque FA, Beltrão NEM, Vale DG (2007) Análise energética do algodoeiro na agricultura familiar em diferentes regiões nos estados do Ceará e Mato Grosso do Sul. Camp ina Grande, EMBRAPA. (Circular Técnica, 116).
Anastasi U, Santonoceto C, Giuffre AM, Sortino O, Abbate V (2010) Yield performance and grain lip id composition of standard and oleic sunflower as affected by water supply. Field Crops Research 119:145–153.
Assenheimer A, Campos AT, Gonçalves Júnior AFC (2009)Análise energética de sistemas de produção de soja convencional e orgânica. A mb iência 5(3):443-455. Biscaro GA, Machado JR, Tosta MS, Mendonça V, Soratto RP, Carvalho LA (2008) Adubação nitrogenada em cobertura no girassol irrigado nas condições de Cassilândia – MS. Ciência e Agrotecnologia 32:1366-1373.
Capellesso AJ, Cazella AA (2013) Indicador de
sustentabilidade dos agroecossistemas: estudo de caso em áreas de cultivo de milho. Ciência Rural 43(12):2297-2303.
Chechetto RG, Siqueira R, Gamero CA (2010) Balanço energético para a produção de biodiesel pela cultura da mamona. Revista Ciência Agronômica 41:546-553. De Aquino LA, Da Silva FDB, Berger PG (2013) Características agronômicas e o estado nutricional de cultivares de girassol irrigado. Revista Brasileira Engenharia Agrícola e A mb iental 17(5):551-557. Dos Santos CAC, Peixoto CP, Vieira EL, Da Silva MR, Bulhões LS, Dos Santos JMDS, De Carvalho EV (2016) Produtividade do girassol sob a ação de bioestimu lante vegetal em d iferentes condições de semeadura no sistema plantio direto. Revista de Ciências Agroamb ientais 14(2):83-91.
EMBRAPA - Empresa Brasileira de Pesquisa
Agropecuária (2006) Sistema b rasileiro de classificação dos solos. Brasília, EMBRAPA. 306p.
Frizzone JA, Andrade Junior AS, Souza JLM, Zocoler JL (2005) Análise de projetos de irrigação. In_. Planejamento de irrigação. Brasília, EMBRAPA.
Go mes EP, Ávila MR, Rickli ME, Petri F, Fedri G (2010) Desenvolvimento e produtividade do girassol sob lâminas de irrigação em semeadura direta na região do Arenito Caiuá, Estado do Paraná. Irriga 15(4):373-385.
Go mes EP, Fred i G, Ávila MR, Biscaro GA, Rezende RK, Jordan RA (2012) Produtividade de grãos, óleo e massa seca de girassol sob diferentes lâminas de irrigação suplementar. Revista Brasileira de Engenharia Agrícola e Ambiental 16(3):237-246.
Go mes EP, Jordan RA, Moto miya A VA , Padua JB, Biscaro GA, Geisenhoff LO (2013) Análise econômica e viabilidade energética da cultura do feijoeiro co mu m sob irrigação. Revista Brasileira de Engenharia Agrícola e Ambiental 17(8):835-842.
Guedes Filho DH, Dos Santos JB, Gheyi HR, Cavalcante LF, Junio r JAS (2015) Co mponentes de produção e rendimento do girassol sob irrigação com águas salinas e adubação nitrogenada. IRRIGA 20(3):514-527.
Hülsbergen KJ, Feil B, Biermann S, Rathke GW , Kalk WD, Diepenbrock WA (2001) Method of energy balancing in crop production and its application in a long-term fertilizer trial. Agriculture Ecosystems and
Environment 86:303-321.
Jasper SP, Biaggioni MAM, Silva PRA (2010)
comparação do custo de produção do crambe co m outras culturas oleaginosas em sistema de plantio d ireto. Revista Energ ia na Agricultura 25:141-153.
Jordan RA, Go mes EP, Biscaro GA (2012a) Impact of irrigation on yield and energy balance of the production of oil and cake of two sunflower varieties. Engenharia Agrícola 38:1048-1057.
Jordan RA, Go mes EP, Biscaro GA, Moto miya A VA , Geisenhoff L (2012b) Impacto energético da irrigação por gotejamento no cultivo de mamona. Pesquisa
Agropecuária Tropical 42:375-382.
Lira RM, Dos Santos AN, Da Silva JS, Barnabé JMC, Da Silva Barros M, Ramalho HA (2015) Utilização de águas de qualidade inferior na agricultura irrigada. Revista Geama 3(1):62-83.
Karam F, Lahoud R, Masaad R, Kabalan R, Breidi J, Chalita C, Rouphael Y (2007) Evapotranspiration, seed yield and water use efficiency of drip irrigated sunflower under full and deficit irrigation conditions. Agricultural Water Management 90:213–223.
Martin NB, Serra R, Antunes JFG, Oliveira MDM, Okawa H (1994) Custos: sistema de custo de produção agrícola. Informações Econômicas 24:97-122.
Melo D, Pereira JO, Souza EG, Gabriel Filho A, Nóbrega LHP, Pinheiro Neto R (2007) Energetic balance of soybean and corn production systems in a farm of the west of Paraná, Brazil. Acta Scientiaru m Agronomy 29:173-178.
Oliveira CR, De Oliveira JL, Barbosa FR, Dario AS, Moura SG, Barros HB (2014) Efeito do nitrogênio em cobertura na produtividade de girassol, no Estado do Tocantins. Científica, 42(3): 233-241.
Pacheco EP (2000) Seleção e custo operacional de máquinas agrícolas. Rio Branco, Emb rapa Acre. 21p. (Docu mentos, 58).
Porto WS, Carvalho CGP, Pinto RJB (2007)
Adaptabilidade e estabilidade como critérios para seleção de genótipos de girassol. Pesquisa Agropecuária Brasileira 42:491-499.
Schwerz T, Jakelaitis A, Teixeira MB, Soares FA, Tavares CJ (2015) Produção de girassol cultivado após soja, milho e capim-marandu, co m e sem irrigação
suplementar. Revista Brasileira Engenharia Agrícola Ambiental 19(5):470-475.
Silva AS (2013) Avaliação do Programa Nacional de Produção e Uso de Biodiesel no Bras il. Revista de Política Agrícola 23:18-31.