A genetic study of traits related to canopy
coverage in common bean
Rafael Storto Nalin
1*, Magno Antonio Patto Ramalho
1and
Bruna Line Carvalho
1Abstract: In this study we aimed to investigate genetic control of the emergence
speed index (ESI) and percentage of canopy coverage (PCC) in plants, and to evaluate whether these traits can be used to identify common bean plants that rapidly provide canopy coverage. Plants from a segregating population and progenies from a cross between a large leaf line and a small leaf line were evaluated. It was observed variability for ESI, however, the low magnitude of heritability indicates that the probability of success from selection is not high. The additive effect was predominant in genetic control of PCC. Nevertheless, this trait is highly affected by the genotype by environment interaction, which makes success from selection even more difficult. The association between ESI and PCC was also low. This information can guide decision making in programs that aim at fast canopy coverage in common bean.
Key words:Plant breeding, Phaseolus vulgaris, weeds, genetic components.
Crop Breeding and Applied Biotechnology
17: 313-319, 2017
Brazilian Society of Plant Breeding. Printed in Brazil http://dx.doi.org/10.1590/1984-70332017v17n4a48 ARTICLE
*Corresponding author:
E-mail: [email protected]
Received: 4 November 2015 Accepted: 4 July 2017
1 Universidade Federal de Lavras (UFLA), De -partamento de Biologia, CP 3037, 37.200-000,
Lavras, MG, Brazil
INTRODUCTION
Several factors affect grain yield in common bean; one of them is competition for resources, such as light, water, and nutrients, between the crop and weeds. Especially during the first 18 days after planting, also known as the Total Period of Interference Prevention (TPIP, Borchartt et al. 2011), yield can decline 80% when weed control is not efficiently applied.
Farmers have requested new cultivars with fast initial growth as a possible means of weed control. It is known that weed growth and development is directly dependent on the resources that are also essential to the crop. Therefore, cultivars that are able to intercept more light tend to mitigate the harmful effects of undesirable weeds, especially when that interception occurs during the TPIP (Hoad et al. 2012).
(Cober and Morrison 2011). Li et al. (2014) also applied this methodology in wheat aiming to detect QTLs associated with seedling emergence vigor. High heritability estimates were obtained for this trait, which indicates the possibility of discriminating contrasting genotypes using the methodology.
In the case of common bean, reports related to phenotypic and genotype parameters estimates of traits associated to canopy coverage are scarce. Maia et al. (2011) found low genetic variation for ESI; however, the opposite was observed for seedling dry matter, which showed high magnitude of broad sense heritability. Also using ESI, Emygdio et al. (2000) observed that there was low variability among the 101 genotypes evaluated, corroborating the results of Maia et al. (2011).
From the cross between two parental lines with contrasting leaf size, segregating populations and progenies were evaluated to verify whether canopy coverage can be evaluated using ESI and/or by estimating PCC using images. We also aimed to estimate variability and to verify if selection is practicable for these traits based on phenotypic and genetic parameter estimates.
MATERIAL AND METHODS
The experiments were carried out in the experimental area of the Department of Biology of the Universidade Federal de Lavras (UFLA) (lat 21º 58’ S, long 42º 22’ W, and alt 918 m asl), which is located in the south of the state of Minas Gerais, Brazil.
Two groups of experiments were carried out. The first evaluated individual plants from some populations; and the second evaluated progenies. These populations and progenies used for estimating phenotypic and genetic parameters arose from the cross between the lines Pérola (P1 – male parent) and ESAL 686 (P2 – female parent). P1 is of Mesoamerican
origin and has small “carioca” type grains, indeterminate growth, semi-upright growth habit, and medium-size leaves. In contrast, P2 belongs to the Andean genepool, Nova Granada race, and has determinate growth, upright growth habit,
large yellow grains, and large leaves.
The first group of experiments was carried out in the field over two growing seasons using a randomized complete block design, with two replications. In the first season, the crop was sown in July 2013, and the parents and the F1, F2,
F3, F1BC11, F1BC21, F2BC11, and F2BC21 generations were evaluated. In the second season, the crop was sown in November
2013, and the parents and the F1, F2, F3, and F4 generations were evaluated. For these experiments, the percentage of
canopy coverage (PCC) of individual plants was assessed.
The second group of experiments was also carried out over two growing seasons, February and July 2014, using a simple lattice design 10x10, i.e., 94 progenies and six controls (the two parents and four varieties – Small White, BRSMG Majestoso, RP1, and BRS Radiante). In the first season, 32 F2:3, 30 F3:4, and 32 F4:5 progenies were evaluated and in the
following season, the F2:4, F3:5, and F4:6 progenies. Plots were spaced at 60 cm and each plot consisted of one row with 10 plant holes. Three seeds were sown per hole. Holes within plots were spaced at a distance of 20 cm. Plants were thinned ten days after emergence to leave a single plant per hole. The length of coverage of the camera image to obtain PCC in each plot was 80 cm.
Another experiment was carried out in a greenhouse at the same time as the latter growing season using the same treatments, but plants were sown in trays. The aim of the experiment was to obtain estimates of emergence rate under more uniform conditions. A lattice design with four replications was adopted.
in Photoshop CS5® to calculate the percentage of area covered by plants. This proportion was calculated by the ratio between green pixels and total pixels of the image.
Emergence speed index (ESI) was estimated in the experiment assessing individual plants, sown in November 2013, and in the experiments involving progenies. The number of emerged seedlings was counted every day, and the ESI was estimated based on the following equation:
ESI =
Σ
(
Gi/
T
t
)
where Gi is the number of emerged plants on the day of counting, and Tt is the counting day.
After obtaining the mean values and variances of plants per plot, the genetic components of mean and variance was calculated based on the procedure proposed by Mather and Jinks (1984) and described by Ramalho et al. (2012), which uses the weighted least square method for estimating these parameters.
To estimate ESI in the second experiment involving segregating progenies, we used the model below to obtain the mean components; we did not consider the weighted variance matrix because ESI was evaluated for each generation instead of at the individual level.
ϐˆ = (CʹC)–1(CʹY)
where ϐˆ is the parameter estimate vector; C refers to the model matrix; and Y is the vector of population means.
Epistasis was included in the model matrix.
In the case of the PCC mean components, the following model was used: ϐˆ = (CʹNS–1C)–1(CʹNS–1Y), where ϐˆ is
the vector of parameter estimates; C refers to the matrix model; N refers to the number of plants evaluated in each population; S refers to the variance of plants in each population; and Y is the vector of means for evaluated populations.
The following model was adopted to obtain the PCC variance components: ϐˆ = (CʹW–1C)–1(CʹW–1Y), where W refers to
the diagonal matrix of weights in which the elements on the diagonal are composed of the inverse of the variance of observed variances, and Y is the variance vector of plants in each population.
Analysis of variance (ANOVA) was performed on the experimental data of the segregating populations at the growing season and combined level. Because ANOVA assumptions were not fulfilled, data were transformed into arc sine X for
the PCC trait and X for the ESI trait. Variances associated with each source were obtained based on the expectation
of Mean Squares (MS). These estimations were used to calculate broad sense heritability (Ramalho et al. 2012). Errors associated with estimates were obtained by the formula provided by Knapp et al. (1985).
The gain expected from selection was obtained from the follow estimator: GS = h2ds, where h2 is the heritability
estimate and ds is the differential of selection based on differences between the mean of the progenies selected and
the overall mean. The error associated with GS was calculated using the formula provided by Bridges et al. (1991). The realized heritability (h2
R) was calculated based on selection of progenies in one season and response in the
following season. The follow formula described by Ramalho et al. (2012) was used: h2
R =
Msj –Moj Moj Msi –Moi
Moi
, where Ms
i is the
mean of the best 10% of progenies in season i; Mo
i is the overall mean of progenies observed in season i; Msj is the mean of the best 10% of progenies selected in season i in season j; and Mo
j is the overall mean of progenies in season j.
RESULTS AND DISCUSSION
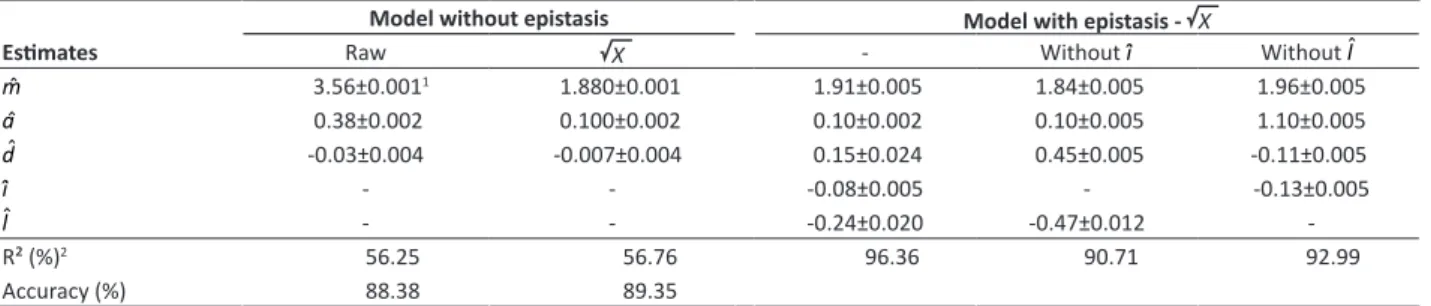
Accuracy in PCC analysis for population evaluation using data from individual plants was high (89.4%), indicating low error in obtaining the means (Table 1). Estimating the genetic mean components, we found that the additive-dominant model could not explain most of the variation. The model explained almost all data variation through additive-additive (i) and dominant-dominant (l) epistasis (Table 1).
some articles in the literature, authors have used ESI to measure the initial development of seedlings in several important crops, for example, wheat (Zareian et al. 2013), soybean (Rezapour et al. 2013), common bean (Maia et al. 2011), corn (Van de Venter and Hoffman 1988, Sathish et al. 2011), and others. However, reports regarding genetic control for this trait were not found.
The accuracy of assessing progenies for ESI under field conditions is questionable as there is irregularity in the depth of the sowing furrow, depending on variations in the soil surface and the implement used. This variation may have contributed to a medium accuracy estimate (rggʹ = 77.4%, Table 2).
To verify the reliability of the ESI estimates, the same progenies were evaluated in greenhouse trails. In this case, genetic variability was also detected and the accuracy was even higher than that observed in the field experiments (rggʹ = 90.0%). The most important information is the high association between the means of both experiments, i.e., field and greenhouse (r = 0.94). This indicates that although accuracy in the field was not very high, the ranking of the progenies was very similar under both conditions.
Significant differences between the growing seasons were also observed for ESI evaluated in the field, because the February season had a 9.3% higher mean than the July season (Table 3). This is due to climate conditions favorable to
Table 1. Mean component estimates of additive (aˆ), dominance (dˆ), additive-additive epistasis (ˆi) and dominant-dominant epistasis
(lˆ) of ESI using raw and transformed data for X
Model without epistasis Model with epistasis - X
Estimates Raw X - Without ˆi Without lˆ
mˆ 3.56±0.0011 1.880±0.001 1.91±0.005 1.84±0.005 1.96±0.005
aˆ 0.38±0.002 0.100±0.002 0.10±0.002 0.10±0.005 1.10±0.005
dˆ -0.03±0.004 -0.007±0.004 0.15±0.024 0.45±0.005 -0.11±0.005
i
ˆ - - -0.08±0.005 - -0.13±0.005
l
ˆ - - -0.24±0.020 -0.47±0.012
-R² (%)2 56.25 56.76 96.36 90.71 92.99 Accuracy (%) 88.38 89.35
1 Standard error associated to estimates; 2 Model determination coefficient.
Table 2. Summary of the joint analysis of variance for PCC (data transformed to arc sin X ) and ESI (data transformed to X )
Sources df PCC ESI
MS p-value MS p-value
Season (S) 1 688.46 0.00 3.35 0.00
Treatments (T) 99 17.95 0.07 0.13 0.00
Among prog. (P) 93 18.18 0.08 0.13 0.00
Among prog. F2 31 13.46 0.41 0.10 0.01
Among prog. F3 29 23.93 0.20 0.11 0.05
Among prog. F4 31 18.33 0.08 0.19 0.00
Among prog. types 2 5.73 0.70 0.01 0.82
Among controls (Crtl) 5 16.95 0.28 0.10 0.20
P vs Crtl 1 1.10 0.77 0.07 0.06
T x S 99 13.30 0.01 0.05 0.08
P x S 93 13.55 0.01 0.05 0.07
Progenies F2 x S 31 12.34 0.12 0.04 0.37
Progenies F3 x S 29 17.37 0.01 0.06 0.07
Progenies F4 x S 31 11.07 0.22 0.06 0.09
Among prog. types x S 2 13.55 0.23 0.05 0.28
Ctrl x S 5 9.68 0.39 0.04 0.36
P vs Crtl x S 1 7.53 0.37 0.00 0.90
Mean Error 252 9.23 0.04
germination in February and to warmer temperatures in February than in the July season.
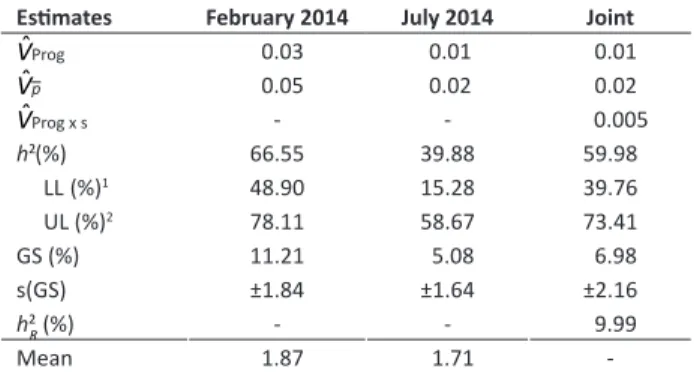
The ESI heritability estimate was moderate for selection in progenies mean under field conditions. The combined average of seasons was 59.9%. It is noteworthy that even though the progeny by season interaction was not significant for the trait, the realized heritability considering selection in one season and response in the next season was very low (h2
R = 9.9%; Table 3). It is clear that although this trait is
easy to evaluate, it has low precision, especially under field conditions, with low repeatability in successive generations. Thus this trait can be difficult to include in a breeding program that aims at obtaining cultivars with fast canopy coverage and high weed competition power.
To assess plant growth and development, dry matter was measured about 15 days after sowing (Maia et al. 2011). However, dry matter does not directly reflect canopy coverage, which determines the amount of light incidence on the soil surface and, consequently, weed development. For that reason, we choose to estimate the PCC by plants or progenies using images.
It should be noted that the PCC evaluation method must be accurate so as to be able to detect real differences among the genotypes, show repeatability, and be quick and easy to use, thus allowing it to be implemented in evaluating hundreds of plants and/or progenies, which is the reality of most breeding programs.
When individual plants of the segregating populations were evaluated, the accuracy estimates for that trait were as high as 87% (Table 4), indicating very good experimental precision and efficiency of the methodology. It is noteworthy that in the literature, we did not find any report of use of images to evaluate canopy coverage for the common bean crop.
Estimates of mean components for PCC did not coincide
for the two seasons (Table 4). In one of them, the estimated a effect was prevalent, and for the other, the d effect.
The environmental effect probably affected allelic expression. Few reports about it have been published. According to Hamblin and Morton (1977), dominance tends to be expressed with greater intensity under more favorable environmental conditions. However, estimates of genetic component variances coincided under both conditions, and additive variance explained most of the variation observed (Table 5). In obtaining estimates of component variance for PCC based on individual information, the additive-dominant model without epistasis explained most of the variation, i.e., R² was as high as 98%, indicating that epistasis was not substantial in genetic control of PCC.
Due to the low estimative of accuracy when evaluating the PCC of progenies, lower than 55% (Table 2), we can infer that the experiment showed low precision based on the criteria of Resende and Duarte (2007). This can be attributed to the low magnitude of genetic variation of the progenies. The medium significance of the F test for this source of variation (P ≤ 0.08) corroborates this. The contrast that evaluates the difference between the parents was not significant (P ≥ 0.7), indicating that although the parents were markedly different in regards to leaf size, the PCC was similar for both parents. It is expected that plants with small leaves have a greater number of leaves, which could be contributing
Table 3. Phenotypic (Vˆp), Genetic (VˆProg) and Genotypic x
Environment (VˆProg x s) variance component estimates, heritability (h²) and realized heritability (h2
R) for ESI. Data transformed to X
Estimates February 2014 July 2014 Joint
VˆProg 0.03 0.01 0.01
Vˆp 0.05 0.02 0.02
VˆProg x s - - 0.005
h2 (%) 66.55 39.88 59.98
LL (%)1 48.90 15.28 39.76
UL (%)2 78.11 58.67 73.41
GS (%) 11.21 5.08 6.98
s(GS) ±1.84 ±1.64 ±2.16
h2
R (%) - - 9.99
Mean 1.87 1.71
-1 Lower limit of heritability confidence interval; 2 Upper limit of heritability confi
-dence interval.
Table 4. Mean component estimates of additive (aˆ) and domi
-nance (dˆ) of PCC (data transformed to arc sin X )
Estimates July 2013 November 2013
mˆ 15.21±0.211 22.75±0.25
aˆ 2.04±0.25 1.56±0.58
dˆ 0.27±0.53 3.86±0.74
R² (%)2 98.89 99.95
Accuracy (%) 91.78 87.60
1 Standard errors associated to estimates; 2 Model determination coefficient.
Table 5. Environmental variance component estimate, (Vˆ E),
additive genetic variance (VˆA), dominance variance (VˆD) and
narrow sense heritability (h2
n) of PCC for experiments sowed in
July and November of 2013. Data transformed to arc sin X.
Estimates July 2013 November 2013
VˆE 5.05±1.051 13.15±2.67
VˆA 3.74±1.03 6.17±1.80
VˆD -0.70±1.56 -1.01±0.16
2 R² (%) 99.22 99.26
h2n (%) 42.57 31.95
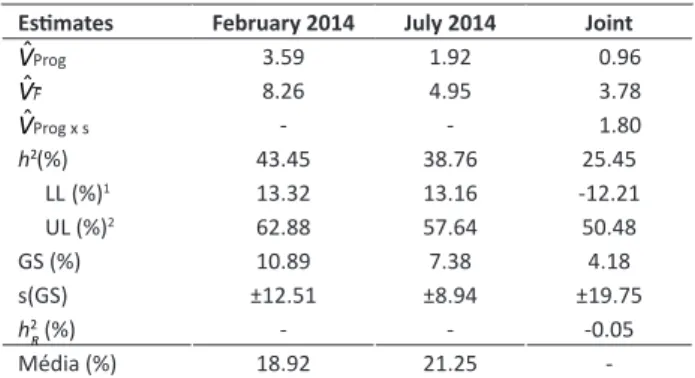
to the PCC shown by both parents, regardless of leaf size. In contrast to ESI, the variance of the progeny by season interaction of PCC was significant, and the variance component of interaction was 1.87 times higher than the genetic variance among progenies (Table 6). We can infer that progeny performance did not coincide in the two seasons (Ramalho et al. 2012). This may have contributed to the low magnitude of the h2 estimate at the mean level
of progenies. Contrary to expectations, the value was below that reported for h2 on the individual level.
Depending on the magnitude of the progeny by season interaction, the realized heritability from selection in one season and response in the following season was null (Table 6). The estimate of expected gain based on selection in the average of the seasons was 4.3%, although the associated error was higher than the estimate itself. It appeared that the PCC trait is difficult to select because the progenies
selected in one season may not be the best ones in the next season. The genetic correlation between PCC and ESI was positive; however, it was of low magnitude (0.37), indicating that these traits, in contrast to what was expected, were not associated.
Despite the importance of this trait, especially in suppressing weed development in the field, breeding for it proved to be very difficult, because of the considerable influence of the genotype by environment interaction. However, the use of images proved to be very efficient in discriminating genotypes. Thus, the information presented in this study could be useful for common bean breeders who aim to select genotypes for fast canopy coverage and, consequently, provide cultivars that are more adapted to farmers’ growing systems.
ACKNOWLEDGMENTS
We thank the Coordenação de Aperfeiçoamento de Pessoal de Nível Superior (CAPES) and the Conselho Nacional de Desenvolvimento Científico e Tecnológico (CNPq) for financial support and granting scholarships.
Table 6.Phenotypic (VˆF), Genetic (VˆProg) and Genotype x Envi
-ronment interaction (VˆProg x s) variance components estimates,
heritability (h²) and realized heritability (h2
R) of PCC. Data trans
-formed to arc sin X
Estimates February 2014 July 2014 Joint
VˆProg 3.59 1.92 0.96
VˆF 8.26 4.95 3.78
VˆProg x s - - 1.80
h2 (%) 43.45 38.76 25.45
LL (%)1 13.32 13.16 -12.21
UL (%)2 62.88 57.64 50.48
GS (%) 10.89 7.38 4.18
s(GS) ±12.51 ±8.94 ±19.75
h2R (%) - - -0.05
Média (%) 18.92 21.25
-1 Lower limit of heritability confidence interval; 2 Upper limit of heritability confi
-dence interval.
REFERENCES
Borchartt L, Jakelaitis A, Valadão FCA, Venturoso LAC and Santos CL (2011) Períodos de interferência de plantas daninhas na cultura do feijoeiro-comum (Phaseolus vulgaris). Revista Ciência Agronômica
42: 725-734.
Bridges WC, Knapp SJ and Cornelius PL (1991) Standard errors and confidence interval estimators for expected selection response. Crop
Science31: 253-255.
Cober ER and Morrison MJ (2011) Short-season soybean genetic improvement evaluated in weed-free and weedy conditions. Crop
Science51: 2582-2588.
Emygdio BM, Lobato LAO, Antunes IF and Silveira EP (2000) Variabilidade genética para velocidade de germinação em sementes de feijão
(Phaseolus vulgaris L.). Pesquisa Agropecuária Gaúcha6: 77-82.
Hamblin J and Morton JR (1977) Genetic interpretations of the effects of bulk breeding on four populations of beans (Phaseolus vulgaris
L.). Euphytica26: 75-83.
Hoad SP, Bertholdsson N-O, Neuhoff D and Köpke U (2012) Approaches to breed for improved weed suppression in organically grown cereals. In van Bueren ETL and Myers JR (eds) Organic crop breeding.
Wiley-Blackwell, Oxford, p. 61-76.
Knapp SJ, Stroup WW and Ross WM (1985) Exact confidence intervals for heritability on a progeny mean basis. Crop Science 25: 192-194.
Li X-M, Chen X-M, Xiao Y-G, Xia XC, Wang DS, He ZH and Wang HJ (2014) Identification of QTLs for seedling vigor in winter wheat. Euphytica
198: 199-209.
Maia LGS, Silva CA, Ramalho MAP and Abreu AFB (2011) Variabilidade genética associada à germinação e vigor de sementes de linhagens de feijoeiro comum. Ciência e Agrotecnologia35: 361-367.
Mather K and Jinks JL (1984) Introduçao à genética biométrica. Sociedade Brasileira de Genética, Ribeirão Preto, 242p.
Ramalho MAP, Abreu AFB, Santos JB and Nunes JAR (2012) Aplicações
da genética quantitativa no melhoramento de plantas autógamas. Editora UFLA, Lavras, 522p.
Resende MDV and Duarte JB (2007) Precisão e controle de qualidade em experimentos de avaliação de cultivares. Pesquisa Agropecuária
Tropical37: 182-194.
Rezapour R, Kazemi-arbat H, Yarnia M and Zafarani-Moattar P (2013) Effect of seed size on germination and seed vigor of two soybean (Glycine max L.) cultivars. International Research Journal of Applied
and Basic Sciences4: 3396-3401.
Sathish S, Sundareswaran S and Ganesan N (2011) Influence of seed priming on physiological performance of fresh and aged seeds on maize hybrid [COH(M) 5] and it’s parental lines. Journal of
Agricultural and Biological Science6: 12-17.
Van de Venter H and Hoffman R (1988) Germination rate of maize (Zea mays L.) kernels. I. Relationships with kernel properties and water
uptake. South African Journal of Plant and Soil5: 189-192.