BJRS
OF
RADIATION SCIENCES
07-02A (2019) 01-11 ISSN: 2319-0612 Accept Submission: 2018-10-31Validation of new gas chromatography-flame ionization
detection procedure for quantitation of residual solvents
in [
18F]FDG
F. M. Costa; C. L. S. Costa; J. B. Silva; S. M. Z. M. D. Ferreira
Centro de Desenvolvimento da Tecnologia Nuclear, CDTN,31270-901, Belo Horizonte - MG, Brazil. [email protected]
ABSTRACT
Fludeoxyglucose F 18 ([18F]FDG) is the most used radiopharmaceutical for positron emission tomography worldwide,
especially on oncology. Organic solvents such as ether, ethanol and acetonitrile might be used in the synthesis of
[18F]FDG; however, they might not be completely removed during purification steps. The determination of residual
solvents in [18F]FDG is required in the European Pharmacopoeia (EP) and the United States Pharmacopeia (USP)
monographs. While the procedure described in the EP is quite general, the one described in the USP requires a long runtime (about 13 minutes). In this work a simple and fast (4-minute) analytical procedure was developed and validated
for determination of residual solvents in [18F]FDG. All analyses were carried out by gas chromatography – flame
ionization detector (GC-FID). The separation was obtained on a 0.53-mm x 30 m fused-silica column. Validation included the evaluation of various parameters, such as: specificity, linearity and range, limits of detection and quantitation, precision (repeatability and intermediate precision), accuracy, and robustness. Results were found to be within acceptable limits, indicating the developed procedure is suitable for its intended application. Considering the short half-life of fluorine-18 (109.7 minutes), this new procedure could be a valuable alternative for routine quality
control of [18F]FDG.
Costa, et. Al. ● Braz. J. Rad. Sci. ● 2019 2
1. INTRODUCTION
Positron emission tomography (PET) is an important medical imaging technique that uses compounds labeled with positron-emitting radioisotopes as molecular probes to image and measure biological processes at the molecular or cellular level in vivo. Fludeoxyglucose F 18 ([18F]FDG) is the most commercially successful and widely employed tracer (radiopharmaceutical) used for PET, especially on oncology [1,2].
[18F]FDG is a glucose analogue in which the hydroxyl group on the 2–carbon of a glucose molecule
was replaced by a fluoride atom. The synthesis of [18F]FDG is mostly performed by bimolecular nucleophilic substitution reaction followed by hydrolysis. After purification steps [18F]FDG is obtained as an injectable aqueous preparation [3]. Organic solvents such as ether, ethanol and acetonitrile might be used in the synthesis of [18F]FDG; however, they might not be completely removed during purification steps. As a result, the amount of residual solvents in the final product has to be determined through quality control, since the permitted levels of some organic solvents are strictly limited [4].
The quality requirements of [18F]FDG are set out in official compendia, such as the European Paharmacopoeia (EP) [5] and the United States Pharmacopeia (USP) [6]. The determination of residual solvents is required in [18F]FDG monographs of both pharmacopeias. The procedure
described in the EP is quite general while the one described in the USP requires a long runtime, which takes about 13 minutes.
The limited time available for the quality control is an important feature which has to be taken into consideration. Due to the short half-life of fluorine-18 (109.7 minutes), runtime is critical.
The aim of this work was to validate a new and fast gas chromatographic procedure for analysis of residual solvents in [18F]FDG. Validation included the evaluation of the specificity, linearity and range, limits of detection (LOD) and quantitation (LOQ), precision (repeatability and intermediate precision), accuracy and robustness of the procedure in accordance with international guidelines.
2. MATERIALS AND METHODS
Ethanol and acetonitrile reference standards were purchased from the USP (Rockville, USA). Di-ethyl ether for analysis EMSURE® was acquired from Merck (Darmstadt, Germany). Purified
water was obtained from Milli-Q system (Millipore, model ElixRiOs, USA). Reagents kits and
cassetes for the synthesis of [18F]FDG werepurchased from ABX (Radeberg, Germany).
2.2 Chromatographic conditions
The Clarus 580 gas chromatograph (Perkin Elmer, USA) equipped with a flame ionization detector and an autosampler was used in this work. Data acquisition and processing were performed using the TotalChrom software. A 0.25-mm x 30-m fused-silica column coated with a 0.5-µm, chemically cross-linked polyethyleneglycol was used as the stationary phase. The gas chromatographic system was operated under the following conditions: the injection port was configured for split sample injection at a split ratio of 20:1, and operated at 250°C. Oven temperature: 40°C for 1 min, 40°C/min to 100°C, and 100ºC for 1 min. The injection volume was set to 1.0 µL. Helium was used as the carrier gas, and adjusted to provide a column flow rate of 2.0 mL/min. Detector temperature was kept at 300°C, hydrogen flow rate and air flow rate were set to 30 mL/min and 300 mL/min, respectively.
2.3 Preparation of standard solutions and sample
Separate aqueous stock solutions of ether, ethanol and acetonitrile were prepared at concentrations of 1.2% w/v, 1.2% w/v, and 0.1% w/v, respectively. From individual stock standard solutions, working solutions were prepared by making dilutions in water. [18F]FDG was synthesized in a TRACERlab MXFDG module (GE, USA) with a disposable ready-for-use cassette and reagent kit
and used without further treatment. For recovery assessment, [18F]FDG samples were spiked with
reference standards or diluted with purified water. All solutions were stored at 2-8°C and brought to room temperature before use.
2.4 Validation of the analytical procedure
Several parameters were taken into account and evaluated for the in-house validation of the procedure, namely: specificity, linearity and range, LOD and LOQ, precision (repeatability and
Costa, et. Al. ● Braz. J. Rad. Sci. ● 2019 4
intermediate precision), accuracy, and robustness. In this study the validation was conducted according to the International Council for Harmonization of Technical Requirements for Pharmaceuticals for Human Use (ICH) guideline, the USP, and the National Institute of Metrology, Quality and Technology (INMETRO) recommendations [4, 6, 7].
Specificity of the procedure was assessed by comparing the chromatographic profiles of the standard solution of 0.1% w/v ether, 0.1% w/v ethanol and 0.01% w/v acetonitrile in relation to that
obtained for [18F]FDG sample spiked with these solvents at the same concentration level. Retention
times of the analytes and resolution between peaks were statistically evaluated. The homogeneity of variances was confirmed using the F-Snedecor test. The averages were compared using the Student’s t-test at 95% confidence level.
In order to evaluate linearity, calibration curves were prepared for ether, ethanol and acetonitrile in the concentration range of 0.0005-0.6% w/v, 0.0005-0.6% w/v and 0.0005-0.05% w/v, respectively, considering the limits established for each solvent in [18F]FDG monograph [6]. The curves were obtained from six different concentrations analyzed in triplicate. Regression of the calibration curves was performed using the weighted least squares method (WLSM), after applying the following tests for the residuals assumptions: normality (Ryan–Joiner test), homoscedasticity (Brown–Forsythe test) and independency (Durbin–Watson test). For the model assumption, the lack-of-fit test (ANOVA) was used [8]. The range of the analytical procedure was defined as the interval between the upper and lower concentration of the solvents for which a suitable level of precision, accuracy and linearity was demonstrated.
LOD and LOQ were calculated based on the standard deviation (SD) of the y-intercept of regression line and the slope of the regression line. The LOD and the LOQ were calculated according to the equations 1 and 2, respectively.
𝐿𝑂𝐷 = 𝑆𝐷 . 3.3
𝑠𝑙𝑜𝑝𝑒 (1)
𝐿𝑂𝑄 = 𝑆𝐷 .10
𝑠𝑙𝑜𝑝𝑒 (2)
Precision was assessed by repeatability and intermediate precision. Repeatability was verified by injecting six times the standard solution of 0.1% w/v ether, 0.1% w/v ethanol and 0.01% w/v acetonitrile, under the same operating conditions over a short interval of time. The intermediate
precision was determined by repeating the repeatability experiment on two different days and by two technicians.
Accuracy was verified by the standard addition method. A sample of [18F]FDG was spiked with
known amounts of ether, ethanol and acetonitrile at three concentrations levels (low, medium and high) covering the range of the procedure. Recovery experiments were performed in triplicate for each concentration level.
Robustness was evaluated by injecting the standard solution of 0.1% w/v ether, 0.1% w/v ethanol and 0.01% w/v acetonitrile under deliberate variations on carrier gas flow (1.5 and 2.5 mL/min) and split (15 and 25). Results were compared using the F-Snedocor test; the homogeneity of variances was confirmed.
3. RESULTS AND DISCUSSION
Validation was performed to confirm the suitability of the procedure for its intended use and compliance with the ICH Q2(R1) guideline, Chapter <1225> of the USP, and DOQ-CGCRE-008 of
the INMETRO [4, 6, 7]. According to [18F]FDG monograph [4], the concentration limits for ether,
ethanol and acetonitrile are 0.5% w/v, 0.5% w/v and 0.04% w/v, respectively. The validation study was performed considering this information.
Specificity results are presented in Table 1. No statistically significant difference was found
be-tween the standard solution and [18F]FDG samples spiked with solvents at the same concentration
level, with respect to retention time and resolution. In this case, the aqueous analytical curve could be applied for all analytes.
Table 1: Specificity results Retention time (mean ± SD)
Analyte Standard Spiked [18F]FDG Ether 1.34 + 0.00 1.34 + 0.00 Ethanol 2.13 + 0.00 2.13 + 0.01 Acetonitrile 2.39 + 0.00 2.39 + 0.00 Resolution (mean + SD)
Adjacent peaks Standard Spiked
[18F]FDG
Ether/Ethanol 18.29 + 1.62 17.94 + 0.92 Ethanol
BJRS
BRAZILIAN JOURNAL
OF
RADIATION SCIENCES
07-02A (2019) 01-11 ISSN: 2319-0612 Accept Submission: 2018-10-31In addition, the chromatogram obtained for the standard solution of 0.1% w/v ether, 0.1% w/v ethanol and 0.01% w/v acetonitrile was compared with that obtained for [18F]FDG spiked with
solvents at the same level, as illustrated in Fig. 1A and 1B, respectively. Both chromatograms showed similar profiles and well separated peaks; indicating the high specificity of the procedure.
Figure 1: Typical GC chromatograms of (A) standard solution of ether, ethanol and acetonitrile
Calibration curves for ether, ethanol and acetonitrile were constructed by plotting the peak area versus concentration for linearity assessment, considering six concentration levels and three
independent replicates. Replicates of each calibration point providedinformation about the inherent
variability of the response measurements (pure error).The first step was the outlier treatment: the visual inspection of the residual plot; investigation and deletion of outliers by the Jacknife standardized residuals test. The assumption that the residuals were normally distributed was confirmed. Residuals were statistically independent, demonstrating that no autocorrelation was observed. The residual variability across all concentration levels was significantly different, indicating heteroscedasticity; suggesting that the calibration data are best treated by the WLSM.
R es p on se [ m V ]
Ether Ethanol Acetonitrile
Time [min] R es p on se [ m V ]
Ether Ethanol Acetonitrile
Time [min] A
B
Costa, et. Al. ● Braz. J. Rad. Sci. ● 2019 8
The developed procedure was found to be linear over the concentration range. A non-significant lack-of-fit indicated that there appears to be no reason to doubt the adequacy of the linear model. The peak area versus concentration plots and the respective WLSM statistics are presented in Fig. 2. It could be observed that correlation coefficients values were higher than 0.99.
Figure 2: Calibration curve of (A) ether, (B) ethanol and (C) acetonitrile (n=3).
LOD and LOQ were determined by considering the standard analytical curves of linearity, according to the equations 1 and 2. The standard deviation of the y-intercept of regression lines and the slope of the regression line are shown in Fig. 2. The LOD were calculated for ether, ethanol and acetonitrile and found to be 0.00007% w/v, 0.00004% w/v, and 0.00008% w/v, respectively. The LOQ for ether, ethanol and acetonitrile were found to be 0.00020% w/v, 0.00014% w/v, and
0.00025% w/v,respectively.
Results of repeatability and intermediate precision are shown in Table 2. The % RSD values were lower than 3.7% for repeatability and intermediate precision, indicating the high precision of the
developed procedure [7]. The averages (day 1 and day 2) were compared using the Student’s t-test
at 95% confidence level. No statistically significant difference was found.
Table 2: Precision (repeatability and intermediate precision) results
Ether Ethanol Acetonitrile
Mean peak area (Repeatability) (n = 6) 148.25 151.06 20.07
% RSD (Repeatability) 1.64 1.18 1.24 y = (1,616.6 + 17.3)x + (0.054 + 0.033) R = 0.9920 0 250 500 750 1000 0.0 0.1 0.2 0.3 0.4 0.5 0.6 Peak are a Concentration (% w/v) y = (1,753.5 + 12.1)x + (0.092 + 0.024) R = 0.9996 0 250 500 750 1000 1250 0.0 0.1 0.2 0.3 0.4 0.5 0.6 Peak are a Concentration (% w/v) y = (2,055.2 + 9.5) x + (0.064 + 0.051) R = 0.9996 0 30 60 90 120 0.00 0.01 0.02 0.03 0.04 0.05 Peak area Concentration (% w/v) A B C
Mean peak area (day 1) (n = 6) 148.37 151.37 20.67
Mean peak area (day 2) (n = 6) 148.84 150.37 20.29
% RSD Intermediate precision (days 1 and 2) (n = 12) 1.82 1.79 3.40
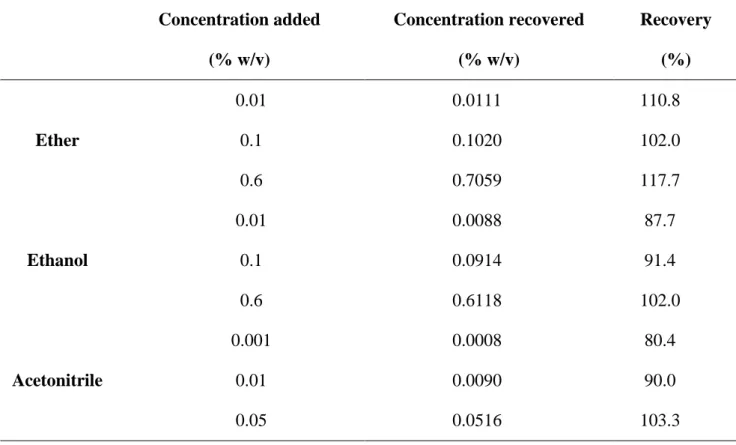
Accuracy was verified through performing recovery experiments by adding known amounts of ether, ethanol and acetonitrile at three different concentration levels to [18F]FDG sample. The results presented in Table 3 refer to the mean of replicates for each concentration level. The developed procedure was found to be accurate, as the percentage of recovery was in the range of 80-120% for all experiments.
Table 3: Accuracy results obtained for ether, ethanol and acetonitrile Concentration added (% w/v) Concentration recovered (% w/v) Recovery (%) Ether 0.01 0.0111 110.8 0.1 0.1020 102.0 0.6 0.7059 117.7 Ethanol 0.01 0.0088 87.7 0.1 0.0914 91.4 0.6 0.6118 102.0 Acetonitrile 0.001 0.0008 80.4 0.01 0.0090 90.0 0.05 0.0516 103.3
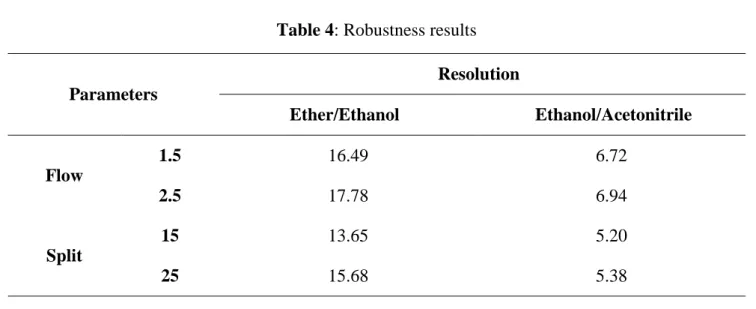
Robustness was evaluated by making deliberate variations in the procedure parameters. The effect of variation on the carrier gas flow and split for determination of ether, ethanol and acetonitrile was investigated. Mean resolution values (n=3) between ether and ethanol and between ethanol and acetonitrile are presented in Table 4. Appropriate resolution was obtained in all analyses. The
Costa, et. Al. ● Braz. J. Rad. Sci. ● 2019 10
procedure remained unaffected by small variations in analytical conditions, indicating its reliability during normal usage.
Table 4: Robustness results
Parameters Resolution Ether/Ethanol Ethanol/Acetonitrile Flow 1.5 16.49 6.72 2.5 17.78 6.94 Split 15 13.65 5.20 25 15.68 5.38
4. CONCLUSION
A new and fast (4-minute) procedure was developed for determination of residual solvents such as
ether, ethanol and acetonitrile in [18F]FDG by gas chromatography. The validation study provided
evidence that the developed procedure meets the specified requirements defined in internationally recognized and accepted guidelines. Therefore, the analytical procedure could be applied to generate valid results in routine quality control of [18F]FDG.
5. ACKNOWLEDGMENT
This work was supported by Centro de Desenvolvimento da Tecnologia Nuclear (CDTN/CNEN-MG) and Fundação de Amparo à Pesquisa do Estado de Minas Gerais (FAPEMIG). The authors would like to thank Radiopharmaceuticals Research and Production Unit for kindly providing [18F]FDG.
REFERENCES
1. AMETAMEY, S.; HONER, M.; SCHUBIGER, P. Molecular imaging with PET. Chem Rev, v. 108, p. 1501-15016, 2008.
2. ALMUHAIDEB, A.; PAPATHANASIOU, N.; BOMANJI, J. 18F-FDG PET/CT Imaging in
Oncology. Ann Saudi Med, v. 31(3), p. 3-13, 2011.
3. YU, S. Review of 18F-FDG Synthesis and Quality Control. Biomed Imaging Interv J, v. 2(4),
p. e57, 2006.
4. ICH - International Conference on Harmonisation of Technical Requirements for Registration of Pharmaceuticals for Human Use. Validation of Analytical Procedures: Text and Methodology Q2(R1). 2005. Available at: < https://www.ich.org/fileadmin /Public_Web_Site/ICH_Products/Guidelines/Quality/Q2_R1/Step4/Q2_R1__Guideline.pdf>. Last accessed: 02 Oct. 2017.
5. COUNCIL OF EUROPE. European Pharmacopoeia, 9th ed. Strasbourg: Council of Europe,
2016.
6. THE UNITED STATES PHARMACOPEIA CONVENTION. The United States Pharmacopeia,
39th ed. Rockville: The United States Pharmacopeial Convention, 2016.
7. INMETRO - Instituto Nacional de Metrologia, Qualidade e Tecnologia. DOQ-CGCRE-008 - Orientação sobre validação de métodos analíticos. 2016. Available at: <
http://www.inmetro.gov.br/Sidoq/Arquivos/CGCRE/DOQ/DOQ-CGCRE-8_05.pdf>. Last
accessed: 02 Oct. 2017.
8. SOUZA, S.; JUNQUEIRA, R. A procedure to assess linearity by ordinary least squares method. Anal Chim Acta, v. 552, p. 25-35, 2005.