DOI: 10.1590/0004-282X20160046
ARTICLE
Pituitary macroadenoma: analysis of intercarotid
artery distance compared to controls
Macroadenoma de hipóise: análise da distância intercarotídea comparada a controles
Cristian Ferrareze Nunes1, Gustavo Augusto Porto Sereno Cabral1, José Orlando de Mello Junior1, Mario
Alberto Lapenta1, José Alberto Landeiro1,2
Despite all the improvement in transsphenoidal surgery, the anatomical knowledge has been a main issue stressed
by most authors1. In the transsphenoidal approach for
pi-tuitary adenomas, detailed preoperative planning with in-formation regarding the sphenoid sinus, tumoral involve-ment of adjacent structures (cavernous sinus, suprasellar region, carotid arteries) and intercarotid distance (ICD) is critical. Despite that, there is little literature regarding the ICD at the parassellar region of the intracranial carotid ar-teries at its cavernous segment and its modifications due to the sellar pathologies, specially non-functioning
pitu-itary adenomas2,3,4,5,6.
Although vascular injuries have become less frequent over the
years, with reports ranging from 0–3.8%7,8,9,10,11,12,13,14,15,16,17,18,19,20, it is
still considered one of the most important complications in the transsphenoidal approaches due to its potential hazardous
ef-fects and diicult management. Taking this into consideration,
it is crucial that every surgeon knows exactly the carotid artery position and its relation to the lesion.
his study has the aim to measure and analyze ICD in a
series of patients with non-functioning pituitary adenomas with no previous treatment and correlate the data with mea-surements in controls with no endocrinological, sellar or parassellar disease.
1Galeão Air Force Hospital, Departamento de Neurocirugia, Rio de Janeiro RJ, Brasil; 2Universidade Federal Fluminense, Departamento de Neurocirurgia, Rio de Janeiro RJ, Brasil.
Correspondence: Cristian Ferrareze Nunes; Departamento de Neurocirurgia, Galeão Air Force Hospital; Estrada do Galeão, 4101; 21941-353 Rio de Janeiro RJ, Brasil; E-mail: [email protected]
Conflict of interest: There is no conlict of interest to declare.
Received 15 Janurary 2015; Received in inal form 23 October 2015; Accepted 22 December 2015. ABSTRACT
Objective: To evaluate the intercarotid distance (ICD) of patients with pituitary macroadenoma and compare to heatlhy controls. Method:
We retrospectively reviewed contrast-enhanced MRI images from twenty consecutive patients diagnosed with non-functioning pituitary macroadenoma, measured the ICD at two different levels (petrous segment – ICD1 and horizontal cavernous segment – ICD2) and compared to twenty paired controls. Results: There was no statistically signiicant difference of the mean ICD1 between the groups and subgroups. For the ICD2 there was statistically signiicant difference between the case and controls. However, there was no signiicant difference between the patients with smaller adenomas and the controls. In contrast, the patients with giant adenomas showed statistically signiicantly higher ICD2 than the controls. Conclusion: The ICD at the horizontal segment of the cavernous carotid tends to be wider in patients with giant pituitary adenomas than in healthy individuals or patients with smaller adenomas.
Keywords: Pituitary gland; pituitary disease; internal carotid artery; endoscopy; sella turcica.
RESUMO
Objetivo: Avaliar a distância intercarotídea (DIC) de pacientes com macroadenoma de hipóise e comparar com controles saudáveis. Método:
Foram analisados retrospectivamente imagens de ressonância magnética com contraste de vinte pacientes consecutivos com diagnóstico de macroadenoma hipoisário não-funcionante, medidas as DIC em dois níveis diferentes (segmento petroso – DIC1 e segmento cavernoso horizontal – DIC2) e comparados com vinte controles pareados. Resultados: Não houve diferença estatisticamente signiicativa da DIC1 média entre os grupos e subgrupos. Para a DIC2 houve diferença estatisticamente signiicativa entre os casos e controles. No entanto, não houve diferença signiicativa entre os doentes com adenomas menores e os controles. Entretanto, os pacientes com adenomas gigantes tiveram estatisticamente signiicativamente DIC2 que os controlos. Conclusão: A DIC no segmento horizontal da carótida cavernoso, tende a ser mais larga em doentes com adenomas hipoisários gigantes do que em indivíduos saudáveis ou de pacientes com adenomas menores.
METHOD
We retrospectively reviewed twenty consecutive pa-tients diagnosed with non-functioning pituitary
macroad-enoma (>10 mm in any plane) whom underwent irst time
endonasal endoscopic transsphenoidal resection assisted by neuronavigation from January 2008 to December 2010.
his group was further sub-classiied in adenoma and giant adenoma, deined as lesions with more than 40 mm in any plane. he controls (n = 20) were age and sex matched with
the cases and had no endocrinological, sellar or parassellar disease. Age matching was not perfect, maximum age
dif-ference was 5 years and the mean didif-ference 1,9 years. Fine cut (1 mm) T1W gadolinium enhanced MRI imaging were acquired using a 1.5-T MR imaging unit (Signa®; General Electric Medical Systems). All the imaging data was upload -ed to the BrainLab Neuronavigation Workstation (BrainLab
iPlan Cranial 2.6 software) database and analyzed in axial,
coronal and sagittal planes for the following parameters:
• Intercarotid distance, deined as the smallest distance
between the inner walls of the carotid artery lumen en-hanced by gadolinium, was measured at two levels:
• intercarotid distance 1 (ICD1) – petrous carotid seg
-ment after the cranial bend (Figure 1, A and B);
• intercarotid distance 2 (ICD2) – cavernous ca -rotid segment at the mid portion of its horizon-tal part (Figure 1, C and D).
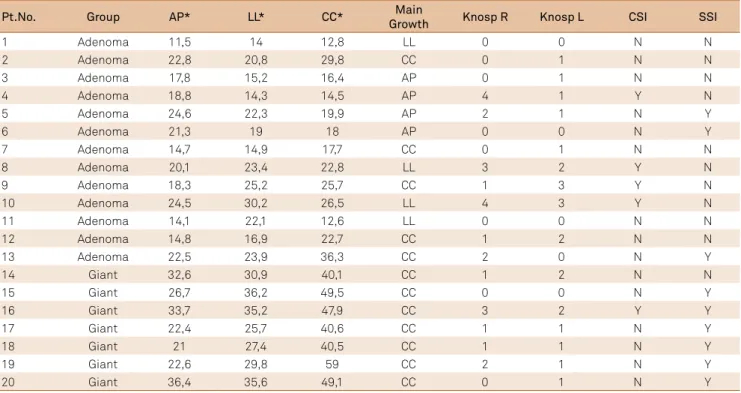
he cases group was further analyzed regarding the tu
-mor dimensions as following (Figure 2, Table 1):
• largest anteroposterior dimension in axial plane MRI; • largest latero-lateral dimension in coronal plane MRI; • largest craniocaudal dimension in sagital plane MRI. All patients in the cases group were further classiied ac
-cording to (Table 1):
• Cavernous sinus invasion (CSI): deined as Knosp grade
3 or 4 on any side21;
• Sphenoid sinus invasion (SSI): deined as presence of tu
-mor inside the sphenoid sinus on MRI.
he measurements were performed by two diferent
and independent observers following the same protocol:
irst, 5 stage zoom was applied and then all measurements
where performed and recorded in millimeters with one
dec-imal unit precision. he mean value of the results found by
the two observers for each measurement were used for the
statistical analysis (Table 2).
Statistical methods
Statistical analysis was performed with Medcalc sta
-tistics software (MedCalc version 13.1.2, Ostend, Belgium).
For the inter-observer reproducibility analysis we used
Figure 1. T1-weighted MRI of the sellar and parasellar regions in a patient with pituitary adenoma. (A) and (B) intercarotid distance 1 (ICD1) measured in axial and coronal plane. (C) and (D) intercarotid distance 2 (ICD2) measured in axial and coronal plane.
A
B
the intraclass correlation coeicient. he mean values of
continuous variables in 2 groups were compared with the
2-sample t test if the variances did not difer signiicant
-ly (p > 0.05). For signiicant-ly diferent variances, we used
the Welch test (reported in the results). Normally distrib-uted data are summarized by mean ± standard deviation.
We calculated the Pearson correlation coeicient for the
assessment of associations between continuous variables. We used Fisher’s exact test to asses the relation between
categorical variables. Statistical signiicance was deined as a probability value < 0.05 (Table 3).
RESULTS
The mean age in the cases group was 52,3 years (range,
21–78 years) and in the control group was 52,3 years (range, 21–83 years) and they did not differ significantly
(p = 0.8693). The sex match was perfect and there were 9
males and 11 females in each group, cases and controls.
Sex proportion at adenoma subgroup (6M:7F) and giant subgroup (5M:2F) did not differ significantly (p = 0,3742;
according to Fisher’s exact test).
There was an excellent correlation between the
two observer measurements of the ICD1, ICD2 and tu-mor dimensions, as shown by the Interclass Correlation Coefficient (ICC) equals to 0.93, 0.91 and 0.99,
respec-tively (Figure 3). This data indicates that the method
of measurement used in the study has an excellent re-producibility to evaluate the intercarotid distance when performed by two independent observers.
The mean ICD1 in the cases group was 21,17 ± 2,49 mm
and in the controls group was 19,89 ± 2,65 mm and there was no statistically significant difference between the
two groups (p = 0.1239). In the adenoma subgroup the
mean ICD1 was 21,26 ± 2,48 mm and in the giant
sub-group the mean was 21.00 ± 2.69 mm. There were no sta -tistically significant differences between the mean ICD1 values of the adenoma subgroup and the control group
(p = 0.1470), the giant subgroup and the control group (p = 0.3513), neither the adenoma subgroup and the giant subgroup (p = 0.8296) (Figure 4, 5).
In the cases group the mean ICD2 was 24.27 ± 5.14 mm and in the control group it was 19.41 ± 3.00 mm and the difference was statistically significant between the two
groups (p = 0.001 according to the Welch test). In the ad -enoma subgroup the mean ICD2 was 21.54 ± 3.52 mm and
in the giant subgroup it was 25.97 ± 3,63 mm. The ICD2
did not differ significantly among the adenoma subgroup
and the controls (p = 0.0724). However, there was highly
significant difference between the giant subgroup and the control group (p < 0.0001), as well as the giant subgroup
and the adenoma subgroup (p = 0.0002) (Figure 5, 6).
Figure 2. T1-weighted gadolinium enhanced MRI of the sellar and parasellar regions in a patient with pituitary adenoma. (A) anteroposterior, (B) latero-lateral and (C) craniocaudal measurements of the tumor.
A
B
he Pearson correlation coeicient showed no correlation
between the ICD1 and any of the tumor dimensions (p > 0.05).
However, the ICD2 showed excellent correlation with tumor lat
-erolateral size and ICD2 (Pearson r = 0.9048; p < 0.0001), good correlation with tumor craniocaudal size (Pearson r = 0.7679;
p = 0.0001) and moderate correlation with anteroposterior tu
-mor size (Pearson r = 0.6985; p = 0.0006) (Figure 7). According to Fisher’s exact test there is statistically signiicant correlation be -tween craniocaudal main growth and the giant subgroup (100%)
compared to the adenoma subgroup (38,46%) (p = 0.0147).
Pt.No. Group AP* LL* CC* Main
Growth Knosp R Knosp L CSI SSI
1 Adenoma 11,5 14 12,8 LL 0 0 N N
2 Adenoma 22,8 20,8 29,8 CC 0 1 N N
3 Adenoma 17,8 15,2 16,4 AP 0 1 N N
4 Adenoma 18,8 14,3 14,5 AP 4 1 Y N
5 Adenoma 24,6 22,3 19,9 AP 2 1 N Y
6 Adenoma 21,3 19 18 AP 0 0 N Y
7 Adenoma 14,7 14,9 17,7 CC 0 1 N N
8 Adenoma 20,1 23,4 22,8 LL 3 2 Y N
9 Adenoma 18,3 25,2 25,7 CC 1 3 Y N
10 Adenoma 24,5 30,2 26,5 LL 4 3 Y N
11 Adenoma 14,1 22,1 12,6 LL 0 0 N N
12 Adenoma 14,8 16,9 22,7 CC 1 2 N N
13 Adenoma 22,5 23,9 36,3 CC 2 0 N Y
14 Giant 32,6 30,9 40,1 CC 1 2 N N
15 Giant 26,7 36,2 49,5 CC 0 0 N Y
16 Giant 33,7 35,2 47,9 CC 3 2 Y Y
17 Giant 22,4 25,7 40,6 CC 1 1 N Y
18 Giant 21 27,4 40,5 CC 1 1 N Y
19 Giant 22,6 29,8 59 CC 2 1 N Y
20 Giant 36,4 35,6 49,1 CC 0 1 N Y
Table 1. Cases group tumor characteristics, sub-classiied as adenoma and giant.
AP: anteroposterior; LL: latero-lateral; CC: craniocaudal; CSI: cavernous sinus invasion; SSI: sphenoid sinus invasion; *measurements in millimeters.
Pt.No. Subgroup ICD1* ICD2* Pt. No. Subgroup ICD1* ICD2*
1 Adenoma 19,6 16,9 21 Control 19,6 21,3
2 Adenoma 21,4 21,9 22 Control 17,5 20,7
3 Adenoma 17,1 21,8 23 Control 20,1 17,8
4 Adenoma 20,8 17,2 24 Control 21,8 12,8
5 Adenoma 22,7 24,6 25 Control 19,8 19,1
6 Adenoma 19 17,2 26 Control 21,6 17,8
7 Adenoma 18,3 18,8 27 Control 21,5 18,9
8 Adenoma 22,1 20,9 28 Control 17,9 20
9 Adenoma 20,2 22,8 29 Control 18,4 18
10 Adenoma 25,3 28,2 30 Control 16,5 19,6
11 Adenoma 25,2 26,6 31 Control 24,3 22,5
12 Adenoma 23,3 21 32 Control 19,9 18
13 Adenoma 21,4 22,2 33 Control 16,4 14,5
14 Giant 25,7 26,8 34 Control 17,9 18,3
15 Giant 20,4 32,5 35 Control 18,1 20,5
16 Giant 16,8 34,5 36 Control 23,5 25
17 Giant 20,2 25,2 37 Control 21,3 21,9
18 Giant 21,3 26,1 38 Control 25 23,9
19 Giant 20,2 28,2 39 Control 15,5 15,8
20 Giant 22,4 32 40 Control 21,2 21,9
Table 2. Intercarotid distance measurement for all individuals.
In the controls group the mean ICD2 among males
was 21.17 ± 2.12 mm (n = 11) and among females was 17.26 ± 2.52 mm (n = 9) and the diference was statistically signiicant (p = 0.0014) (Figure 8).
No correlation was found, according to the Fisher’s ex-act test, between the occurrence of cavernous sinus inva-sion and the subgroups, adenoma (30,76%) or giant (14,28%)
(p = 0.4058). However, there was a signiicant correlation be -tween the subgroups, adenoma (23.07%) or giant (85,71%),
and the occurrence of sphenoid sinus invasion (p = 0.0166).
DISCUSSION
he intercarotid distance plays a crucial role in trans -sphenoidal surgery, once it determines the corridor to the sellar and suprassellar spaces and some papers have
stud-ied it. Diferent methods of measuring the intercarotid dis
-tance have been used in the literature1,2,6,17,22,23, among them,
the T1W gadolinium enhanced MRI. Although it was not a
primary objective in our study, we could conclude that the
intercarotid distance measurement using enhanced-MRI is
a reproducible method to evaluate the intercarotid distance,
with excellent inter-observer correlation (ICC = 0,93 for ICD1; ICC = 0,91 for ICD2).
he narrowest intercarotid distance was found to be ei
-ther in the suprassellar segment24 or at the level of the
tu-berculum sellae25,26. he mean values for the intercarotid
distance at the selar region in healthy individuals reported in the literature have a wide range, varying from 12 mm to
18 mm1,3,4,6,22,23,25,27,28,29, what we believe to be related to the
method used to measure the distance and the ethnical difer -ences between the study populations. In our study, the mean intercarotid distance at its horizontal portion at the sellar
14 16 18 20 22 24 26 28
10 15 20 25 30 35 40
10 20 30 40 50 60
14 16 18 20 22 24 26 28 10 15 20 25 30 35 40 10 20 30 40 50 60 ICD1 Obs2 ICD1 Obs1 ICD2 Obs2 ICD2 Obs1 Tumor Obs2 Tumor Obs1
Figure 3. Scatter diagram between the measurements of the two observers for intercarotid distance 1 (ICD1), intercarotid distance 1 (ICD2) and tumor size. Grey line representing the line of equality (x=y). Black line representing the trend line os the scattered data.
Table 3. Statistical analysis results.
ICD1: intercarotid distance 1; ICD2: intercarotid distance 2; *measurement in millimeters, **statistically signiicant if p < 0,05, ***t-test, ****Welch test, *****statistically signiicant value.
Variável Difference of
means (95%CI)* Statistical Test Result p-value** ICD1
Control vs. Cases 1,28 (-0,36–2,92) 1,574*** 0,1239 Control vs. Adenoma 1,37 (-0,51–3,25) 1,487*** 0,147 Control vs. Giant 1,11 (-1,29–3,51) 0,950*** 0,3513 Giant vs. Adenoma 0,26 (-2,25–2,78) 0,218*** 0,8296
ICD2
Control vs. Cases 4,85 (2,13–7,57) 3,642**** 0,0010***** Control vs. Adenoma 2,13 (-0,20–4,47) 1,860*** 0,0724 Control vs. Giant 9,91 (7,04–12,77) 7,127*** <0,0001***** Giant vs. Adenoma 7,78 (4,27–11,28) 4,664*** 0,0002***** Control female vs.
male 3,90 (1,77–6,09) 3,759*** 0,0014*****
ICD1_Cont ICD1_Ade ICD1_Giant
Distance (mm) 26 24 22 20 18 16 14
p = 0.1470
p = 0.8296 p = 0.3513
x¯ = 19.89
x¯ = 21.26 x¯ = 21.00
region (ICD2) in the controls group was 19.41 ± 3.00 mm, a
diference probably attributable to the same reasons they difer in another studies. Diferent from previous reports23,
there was a statistically signiicant diference between males
and females ICD2 in the control group (males = 21.17 mm, females = 17.26 ± 2.52 mm; p = 0.0014).
As we expected there was no statistically signiicant dif -ference between the groups neither the subgroups related to
the ICD1. he petrous segment of the carotid artery has di -rect contact to bone and thick dural layers that would pre-vent its displacement and the disease itself is localized to a more cranial extent of the carotid arteries. We used this mea-surement as a way to assure that the displacement of the ca-rotid arteries at the sellar region is not related to any other
inluence than the tumor growth.
In patients with selar and parassellar pathology a few papers have studied the differences in the interca-rotid distance compared to healthy individuals. Ebner et al have demonstrated that in acromegalic patients the mean intercarotid distance is narrower than in healthy
individuals (1.64 ± 0.40 cm vs 1.90 ± 0.26 cm)30. Several
studies have showed that patients with pituitary adeno-mas have higher intercarotid distance than individuals with no sellar pathology, and patients with bigger lesions tend to have bigger intercarotid distances than patients
with smaller lesions (less than 10mm)2,4,6,21. Our results
support the previous reports, showing a bigger ICD2 in the cases group. In the subgroup analysis, there was no significant difference between the controls and the
ICD2_Cont ICD2_Ade ICD2_Giant
Distance (mm)
35
30
25
20
15
10
p = 0.0724
p = 0.0002 p < 0.0001
x¯ = 19.41
x¯ = 21.54
x¯ = 25.97
Figure 6. Dot plot graph comparison of ICD2 between control group, adenoma subgroup and giant subgroup. Wider horizontal line representing the mean (value in bold), vertical line
representing the 95% conidence interval. There is no statistically signiicant difference between the controls group and the adenoma subgroup, however, the giant subgroup demonstrates a higher mean than the controls group and the adenoma subgroup.
Figure 5. T1-weighted gadolinium enhanced axial MRI of the sellar and parasellar regions comparing the ICDs between the control (left) and its paired patient with adenoma (right). (A) ICD1 and (B) ICD2 of patient 39; (C) intercarotid distance 1 (ICD1) and (D) intercarotid distance 2 (ICD2) of patient 19.
A
B
patients with non-giant adenomas. However, the differ -ence between the giant subgroup and both, the adenoma subgroup and the controls, were statistically significant. We believe this difference is probably related to the in-trinsic anatomy of the sella and its surrounding struc-tures. Cranial extent of the tumor is achieved by either expansion of the diaphragma sellae, a very complacent structure, or the disruption of it which explains the fact that craniocaudal dimension is usually the biggest one
in giant adenomas (Table 2). Once the tumor has grown
cranially it might be subjected to resistance of the dis-tressed diaphragma sellae and the brain tissue caus-ing pressure downwards that could direct the growth of the tumor to lateral, once the cavernous sinus might be structurally less resistant to pressure than the sellar bony walls. In this particular region the carotid artery is rela-tively free of dural attachments and bone surroundings and thus would be displaced more prominently.
Scotti et al.4 in their series of 74 patients, 24 of whom with pituitary adenomas, demonstrated that in patients with adenomas and no evidence of cavernous sinus inva-sion the carotid arteries tend to be more displaced than in those with signs of cavernous sinus invasion. In another
re-port Sasagawa et al compared the ICD at the cavernous ca -rotid pre and postoperatively and demonstrated that in in-vasive pituitary adenomas the ICD tends to be reduced after surgery, probably because of disruption of supportive tissues
that keep the carotid artery in place at this segment5. In
con-trast, in our study, the amount of patients with radiological
signs of CSI did not difer between the adenoma and the gi
-ant subgroup, although the ICD2 was signiic-antly higher in the giant subgroup. hus, we conclude that the CSI had no inluence in the ICD in our series.
Despite its importance, the ICD has still limited
litera-ture regarding its modiication due to pathological process
-es. Our results reinforce the logically increase in the ICD
with large pituitary tumors2,4,6,21, however we could not
re-late it to CSI as other authors did4,5. Interestingly, there was
no statistical diference in the ICD2 when we compared the
adenoma with the control group, but the ICD2 it was
sig-niicantly higher in the giant subgroup when we compared
to both, adenomas subgroup and control group (Figure 6).
his inding might be related to the sample characteristics,
anyhow we believe there may be anatomical features that are disrupted by the tumor pressure against the carotid ar-teries at a certain point that would permit a higher carotid displacement. Bearing this idea, the tumor consistency and growth rate may play a role in the way the carotid arteries are displaced by the tumor. Further studies are needed to both prove our theories and understand the direct and in-direct anatomical changes caused by pituitary adenomas to the sellar and parasellar structures.
In this study, we decided not to evaluate the extent of
tumor resection for several reasons. here are multiple fac
-tors that may afect the extent of resection, for example,
tumor size, cavernous sinus invasion and consistency of the
tumor. Our sample is not big enough for multivariate analy -sis to exclude the other factors and evaluate only the ICD.
Moreover, we did not have any case of abnormally little ICD
ICD1_Male ICD1_Female ICD2_Male
Distance (mm) 22 20 18 16 14 12
p = 0.2892
p = 0.0014
x¯ = 20.47
x¯ = 19.17
x¯ = 21.17
ICD2_Female 26
24
x¯ = 17.26
Figure 8. Dot plot graph comparison of intercarotid
distance 1 (ICD1) and intercarotid distance 2 (ICD2) between males and females of the control groups. Wider horizontal line representing the mean (value in bold), vertical line representing the 95% conidence interval. The graph demonstrates statistically signiicant difference between males and females for ICD2, but not for ICD1.
10 15 20 25 30 35 40 10 20 30 40 50 60 10 20 25 30 35 40
10 15 20 25 30 35 40 10 20 30 40 50 60 10 15 20 30 35 40 Tumor AP ICD2 Cases Tumor CC ICD2 Cases Tumor LL ICD2 Cases 25 15
that would hinder the resection or obstruct the approach
to the sellar space. Sasagawa et al.5, were the only relating grade of resection with ICD. In their study gross total or subtotal resection was less achieved in patients with ICD lower than 25 mm, however, the aforementioned distance is still higher than the mean ICD found in ours and other studies, so we do not recommend that measurement as an
obstacle to tumor resection1,3,4,5,6,22,23,25,27,28,29.
In conclusion, apparently the ICD at the horizontal seg-ment of the cavernous carotid tends to be wider in patients
with giant pituitary adenomas. Diferently from other reports
we found no relation between cavernous sinus invasion and
the ICD. In our controls, the males had a signiicantly wider
ICD than the females, which is not found in any other studies
and could represent an ethnic diference.
We believe the study of the carotid arteries anatomy in sick and healthy individuals is essential to the skull base sur-gery, specially for endoscopic endonasal approaches that
use the intercarotid corridor for most of its approaches. Our
study is limited by the sample size and its retrospective
na-ture and further research has to be carried to conirm our
data and validate it for other populations.
References
1. Jho HD, Ha HG. Endoscopic endonasal skull base surgery: Part 1 – The midline anterior fossa skull base. Minim Invasive Neurosurg. 2004;47(1):1-8. doi:10.1055/s-2003-812538
2. Hewaidi GH, Omami GM. Anatomic variation of sphenoid sinus and related structures in Libyan population: CT scan study. Libyan J Med. 2008;3(3):128-33. doi:10.4176/080307
3. Wolfsberger S, Neubauer A, Bühler K, Wegenkittl R, Czech T, Gentzsch S et al. Advanced virtual endoscopy for endoscopic transsphenoidal pituitary surgery. Neurosurgery. 2006;59(5):1001-9. doi:10.1227/01.NEU.0000245594.61828.41
4. Scotti G, Yu CY, Dillon WP, Norman D, Colombo N, Newton TH et al. MR imaging of cavernous sinus involvement by pituitary adenomas. AJR Am J Roentgenol. 1988;151(4):799-806. doi:10.2214/ajr.151.4.799
5. Sasagawa Y, Tachibana O, Doai M, Akai T, Tonami H, Iizuka H. Internal carotid arterial shift after transsphenoidal surgery in pituitary adenomas with cavernous sinus invasion. Pituitary. 2013;16(4):465-70. doi:10.1007/s11102-013-0492-2
6. Zada G, Agarwalla PK, Mukundan S Jr, Dunn I, Golby AJ, Laws ER Jr. The neurosurgical anatomy of the sphenoid sinus and sellar loor in endoscopic transsphenoidal surgery. J Neurosurg. 2011;114(5):1319-30. doi:10.3171/2010.11.JNS10768
7. Ciric I, Ragin A, Baumgartner C, Pierce D. Complications of transsphenoidal surgery: results of a national survey, review of the literature, and personal experience. Neurosurgery. 1997;40(2):225-36. doi:10.1097/00006123-199702000-00001
8. Raymond J, Hardy J, Czepko R, Roy D. Arterial injuries in transsphenoidal surgery for pituitary adenoma; the role of angiography and endovascular treatment. AJNR Am J Neuroradiol. 1997;18(4):655-65.
9. Laws ER. Vascular complications of transsphenoidal surgery. Pituitary. 1999;2(2):163-70. doi:10.1023/A:1009951917649
10. Cappabianca P, Cavallo LM, Colao A, Divitiis E. Surgical complications associated with the endoscopic endonasal transsphenoidal approach for pituitary adenomas. J Neurosurg. 2002;97(2):293-8. doi:10.3171/jns.2002.97.2.0293
11. Zada G, Kelly DF, Cohan P, Wang C, Swerdloff R. Endonasal transsphenoidal approach for pituitary adenomas and other sellar lesions: an assessment of eficacy, safety, and patient impressions. J Neurosurg. 2003;98(2):350-8. doi:10.3171/jns.2003.98.2.0350
12. Mortini P, Losa M, Barzaghi R, Boari N, Giovanelli M. Results of transsphenoidal surgery in a large series of patients with pituitary adenoma. Neurosurgery. 2005;56(6):1222-33. doi:10.1227/01.NEU.0000159647.64275.9D
13. Hamid O, El Fiky L, Hassan O, Kotb A, El Fiky S. Anatomic variations of the sphenoid sinus and their impact on trans-sphenoid pituitary surgery. Skull Base. 2008;18(1):9-15. doi:10.1055/s-2007-992764
14. Dehdashti AR, Ganna A, Karabatsou K, Gentili F. Pure endoscopic endonasal approach for pituitary adenomas: early
surgical results in 200 patients and comparison with previous microsurgical series. Neurosurgery. 2008;62(5):1006-15. doi:10.1227/01.neu.0000325862.83961.12
15. Dusick JR, Esposito F, Malkasian D, Kelly DF. Avoidance of carotid artery injuries in transsphenoidal surgery with the Doppler probe and micro-hook blades. Neurosurgery. 2007;60(4 Suppl 2):322-8. doi:10.1227/01.NEU.0000255408.84269.A8
16. Zada G, Cavallo LM, Esposito F, Fernandez-Jimenez JC, Tasiou A, De Angelis M et al. Transsphenoidal surgery in patients with acromegaly: operative strategies for overcoming technically challenging anatomical variations. Neurosurg Focus. 2010;29(4):E8. doi:10.3171/2010.8.FOCUS10156
17. Feng Y, Zhao JW, Liu M, Wang TJ, Qi ZP, Wang XT, et al. Internal carotid artery in the operative plane of endoscopic endonasal transsphenoidal surgery. J Craniofac Surg. 2012;23(3):909-12. doi:10.1097/SCS.0b013e31824ddf07
18. Berker M, Hazer DB, Yücel T, Gürlek A, Cila A, Aldur M et al. Complications of endoscopic surgery of the pituitary adenomas: analysis of 570 patients and review of the literature. Pituitary. 2012;15(3):288-300. doi:10.1007/s11102-011-0368-2
19. Gardner PA, Tormenti MJ, Pant H, Fernandez-Miranda JC, Snyderman CH, Horowitz MB. Carotid artery injury during endoscopic endonasal skull base surgery: incidence and outcomes. Neurosurgery. 2013;73(2 Suppl Operative):ons261-9. doi:10.1227/01.neu.0000430821.71267.f2
20. Paluzzi A, Fernandez-Miranda JC, Tonya Stefko S, Challinor S, Snyderman CH, Gardner PA. Endoscopic endonasal approach for pituitary adenomas: a series of 555 patients. Pituitary. 2013;17(4):307-19. doi:10.1007/s11102-013-0502-4
21. Knosp E, Steiner E, Kitz K, Matula C. Pituitary adenomas with invasion of the cavernous sinus space: a magnetic resonance imaging classification compared with surgical findings. Neurosurgery. 1993;33(4):610-7. doi:10.1227/00006123-199310000-00008
22. Yilmazlar S, Kocaeli H, Eyigor O, Hakyemez B, Korfali E. Clinical importance of the basal cavernous sinuses and cavernous carotid arteries relative to the pituitary gland and macroadenomas: quantitative analysis of the complete anatomy. Surg Neurol. 2008;70(2):165-74. doi:10.1016/j.surneu.2007.06.094
23. Salame K, Ouaknine GE, Reider-Groswasser I. Microsurgical and radiographic anatomy of the internal carotid artery with morphometric analysis. Oper Tech. Otolaryngol – Head Neck Surg. 2000;11(4):228-33. doi:10.1053/otot.2000.19690
24. Renn WH, Rhoton AL Jr. Microsurgical anatomy of the sellar region. J Neurosurg. 1975;43(3):288-98. doi:10.3171/jns.1975.43.3.0288
26. Wang J, Bidari S, Inoue K, Yang H, Rhoton A Jr. Extensions of the sphenoid sinus: a new classiication. Neurosurgery. 2010;66(4):797-816. doi:10.1227/01.NEU.0000367619.24800.B1
27. Locatelli M, Caroli M, Pluderi M, Motta F, Gaini SM, Tschabitscher M et al. Endoscopic transsphenoidal optic nerve decompression: an anatomical study. Surg Radiol Anat. 2011;33(3):257-62. doi:10.1007/s00276-010-0734-1
28. Gupta T. An anatomical study of inter carotid distances in the sellar region with a surgical perspective. Braz J Morphol Sci. 2009;26(1):23-6.
29. Knappe UJ, Jaursch-Hancke C, Schönmayr R, Lörcher U. Assessment of normal perisellar anatomy in 1.5 T T2-weighted MRI and comparison with the anatomic criteria deining cavernous sinus invasion of pituitary adenomas. Cent Eur Neurosurg. 2009;70(3):130-6. doi:10.1055/s-0029-1216363