www.hydrol-earth-syst-sci.net/16/147/2012/ doi:10.5194/hess-16-147-2012
© Author(s) 2012. CC Attribution 3.0 License.
Earth System
Sciences
Frequency pattern of turbulent flow and sediment entrainment
over ripples using image processing
A. Keshavarzi1,*, J. Ball2, and H. Nabavi1
1Water Department, Shiraz University, Shiraz, Iran
2School of Civil & Environmental Engineering, FEIT, University of Technology Sydney,
Broadway, NSW, 2007, Sydney, Australia
*now at: School of Civil & Environmental Engineering, FEIT, University of Technology Sydney,
Broadway, NSW, 2007, Sydney, Australia
Correspondence to:A. Keshavarzi ([email protected])
Received: 13 July 2011 – Published in Hydrol. Earth Syst. Sci. Discuss.: 17 August 2011 Revised: 8 December 2011 – Accepted: 9 December 2011 – Published: 13 January 2012
Abstract. River channel change and bed scourings are
source of major environmental problem for fish and aquatic habitat. The bed form such as ripples and dunes is the result of an interaction between turbulent flow structure and sed-iment particles at the bed. The structure of turbulent flow over ripples is important to understand initiation of sediment entrainment and its transport. The focus of this study is the measurement and analysis of the dominant bursting events and the flow structure over ripples in the bed of a channel. Two types of ripples with sinusoidal and triangular forms were tested in this study. The velocities of flow over the rip-ples were measured in three dimensions using an Acoustic Doppler Velocimeter with a sampling rate of 50 Hz. These velocities were measured at different points within the flow depth from the bed and at different longitudinal positions along the flume. A CCD camera was used to capture 1500 se-quential images from the bed and to monitor sediment move-ment at different positions along the bed. Application of im-age processing technique enabled us to compute the number of entrained and deposited particles over the ripples. From a quadrant decomposition of instantaneous velocity fluctu-ations close to the bed, it was found that bursting events downstream of the second ripple, in Quadrants 1 and 3, were dominant whereas upstream of the ripple, Quadrants 2 and 4 were dominant. More importantly consideration of these results indicates that the normalized occurrence probabili-ties of sweep events along the channel are in phase with the bed forms whereas those of ejection events are out of phase with the bed form. Therefore entrainment would be expected to occur upstream and deposition occurs downstream of the
ripple. These expectations were confirmed by measurement of entrained and deposited sediment particles from the bed. These above information can be used in practical application for rivers where restoration is required.
1 Introduction
The entrainment and transport of sediment particles in rivers, natural stream and coastal area is a significant component of many environmental degradation problems. Many aquatic ecosystems and fish habitats in which needs to be restored have problems with channel bed changes and may led to the problems such as degradation, changes in channel forms and sedimentation. In such rivers ecosystems, restoring the orig-inal morphology and other physical characteristics is nec-essary for the rehabilitation of hydrodynamics of aquatic ecosystems. Studies for example by Murphy and Ran-dle (2003) indicated that channel widening is possible only with a concerted restoration plan for flow and land manage-ment actions.
The hydrodynamics of aquatic life or eco-hydraulics has become recently the interest of many new researches in last decade. This new area links the environmental fluid mechan-ics disciplines and ecology together to define flow-organism interactions at different scales. Nikora (2010) highlighted the hydrodynamics of aquatic ecosystems or ecohydraulics as an emerging tendency in modern science which create a new area and discipline that needs an integration of several dif-ferent disciplines, offering a useful example of a systematic development of an integrative discipline in the environmen-tal area. Nikora (2010) concluded that that Hydrodynam-ics of Aquatic Ecosystems will provide a missing research platform that will synchronize and enhance flow studies in aquatic ecology and will also provide a solid biophysical ba-sis for ecohydraulics which has been formed as an applied research area based on largely empirical or semi-empirical approaches.
In most natural streams, the bed is not flat due to high ve-locity of flow. The high flow veve-locity produces higher shear stress than shear stress at threshold of initiation of sediment motion and makes bed changes in various forms such as rip-ples, dunes and anti-dunes (Knighton, 1998). Ripples and dunes are the result of a combination of high scouring and deposition processes at the bed of rivers and streams and are major causes of channel change.
The formation of bed topography is the result of compli-cated interactions between fluid and sediment particles along the bed. Bed forms and the geometry of ripples are a func-tion of bed roughness, median diameter of sediment particles and flow characteristics such as shear stress, separation and Froude number (Mogridge et al., 1994). Ripple geometry and its interaction with flow structure has been studied by many investigators (for example, Bagnold, 1946; Carstens et al., 1969; Mogridge et al., 1994; Yalin, 1977; Khelifa and Ouellet, 2000; Miller and Komar, 1980; and Nielsen, 1992). In these studies, the geometry of bed ripples was found to be function turbulent flow structure and shear stress param-eters (Hurthet et al., 2007, 2011; Thorn et al., 2009). Raud-kivi (1997) pointed out that the ripples and vortices within the shear layer are affected by the flow depth, velocity distri-bution and shear stress on the bed. Despite more than three decades of investigation, there is still insufficient information to characterize ripple-flow interaction in adequate detail and over a range of turbulent flow conditions.
One area where this lack of information exists is in appli-cation of image processing for particle entrainment and anal-ysis of the turbulence characteristics and flow structure over ripples. Nevertheless, there has been some research into this aspect. To study the flow structure over the ripples, Sajjadi et al. (1996) found that the vortices that form in the lee of ripples are important for the entrainment of sediment parti-cles. Keshavarzi and Ball (1999) used image processing tech-nique to record entrained and deposited particles over flat bed and found that there is an intermittent nature for particles en-trainment and deposition over the bed. Venditti et al. (2005)
used high resolution super-VHS video system to monitor the development of the sand bed over a flat bed and observed that defect initiation occurs at relatively low flow strengths, where sediment transport is patchy and sporadic. Lajeunesse et al. (2010) used high speed video imaging system to record the trajectories of the moving particles over flat bed and to measure their velocity and observed that entrained particles exhibit intermittent motion composed of the succession of periods of flight and rest. Bennett and Best (1995, 1996) conducted a series of experiment over fixed bed ripples and compared the spatial structure of flow over fixed ripples to reveal the contrasts in the dynamics of the flow separation zone over ripples. Kostaschuck and Church (1993), Julien and Klassen (1995), Kostaschuck and Villard (1996), Car-ling et al. (2000), Kostaschuck (2000) and Colombini and Stocchino (2011) have conducted field and laboratory stud-ies and concluded that the shear related coherent structures were very important in bed form development and bed stabil-ity. Consideration of the results from these studies indicates that the turbulence characteristics have a direct influence on sediment entrainment and the ripple geometry.
Table 1.Experimental flow conditions.
Test Flow Flow No. of Type of Ripples Ripples Velocity measurement height Froude Reynolds
No. Rate Depth ripples ripples wave height (mm) Number Number
(l s−1) (mm) length (mm)
(mm)
1 14.60 170 2 sinusoidal 250 30 5 0.095 20 871
2 18.48 145 2 sinusoidal 250 30 5, 10, 15, 20, 25, 30, 50, 60 0.153 26 400
3 18.50 146 2 sinusoidal 250 30 5, 10, 15, 20, 25, 30, 50, 60 0.151 26 428
4 20.3 138 2 triangular 200 30 5 0.180 28 980
5 22.5 146 2 triangular 250 30 5 0.183 32 120
6 25 163 2 triangular 300 30 5 0.173 356 97
Upstream
Energy Dissipater Control Gate
Glass Wall
V-Notch
Fig. 1.A schematic plan of experimental setup.
patterns disappear towards the outer flow. Also they found that along the dune length, sweep events contribute to shear stress generation. Termini and Sammartano (2009) investi-gated the effects of the variation of bed roughness conditions on the vertical distribution of frequency of the occurrence of ejection and sweep events and concluded that the occurrence of sweep events increases as the bed roughness increases.
However, in spite of the importance of coherent structures and its importance to entrainment of sediment particles over the ripples, their characteristics have not been completely un-derstood. More importantly, the phase probabilities of the sweep and ejection events from the stoss side of the crest and at the lee side of the crest have not been investigated. Pre-sented in this paper, are the results of an investigation into the phase probability of bursting events and the number of entrained sediment particles over ripples. An image process-ing technique was used to compute the number of entrained and deposited sediment particles over the bed and for com-parison with the phase probabilities.
2 Material and methods
The experiments were carried out in a non-recirculating glass flume located in the hydraulics laboratory at Shiraz Univer-sity. The 15.50 m long glass flume has a rectangular cross-section with base width of 0.70 m and height 0.6 m. The longitudinal slope of the flume was set at 0.0005. The flow rate was measured using a pre-calibrated 90◦ V-notch weir
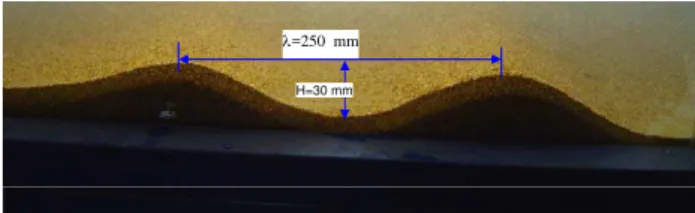
λ=250 mm
H=30 mm
Fig. 2.A schematic of ripple dimension.
located at the end of the flume and an electromagnetic flow meter at inlet pipe. An adjustable gate was installed at the downstream end of the flume for the adjustment of flow depth and velocity. A schematic diagram of the experimental facil-ity is shown in Fig. 1.
In the study reported herein, experimental measurements were carried out for two different types of ripples includ-ing sinusoidal and triangular shapes. The sinusoidal and tri-angular ripples were made with wavelengths 200, 250 and 300 mm and the height of 30 mm. An example photo of the ripples dimensions considered in this study is shown in Fig. 2. The flume bottom was covered with a layer of bed material, consisting of sand particles with median size (D50)
of 0.62 mm.
The experimental tests were performed with fixed bed and mobile bed conditions. For the fixed bed, conditions were very close to the threshold of sediment entrainment and for the mobile bed, conditions were at initiation of sediment motion and therefore only a low number of sediment parti-cles were in motion. Hence the entrainment process did not change the ripple form.
A B
1 2 3 4 5 6 7 8 9 10 11 12 13 14 15 16
30 mm 30 mm
25 100 150 200 250 300 350 400 450 500 550 625 X (mm)
λ
(a)
11 12 13 14 15 16 17
1 2 3 4 5 6 7 8 9 10
λ=200, 250 & 300 mm
30 mm
(b)
Fig. 3.Sections and points of velocity measurement(a)the sinusoidal ripple;(b)the triangular ripple.
ripples and measured positions over the ripples for velocity measurement and image capturing in mobile bed condition. More information for specification of triangular ripples is presented by Jafari Mianaei and Keshavarzi (2008).
The ADV was operated on a pulse-to-pulse coherent Doppler shift to provide three velocity components at a rate of 50 Hz, in which was the maximum sampling frequency for instrument with no conditional frequency sampling. The acoustic sensor consisted of one transmitting transducer and three receiving transducers. The receiving transducers were mounted on short arms around the transmitting transducer at 120◦ azimuth intervals. The downwards pointing ADV
beams travelling through the water focused at a measuring point located 50 mm below the transducer. Therefore, min-imum disturbance to the flow is expected at sampling vol-ume. The output signal passed through a processing module required to evaluate the Doppler shifts. The data acquisition software provided real-time display of the data in graphical and tabular forms. Velocities were measured for 120 s at each point, therefore a total 6000 velocity data were collected for each direction. Data acquisition started after achieving rec-ommended Signal/Noise Ratio (SNR) and correlation coeffi-cient in three dimensions. According to the ADV manufac-turer SonTek (2001) no calibration was necessary while the accuracy of measurement was within±1.0 %.
To understand 2-D characteristics of turbulent flow prior to investigating the 3-D characteristics of turbulence, the horizontal and vertical velocity components are analysed in this study. This approach is consistent with previous stud-ies using quadrant analysis of bursting processes by Kline et al. (1967), Grass (1971), Nakagawa and Nezu (1977, 1978),
Bridge and Bennett (1992), Nelson et al. (1995), Nezu and Nakagawa (1993) and Ojha and Mazumder (2008).
3 Results and discussion
3.1 Quadrant decomposition of velocity fluctuations
The bursting process consists of four categories of event; these categories are defined by the quadrant of the event. As shown in Fig. 4, the events are:
– outward interaction eventu′>0,v′>0
– ejection eventu′<0,v′>0,
– inward interaction eventu′<0,v′<0 and
– sweep eventu′>0,v′<0.
The velocity fluctuationsv′andu′are defined as variations from the time-averaged (mean) velocities in the longitudinal and vertical directions, (uandv), respectively. Algebraically, they are defined by
u′ = u −u and v′ = v −v (1)
where;
u = 1
n n X
i=1
ui and v =
1
n n X
i=1
vi. (2)
Zone III Inward Interaction
u′<0, v′<0
Zone IV Sweep u′>0, v′<0
Zone I Outward Interaction
u′>0, v′>0 Zone II
Ejection u′<0, v′>0
u′ v′
>
Fig. 4. Four classes of bursting events and their associated
quad-rants.
The time-averaged instantaneous shear stressτ′(Reynolds
shear stress) at each point of flow is defined as:
τ′ = −ρ u′v′ (3)
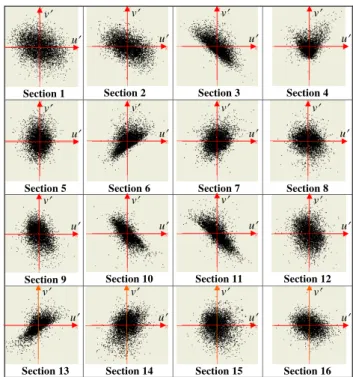
whereρis flow density. As shown in Fig. 5, the distribution of the instantaneous velocities is influenced significantly by presence of ripples.
3.2 Contribution probability of coherent flow and
bursting events
Based on two dimensional velocity fluctuations, the occur-rence probability of the bursting events for each quadrant is defined as;
Pk = nk
N (4)
N =
4
X
k=1
nk (5)
wherePkis the occurrence probability of an event in a quad-rant,nkis the number of occurrences of each event,Nis the total number of events and the subscript represents the indi-vidual quadrants (k= 1 ... 4). Using the above equations, the probability of each quadrant was computed at each point of flow within the depth. The contributions of coherent struc-tures, such as the sweep (quadrant IV) and ejection (quad-rant II) events, to momentum transfer have been extensively studied through quadrant analyses and probability analyses based on two-dimensional velocity information. Using simi-lar techniques, the contributions of the four events to the en-trainment and motion of sediment particles were determined from the experimental measurements. Shown in Figs. 6 and 7 are the quadrant analysis of the frequencies of bursting events along the flume for different depth from the bed.
Section 1 Section 2 Section 3 Section 4
Section 5 Section 6 Section 7 Section 8
Section 9 Section 10 Section 11 Section 12
Section 13 Section 14 Section 15 Section 16
u′ v′
u′ v′
u′ v′
u′ v′
u′ v′
u′ v′
u′ v′
u′ v′
u′ v′
u′ v′
u′ v′
u′ v′
u′ v′
u′ v′
u′ v′
u′ v′
Fig. 5.Distribution of instantaneous velocity fluctuations at 20 mm
from the bed for 16 sections along the flume.
From a quadrant analysis (Figs. 6 and 7) it was found that at a level of 5 mm from the bed downstream of the second rip-ple crest, quadrants 1 and 3 were dominant when compared to quadrants 2 and 4. This can be interpreted as an expecta-tion that sedimentaexpecta-tion should occur at this locaexpecta-tion. How-ever, upstream of the ripple crest, quadrants 2 and 4 were more dominant than quadrants 1 and 3. Therefore entrain-ment would be expected to occur at this location. These ex-pectations are confirmed by measuring sediment particles at the bed over the ripples along the bed.
0 5 10 15 20 25 30 35 40 45 50
0 10 20 30 X (cm)40 50 60 70
C o nt ri bu ti o n P rob a bi li ty ( % ) Q1 Q2 Q3 Q4 h Ripple Geometry
1 2 3 4 5 6 7 8 9 10 11 12 13 14 15 16 Sections
(a)
b)
30 mm Ripple Geometry
1 2 3 4 5 6 7 8 9 10 11 12 13 14 15 16 Sections
(b) 0 5 10 15 20 25 30 35 40 45 50
0 10 20 30 X (cm)40 50 60 70
C o nt ri bu ti o n P ro ba b il it y ( % ) Q1 Q2 Q3 Q4 h
1 2 3 4 5 6 7 8 9 10 11 12 13 14 15 16 Sections
(c) 0 5 10 15 20 25 30 35 40 45 50
0 10 20 30 X (cm)40 50 60 70
C o ntr ibu ti o n P ro b a bi li ty (% ) Q1 Q2 Q3 Q4 h
1 2 3 4 5 6 7 8 9 10 11 12 13 14 15 16 Sections
(d) 0 5 10 15 20 25 30 35 40 45 50
0 10 20 30 X (cm)40 50 60 70
C o ntr ibu ti o n P ro b a bi li ty (% ) Q1 Q2 Q3 Q4 h
1 2 3 4 5 6 7 8 9 10 11 12 13 14 15 16 Sections
(e) 0 5 10 15 20 25 30 35 40 45 50
0 10 20 30 X (cm)40 50 60 70
C o nt ri bu ti o n P ro ba b il it y ( % ) Q1 Q2 Q3 Q4 h
1 2 3 4 5 6 7 8 9 10 11 12 13 14 15 16 Sections
(f) 0 5 10 15 20 25 30 35 40 45 50
0 10 20 30 X (cm)40 50 60 70
C o ntr ibu ti o n P ro b a bi li ty (% ) Q1 Q2 Q3 Q4 h
1 2 3 4 5 6 7 8 9 10 11 12 13 14 15 16 Sections
(g) 0 5 10 15 20 25 30 35 40 45 50
0 10 20 30 X (cm)40 50 60 70
C o ntr ibu ti o n P ro b a b il ity (% ) Q1 Q2 Q3 Q4 h
1 2 3 4 5 6 7 8 9 10 11 12 13 14 15 16 Sections
(h)
Fig. 6. Cyclic phase pattern for different classes of bursting events over the ripples along the flume at:(a)5 mm from the bed;(b)10 mm
from the bed;(c)15 mm from the bed;(d)20 mm from the bed;(e)25 mm from the bed;(f)30 mm from the bed;(g)50 mm from the bed;
(h)60 mm from the bed.
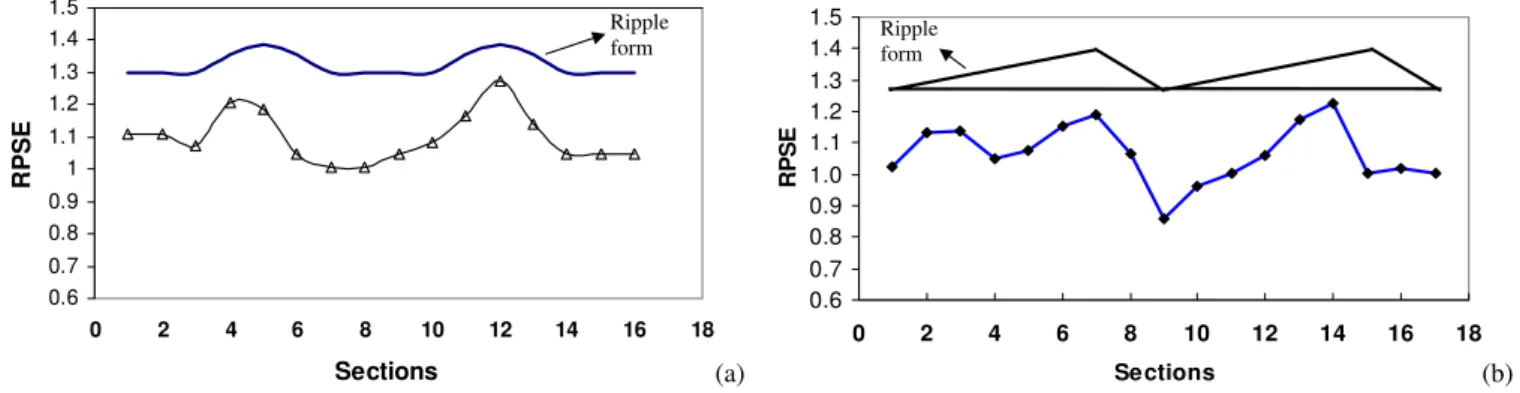
the occurrence probability of the ejection. Mathematically, this ratio is defined as;
RPSE = P4
P2
(6) whereP4is the occurrence probability of the sweep event,
P2 is the occurrence probability of the ejection events and
RPSE is normalized occurrence probability.
Values of the normalised occurrence probability (RPSE) were determined at 5, 10, 15, 20, 25, 30, 50 and 60 mm from the bed surface at multiple locations along the flume. From these values of RPSE, a depth average value was determined.
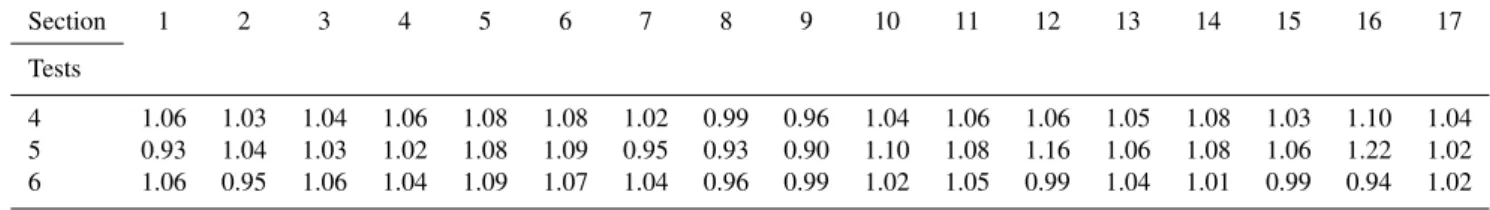
Table 2.Ratio of entrained sediment particles to the deposited particles (RNED) for triangular ripples.
Section 1 2 3 4 5 6 7 8 9 10 11 12 13 14 15 16 17
Tests
4 1.06 1.03 1.04 1.06 1.08 1.08 1.02 0.99 0.96 1.04 1.06 1.06 1.05 1.08 1.03 1.10 1.04
5 0.93 1.04 1.03 1.02 1.08 1.09 0.95 0.93 0.90 1.10 1.08 1.16 1.06 1.08 1.06 1.22 1.02
6 1.06 0.95 1.06 1.04 1.09 1.07 1.04 0.96 0.99 1.02 1.05 0.99 1.04 1.01 0.99 0.94 1.02
a) (a)
b)
(b)
(c) (d)
e) (e)
f) (f)
g) (g) (h)
Fig. 7. Distribution of probability of four quadrants; (a)zone 1,(b) zone 2,(c)zone 3 and(d)zone 4 (Test 2);(e)zone 1,(f)zone 2,
a)
0.6 0.7 0.8 0.9 1 1.1 1.2 1.3 1.4 1.5
0 2 4 6 8 10 12 14 16 18
Sections
R
PSE
Ripple form
(a)
0.6 0.7 0.8 0.9 1.0 1.1 1.2 1.3 1.4 1.5
0 2 4 6 8 10 12 14 16 18
Sections
RP
S
E
Ripple form
(b)
Fig. 8.The ratio of phase probability of sweep to ejection events (RPSE) over ripples(a)the sinusoidal ripple form;(b)the triangular ripple
form.
(a) (b)
Fig. 9.Two samples of sequential captured images with the difference image between two sequential images.
3.3 Number of entrained and deposited particles over
the ripples
In this study, to understand sediment entrainment at the bed and over the ripples, an image processing technique was used to compute number of deposited and entrained sediment par-ticles at the different wavelength and different points over the ripples. Artificial ripples are used here to make the pos-sibility of particle motion. A CCD camera is used to capture sequential images in 60 s and then the images are simulta-neously recorded in the camera. Therefore, with a rate of 25 frames per second a total of 1500 images were recorded. Two samples of sequential recorded image are shown in Fig. 9.
To find the number of entrained and deposited particles an image analysis concept is used to compute sequential im-ages and to produce an image highlighting the differences. In the images differences, the black points represent parti-cles which have been entrained and white points represent particles which are deposited. As a result, from the produced image, the numbers of entrained and deposited particles were counted. An example of the difference between two images is shown in Fig. 9. The detail of this image processing tech-nique is described by Keshavarzi and Ball (1999). The ra-tio of the number of entrained sediment particles to the de-posited sediment are defined as;
RNED = Number of entrained sediment particles
Number of deposited sediment particles. (7)
0.8 0.9 0.9 1.0 1.0 1.1 1.1 1.2 1.2
0 2 4 6 8 10 12 14 16 18
Sections
RNED
Fig. 10.Ratio of entrained particles to deposited particles (RNED)
over ripples.
Table 2 shows the ratio of entrained/deposited number of particles over the ripples for different experimental tests. Figure 10 shows the variation of RNED over the ripples along the flume. The results indicated that the ratio of en-trained/deposited sediment particles (RNED) is very much correlated with the ratio of the probability of sweep/ejection events (RPSE) over the ripples.
4 Conclusion
In this study, the flow structure over the ripples was investi-gated experimentally. Consideration of these results showed that upstream of the first ripple crest, bursting events in quadrants 2 and 4 are dominant, however, downstream of the ripple crest, the bursting events in quadrants 1 and 3 are dominant and that sediment deposition occurred downstream of the ripple crest. Additionally, it was found that the average normalized occurrence probabilities of sweep event are in phase with the bed form whereas the normalized occurrence probabilities of ejection event are out of phase with the bed form. The number of entrained and deposited sediment particles was found also to be in agreement with the frequency of the bursting events. The above finding is an initiation of defining a simple model for bursting events, however, it remains to test these findings for the sit-uation of more than two ripples and differing flow conditions.
Acknowledgements. The authors acknowledge Mr Saeed Jafari Mi-anaei, for collecting some parts of laboratory data. Also helps from Reza Keshavarzi for capturing and analysis of the images are greatly appreciated. Finally the writers would like to thank the anonymous reviewers and Paolo Perona who provided many useful comments.
Edited by: P. Perona
References
Arlinghaus, R., Engelhardt, C., Sukhodolov, A., and Wolter, C.: Fish recruitment in a canal with intensive navigation: Implica-tions for ecosystem management, J. Fish Biol., 61, 1386–1402, 2002.
Armstrong, J. D., Kemp, P. S., Kennedy, G. J. A., Ladle, M., and Milner, N. J.: Habitat requirements of Atlantic salmon and brown trout in rivers and streams, Fish. Res., 62, 143–170, 2003. Bagnold, R. A.: Motion of waves in shallow water: interaction
be-tween waves and sand bottoms, P. Roy. Soc. Lond. A, 187, 1–18, 1946.
Bennett, S. and Best, J.: Mean flow and turbulence structure over fixed, two-dimensional dunes; implications for sediment trans-port and bed form stability, Sedimentology, 42, 491–513, 1995. Bennett, S. and Best, J.: Mean flow and turbulence structure over
fixed ripples and the ripple–dune transition, in: Coherent flow in open channels, edited by: Ashworth, P., Bennett, S., Best, J., and McLelland, S., John Wiley, Hoboken, NJ, 281–203, 1996. Box, G. E. P. and Cox, D. R.: An Analysis of Transformation, J.
Roy. Stat. Soc. B, 26, 211–252, 1964.
Bridge, J. S. and Bennett, S. J.: A model for entrainment and trans-port of sediment grains of mixed sizes, shapes and densities, Wa-ter Resour. Res., 28, 337–363, 1992.
Carling, P., Golz, E., Orr, H. G., and Radecki-Pawlik, A.: The mor-phodynamics of fluvial sand dunes in the Ripple-dune transition 647 Rhine River, near Mainz, Germany, II. Hydrodynamics and sediment transport, Sedimentology, 47, 253–278, 2000.
Carstens, M. R., Neilson, F. M., and Altinbilek, H. D.: Bed forms generated in the laboratory under an oscillatory flow: analytical and experimental study, US Army Corps of Engineers, Coastal Engineering Research Center, Tech. Memo 28, p.105, 1969. Colombini, M. and Stocchino, A.: Ripple and dune formation in
rivers, J. Fluid Mech., 673, 121–131, 2011.
Drake, T. G., Shreve, R. L., Dietrich, W. E., Whiting, P. J., and Leopold, L. B.: Bed load transport of fine gravel observed by motion-picture photography, J. Fluid Mech., 192, 193–217, 1988.
Grass, A. J.: Structural features of turbulent flow over smooth and rough boundaries, J. Fluid Mech., 50, 233–255, 1971.
Hurther, D., Lemmin, U., and Terray, E. A.: Turbulent transport in the outer region of rough wall open-channel flows: the contribu-tion of Large Coherent Shear Stress Structures (LC3S), J. Fluid Mech., 574, 465–493, 2007.
Hurther, D., Thorne, P. D., Bricault, M., Lemmin, U., and Barnoud, J. M.: A multi-frequency Acoustic Concentration and Velocity Profiler (ACVP) for boundary layer measurements of fine-scale flow and sediment transport processes, Coast. Eng., 58, 594–605, 2011.
Jafari Mianaei, S. and Keshavarzi, A.: Spatio-temporal variation of transition probability of bursting events over the ripples at the bed of open channel, J. Stoch. Environ. Res. Risk A., 22, 257–264, 2008.
Jafari Mianaei, S. and Keshavarzi, A.: Study of near bed stochas-tic turbulence and sediment entrainment over the ripples at the bed of open channel using image processing technique, J. Stoch. Environ. Res. Risk A., 24, 591–598, 2010.
Julien, P. and Klassen, G.: Sand-dune geometry of large rivers dur-ing floods, J. Hydraul. Eng.-ASCE, 121, 657–663, 1995. Keshavarzi, A. R. and Ball, J. E.: An analysis of the characteristics
of rough bed turbulent shear stress in an open channel flow, J. Stoch. Hydrol. Hydraul., 11, 193–210, 1997.
Keshavarzi, A. R. and Ball, J. E.: An application of image pro-cessing in the study of sediment motion, J Hydraul. Res., 37, 559–576, 1999.
Khelifa, A. and Ouellet, Y.: Prediction of sand ripple geometry under waves and currents, Journal Waterway Port Coast. Ocean Eng., 126, 14–22, 2000.
Kline, S. J., Reynolds, W. C., Schraub, F. A., and Runstadler, P. W.: The structure of turbulent boundary layers, J Fluid Mech., 30, 741–773, 1967.
Knighton, D.: Fluvial Forms and Processes, Arnold, London, Eng-land, 1998.
Kostaschuck, R.: A field study of turbulence and sediment dynam-ics over subaqueous dunes with flow separation, Sedimentology, 47, 519–531, 2000.
Kostaschuck, R. and Church, M.: Macroturbulence generated by dunes, Sediment. Geol., 85, 25–37, 1993.
Kostaschuck, R. and Villard, P.: Flow and sediment transport over large subaqueous dunes, Fraser River, Canada, Sedimentology, 43, 849–863, 1996.
Miller, M. C. and Komar, P. D.: Oscillation sand ripples generated by laboratory apparatus, J. Sediment. Petrol., 50, 173–182, 1980. Murphy, P. J. and Randle, T. J.: Platte River Sediment Transport and Riparian Vegetation Model, Technical Report, US Department of the Interior, Bureau of Reclamation, Denver, Co, 2003. Nakagwa, H. and Nezu, I.: Prediction of the contributions to the
Reynolds stress from bursting events in open-channel flows, J. Fluid Mech., 80, 99–128, 1977.
Nakagwa, H. and Nezu, I.: Bursting phenomenon near the wall in open channel flow and its simple mathematical model, Fac Eng Kyoto University, Japan XL, 40, 213–240, 1978.
Nelson, J. M., Shreve, R. L., McLean, S. R., and Drake, T. G.: Role of near bed turbulence structure in bed load transport and bed form mechanics, Water Resour. Res., 31, 2071–2086, 1995. Nezu, I. and Nakagawa, H.: Turbulence in open channel flows,
IAHR Monograph, Balkema, Rotterdam, 1993.
Nielsen, P.: Coastal bottom boundary layers and sediment transport, World Scientific, 324 pp., 1992.
Nikora, V.: Hydrodynamics of aquatic systems: An interface be-tween ecology, biomechanics and environmental fluid mechan-ics, River Res. Appl., 26, 367–384, 2010.
Ojha, S. P. and Mazumder, B. S.: Turbulence characteristics of flow region over a series of 2-D dune shaped structures, Adv. Water Resour., 31, 561–576, 2008.
Offen, G. R. and Kline, S. J.: A proposed model of the bursting process in turbulent boundary layers, J. Fluid Mech., 70, 209– 228, 1975.
Papanicolaou, A. N., Diplas, P., Evaggelopoulos, N., and Fotopou-los, S.: Stochastic incipient motion criterion for spheres under various packing conditions, J. Hydraul. Eng.-ASCE, 128, 369– 380, 2002.
Perona, P., Porporato, A., and Ridolfi, L.: A simple experimen-tal equation for the bursting cycle, Phys. Fluids, 10, 3023–3026, 1998.
Raudkivi, A.: Ripples of stream bed, J. Hydraul. Eng.-ASCE, 123, 58–64, 1997.
Sajjadi, S. G., Aldridge, J. N., and Nicholas, D. J.: Sediment trans-port mechanism over rippled sand beds, in: Estuarine and coastal modelling, edited by: Spaulding, M. L. and Cheng, R. T., ASCE, New York, 669–680, 1996.
Termini, D. and Sammartano, V.: Sediment flow interactions and ef-fects on bed forms mechanism, 7th ISE & 8th HIC, Chile, 2009. Thorne, P. D., Williams, J. J., and Heathershaw, A. D.: In situ
acous-tic measurements of marine gravel threshold and transport, Sed-imentology, 36, 61–74, 1989.
Thorne, P. D., Davies, J. S., and Bell, P. S.: Observations
and analysis of sediment diffusivity profiles over sandy rip-pled beds under waves, J. Geophys. Res., 114, C02023, doi:10.1029/2008JC004944, 2009.
Venditti, J. G., Church, M. A., and Bennett, S. J.: Bed form ini-tiation from a flat sand bed, J. Geophys. Res., 110, F01009, doi:10.1029/2004JF000149, 2005.
Yalin, M. S.: On the determination of ripple length, Proc. Am. Soc. Civil Eng., 103, 439–442, 1977.