O R I G I N A L A R T I C L E S UDC: 617.7-07::617.7-007.681 DOI: 10.2298/VSP150218068T
Optical coherence tomography in the evaluation of structural changes
in primary open-angle glaucoma with and without elevated
intraocular pressure
Opti
č
ka koherentna tomografija u proceni strukturnih promena kod primarnog
glaukoma otvorenog ugla sa i bez povišenog intraokularnog pritiska
Marija Trenkić Božinović*, Gordana Zlatanović*†, Predrag Jovanović*†, Dragan Veselinović*†, Jasmina Djordjević Jocić*†, Marija Radenković*,
Mirko Resan‡§
*Ophthalmology Clinic, University Medical Center Niš, Niš, Serbia; †Faculty of Medicine, University of Niš, Niš, Serbia; ‡Ophthalmology Clinic, Military Medical Academy, Belgrade, Serbia; §Faculty of Medicine of the Military Medical Academy,
University of Defence, Belgrade, Serbia
Abstract
Background/Aim. Glaucoma is a progressive optic neu-ropathy characterized by damage of the retinal ganglion cells and their axons and glial cells.The aim of this study was to evaluate the differences and connections between changes in the visual field and the thickness of the peripapillary reti-nal nerve fiber layer (RNFL), using optical coherence tomo-graphy (OCT) in patients with primary open-angle glau-coma with normal and elevated intraocular pressure (IOP).
Methods. This prospective study included 38 patients (38 eyes) with primary open-angle glaucoma with normal in-traocular pressure (NTG) and 50 patients (50 eyes) with pri-mary open-angle glaucoma with elevated intraocular pres-sure (HTG), paired by the same degree of structural glau-comatous changes in the optic nerve head and by age. OCT protocols ’fast RNFL thickness’ and ’fast optic disc’ were used for testing. The patients’ age, gender, best corrected visual acuity (BCVA), IOP, stereometric and functional pa-rameters were compared. Results. The average age of the examined population was 65.49 ± 9.36 (range 44–83) years. There was no statistically significant difference by age and
by gender between the two study groups (p = 0.795 and p = 0.807, respectively). BCVA was higher in patients with NTG but there was no statistically significant difference compared to HTG patients (p = 0.160). IOP was statistically significantly higher in patients with HTG compared to NTG patients (17.40 ± 2.77 mmHg vs 14.95 ± 3.01 mmHg,
p = 0.009). The cup/disc (C/D) (p = 0.258), mean deviation (MD) (p = 0.477), corrected patern standard deviation (CPSD) (p = 0.943), disk area (p = 0.515), rim area (p = 0.294), rim volume (p = 0.118), C/D area R (p = 0.103), RNFL Average (p = 0.632), RNFL Superior (p = 0.283) and RNFL Inferior (p = 0.488) were not statistically significantly different between the groups. Conclusion. OCT measure-ments of the RNFL thickness provide clinically significant information in monitoring of glaucomatous changes. There are no differences in the patterns of RNFL defects per sec-tors and quadrants between NTG and HTG, measured by OCT.
Key words:
glaucoma, open-angle; intraocular pressure; tomography, optical coherence.
Apstrakt
Uvod/Cilj. Glaukom je progresivna optička neuropatija koja oštećuje retinalne ganglijske ćelije i njihove aksone i glijalne
ćelije. Cilj rada bio je da se procene razlike i veze između promena u vidnom polju i debljine peripapilarnih nervnih vlakana retine (RNFL), uz pomoć optičke koherentne tomo-grafije (OCT), kod obolelih od primarnog glaukoma otvore-nog ugla sa normalnim i povišenim intraokularnim pritiskom (IOP). Metode. U ovu prospektivnu studiju bilo je uključeno
65,49 ± 9,36 (opseg 44–83) godine. Utvrđeno je da ne postoji statistički značajna razlika prema starosti i prema polu između dve ispitivane grupe (p = 0,795, odnosno p = 0,807). BCVA je bila veća kod bolesnika sa NTG, ali nije bilo statistički
zna-čajne razlike u odnosu na HTG bolesnike (p = 0,160). IOP je bio statistički značajno viši kod bolesnika sa HTG u odnosu na NTG bolesnike (17,40 ± 2,77 mmHg vs 14,95 ± 3,01 mmHg, p = 0,009). Vrednosti cup/disc (C/D) (p = 0,258), me-an deviation (MD) (p = 0,477), corrected pattern standard deviation
(CPSD) (p = 0,943), disk area (p = 0,515), rim area (p = 0,294),
rim volume (p = 0,118), C/D area R (p = 0,103), RNFL Average
(p = 0,632), RNFL Superior (p = 0,283) i RNFL Inferior (p = 0,488) nisu se statistički značajno razlikovale između ispitiva-nih grupa. Zaključak. Pomoću OCT dobijeni parametri deb-ljine RNFL obezbeđuju klinički važne informacije u praćenju glaukomnih promena. Ne postoje razlike u defektu RNFL po sektorima i kvadrantima između NTG i HTG bolesnika me-renih OCT procedurom.
Ključne reči:
glaukom, otvorenog ugla; intraokularni pritisak; tomografija, optička, koherentna.
Introduction
Glaucoma is a progressive optic neuropathy characteri-zed by damage of the retinal ganglion cells and their axons and glial cells 1–3. This leads to morphological changes of the optic nerve head (ONH) and the accompanying changes in the visual field 4. Primary open-angle glaucoma (POAG) is the most common glaucoma type. Although, elevated intrao-cular pressure (IOP) is considered as one of the main causes of the occurrence of glaucoma, POAG in elderly patiens may occur with elevated intraocular pressure (HTG), normal in-traocular pressure (NTG) as well as ocular hypertension (OH) 5, 6. Despite the numerous technical possibilities for tes-ting the morphological and functional changes in glaucoma, POAG with and POAG without elevated IOP is a field in which many scientific results and opinions are opposite. Numerous studies, both past and present, have shown that the structural and functional changes in patients with HTG and NTG are almost identical 7–11, as well as being completely different 12–22.
Optical coherence tomography (OCT) is a contactless, non-invasive diagnostic procedure, that can be repeated number of times 23–27. OCT provides measurements of the thickness of the retinal nerve fiber layer, the loss of 25% of which, occurs in the early stages of glaucoma 4, 28. Some aut-hors have shown that the loss of as much as 40% to 50% of the nerve fibers of the optic nerve does not have to be ac-companied by changes in the visual field 28. Because of this change, RNFL thickness is considered as the most sensitive indicator for glaucomatous damage 29.
Yamazaki et al. 30, and Woo et al. 31 demonstrated the different patterns of retinal nerve fiber layer (RNFL) defects in patients with HTG compared to patients with NTG, ie. in NTG the defects are more localized. However, Kubota et al. 32, and Kook et al. 33 reported that there was a symmetrical loss of RNFL in the superior and inferior quadrants in POAG patients with elevated IOP. In contrast to all this, Mok et al. 1, 34 reported that there are no differences in RNFL thin-ning pattern in HTG and NTG; it was a mixture of localized and diffuse RNFL defects in both cases 29.
The aim of this study was to evaluate the differences and connections between changes in the visual field and the thickness of the peripapillary retinal nerve fiber layer, mea-sured by OCT in POAG patients with normal and elevated IOP.
Methods
This prospective study included 38 eyes (38 patients) suffering from POAG with normal IOP (NTG) and 50 eyes (50 patients) suffering from POAG with elevated IOP (HTG), paired by the degree of structural glaucomatous changes of the optic nerve head and by age. The selection and monitoring of the patients was performed at the Depar-tment of Ophthalmology, University Medical Center Niš. The research followed the Declaration of Helsinki and was approved by the Ethical Review Board of Clinical Center Niš.
All of the patients had the previous diagnosis of POAG with elevated or normal IOP. Exclusion criteria were: spheri-cal equivalent > ± 4 Dsph, other ocular diseases, ocular surgery performed in the previous year, laser treatment, tra-uma, secondary glaucoma, neurological diseases with chan-ges in the visual field, patients with unreliable visual field (defined as false-negative errors >33%, false-positive errors > 33%, and fixation losses > 20%), patients with anomalies of the optic nerve head. If both eyes of the patients satisfied the inclusion criteria, only one eye was randomly selected.
The following demographic and stereometric parame-ters were measured and studied here: the patients' age (years); gender; best corrected visual acuity (BCVA) deter-mined by Snellen; IOP (in mmHg) measured by applanation tonometry; the size of the optic nerve head excavation (cup/disc - C/D) determined by indirect ophthalmoscopy with 90 D lens; the value of mean deviation (MD, in dB) and corrected pattern standard deviation (CPSD, in dB) obtained by computed (static) perimetry; disc area (in mm2), rim area (in mm2), rim volume (in mm3), C/D area ratio, the global average thickness of peripapillary retinal nerve fibers (RNFL Avg, in µm) and average RNFL thickness (in µm) in four quadrants and all sectors measured by OCT.
Static perimetry, Humphrey visual field analyzer (Carl Zeiss Meditec, Inc., treshold test 24-2), was used to reveal the defects in the visual field of patients. The first visual field was never considered with regard to the learning curve.
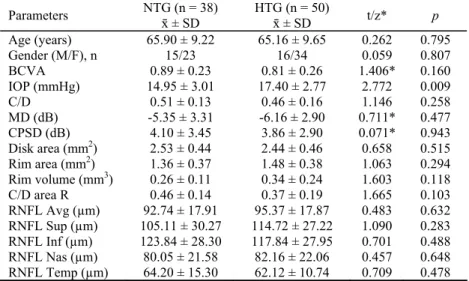
Table 1 Demographic and stereometric parameters of primary open-angle glaucoma (POAG) of the patients
with normal intraocular pressure (NTG) and elevated intraocular pressure (HTG)
Parameters NTG (n = 38) ґ ± SD
HTG (n = 50)
ґ ± SD t/z* p
Age (years) 65.90 ± 9.22 65.16 ± 9.65 0.262 0.795
Gender (M/F), n 15/23 16/34 0.059 0.807
BCVA 0.89 ± 0.23 0.81 ± 0.26 1.406* 0.160
IOP (mmHg) 14.95 ± 3.01 17.40 ± 2.77 2.772 0.009
C/D 0.51 ± 0.13 0.46 ± 0.16 1.146 0.258
MD (dB) -5.35 ± 3.31 -6.16 ± 2.90 0.711* 0.477 CPSD (dB) 4.10 ± 3.45 3.86 ± 2.90 0.071* 0.943 Disk area (mm2) 2.53 ± 0.44 2.44 ± 0.46 0.658 0.515 Rim area (mm2) 1.36 ± 0.37 1.48 ± 0.38 1.063 0.294 Rim volume (mm3) 0.26 ± 0.11 0.34 ± 0.24 1.603 0.118 C/D area R 0.46 ± 0.14 0.37 ± 0.19 1.665 0.103 RNFL Avg (µm) 92.74 ± 17.91 95.37 ± 17.87 0.483 0.632 RNFL Sup (µm) 105.11 ± 30.27 114.72 ± 27.22 1.090 0.283 RNFL Inf (µm) 123.84 ± 28.30 117.84 ± 27.95 0.701 0.488 RNFL Nas (µm) 80.05 ± 21.58 82.16 ± 22.06 0.457 0.648 RNFL Temp (µm) 64.20 ± 15.30 62.12 ± 10.74 0.709 0.478 and provides better reproducibility than single scan. Scans were
further analyzed using the RNFL thickness average analysis pro-tocol (OU). The propro-tocol quantifies the average RNFL thickness (360° measure), as well as 12 clock-hour sectoral measures (30°): 1 clock-hour: supero-nasal (15 to 45°), 2: nasal-superior (45 to 75°), 3: nasal (75–105°), 4: nasal-inferior (105–135°), 5: inferonasal (135–165°), 6: inferior (165–195°), 7: inferotempo-ral (195–225°), 8: tempo-inferior (225–255°), 9: tempoinferotempo-ral (255– 285°), 10: tempo-superior (285–315°), 11: superotemporal (315–345°), 12: superior (345–15°). Three adjacent measures are then averaged (clock hours 11, 12, 1; 2, 3, 4; 5, 6, 7; 8, 9, 10) to provide four quadrant thickness values. One author performed all the images and measurements.
The data are shown as arithmetic means and standard deviations. The comparison of the values between patients with NTG and HTG was carried out using t-test or Mann-Whiteney test. The association of these parameters was tes-ted by Spearman’s correlation coefficient. Statistical analysis of data was performed by SPSS (version 16.0, SPSS Science, Chicago, IL, USA). p-value < 0.05 was considered statistically significant.
Results
The study included 38 (43.18%) NTG patients and 50 (56.82%) HTG patients. The average age of the examined popu-lation was 65.49 ± 9.36 (range 44–83) years. No statistically si-gnificant difference by age and by gender was found between
the two study groups (p = 0.795 and p = 0.807, respectively) (Table 1).
In the group of NTG patients, the therapy of 32 (84.21%) patients included one anti-glaucomatous topical medication (81.25% α-agonist, 18.75% carbonic anhydrase inhibitor), four patients (10.53%) received two medications, and two patients (5.26%) received three medications. In the second group, HTG patients were on the following therapy: 12 (24.00%) patients received one medication, 16 (32.%) patients two medications, and 22 (44%) patients three medications.
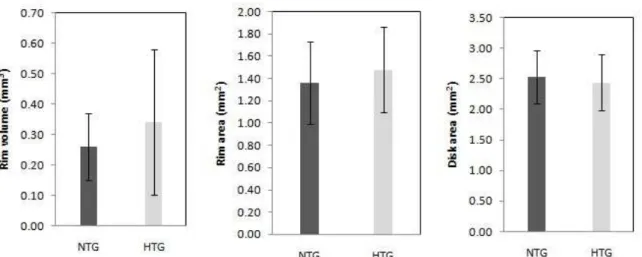
Best corrected visual acuity was higher in patients with NTG but there was no statistically significant difference com-pared to HTG patients (p = 0.160). IOP with the prescribed therapy was significantly higher in patients with HTG compa-red to NTG patients (17.40 ± 2.77 mmHg vs 14.95 ± 3.01 mmHg, p = 0.009). The morphological parameters of the optic nerve head, due to the examination of the fundus with the 90D lens, C/D, were not statistically significantly different between the patients with HTG and NTG (p = 0.258). Changes in the visual field, ie. functional parameters: MD (p = 0.477) and CPSD (p = 0.943) did not show any statistical significance. Stereometric ONH parameters obtained by OCT: disk area (p = 0.515), rim area (p = 0.294), rim volume (p = 0.118), C/D area R (p = 0.103), RNFL Avg (p = 0.632), RNFL Superior (RNFL Sup) (p = 0.283) and RNFL Inferior (RNFL Inf) (p = 0.488) were not statistically significantly different between the groups (Table 1, Figure 1).
Fig. 1 – Rim volume, rim area and disc area in normal intraocular pressure (NTG) and elevated intraocular pressure (HTG) patients showing no statistically significant difference between NTG and HTG groups.
(rim volume: p = 0.118; rim area: p = 0.294; disc area: p = 0.515).
Table 2 The thickness (µm) of the peripapillary retinal nerve fiber layer (RNFL) in
the normal intraocular pressure (NTG) and elevated intraocular pressure (HTG) patients on optical coherence tomography (OCT) Clock-hour
sectoral measures
NTG (n = 38) ґ ± SD
HTG (n = 50)
ґ ± SD p*
1 93.70 ± 30.58 109.64 ± 32.49 0.100
2 88.75 ± 23.72 91.92 ± 26.02 0.631
3 64.40 ± 21.12 69.04 ± 18.89 0.411
4 82.05 ± 26.09 85.40 ± 28.78 0.568
5 110.80 ± 28.18 107.52 ± 35.37 0.706 6 132.65 ± 40.58 121.76 ± 34.86 0.723 7 123.55 ± 46.18 115.48 ± 24.94 0.213
8 65.65 ± 21.32 62.64 ± 11.42 0.267
9 49.00 ± 14.26 49.60 ± 9.80 0.936
10 74.85 ± 20.64 73.72 ± 15.48 0.973
11 111.20 ± 34.75 115.32 ± 24.51 0.749 12 107.55 ± 39.89 121.32 ± 37.24 0.320 The average global and quadrant, and sectoral RNFL
thickness values were compared between the groups of NTG and HTG patients; no statistically significant difference in the values of the thickness of RNFL as per quadrant and sec-tors was found (Tables 1 and 2).
The correlation analysis of the structural and functional parameters in patients with NTG and HTG was performed by Spearman’s correlation coefficient (Tables 3 and 4). A statistically significant positive correlation in the group of NTG patients was found between RNFL Avg and rim volume (p = 0.713, p = 0.001), RNFL Avg and rim area (p = 0.847, p < 0.001), RNFL Sup and rim area (p = 0.522, p = 0.022), RNFL Inf and RNFL Nasal (RNFL Nas) (p = 0.595, p <
0.001), RNFL Inf and RNFL Temporal (RFNL Temp) (p = 0.574, p = 0.010), RNFL Inf and rim volume (p = 0.462, p = 0.047), RNFL Inf and rim area (p = 0.674, p = 0.002), RNFL Nas and rim volume (p = 0.702, p = 0.001), RNFL Nas and rim area (p = 0.547, p = 0.015), RNFL Temp and rim area (p = 0.651, p = 0.003), RNFL Avg and disk area (p = 0.634, p = 0.004), RNFL Sup and disk area (p = 0.778, p < 0.005) (Table 3).
A statistically significant positive correlation in the group of HTG patients was found between RNFL Avg and rim volume (p = 0.627, p = 0.001), RNFL Avg and rim area (p = 0.467, p = 0.019), RNFL Sup and RNFL Nas (p = 0.420, p = 0.036), RNFL Sup and rim volume (p = 0.484, p = 0.014), RNFL Inf and RNFL Nas (p = 0.594, p = 0.002),
*Mann-Whitney U test.
Table 3 Correlation analysis of the structural and functional parameters in the patients
with normal intraocular pressure (NTG)
Parameters Rim volume Rim area Disk area MD CPSD RNFL Avg 0.713** 0.847** 0.634** 0.450 -0.166‡
p 0.001 < 0.001 0.004 0.053 0.496†
RNFL Sup 0.269 0.522* 0.778** 0.400 -0.218
p 0.266 0.022 < 0.001 0.090 0.369
RNFL Inf 0.462* 0.674** 0.158 0.450 -0.111
p 0.047 0.002 0.519 0.053 0.651
RNFL Nas 0.702** 0.547** 0.161 0.099 0.187
p 0.001 0.015 0.499 0.686 0.443
RNFL Temp 0.437 0.651** -0.059 0.340 -0.246
p 0.061 0.003 0.810 0.155 0.310
RIM VOLUME - 0.729** 0.551* 0.059 0.060
p < 0.001 0.015 0.811 0.808
RIM AREA - 0.293 0.449 -0.307
p 0.223 0.054 0.201
MD 0.279 - -0.564*
p 0.247 0.012
Data are presented as Spearman’s coefficient; * – statistically significant; ** – statistically highly significant.
RNFL – retinal nerve fiber layer; RNFL Avg – RNFL-Average; RNFL Sup – RNFL-Superior; RNFL Inf – RNFL Inferior; RNFL Nas – RNFL-Nasal; RNFL Temp – RNFL – Temporal; MD – mean deviation; CPSD – corrected pattern standard deviation.
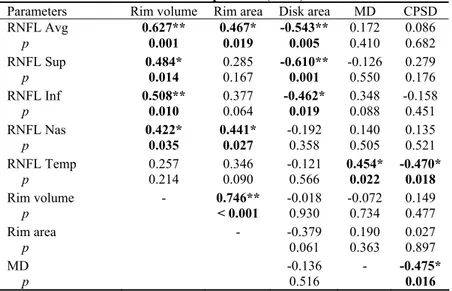
Table 4 Correlation analysis of the studied parameters in the patients with elevated
intraocular pressure (HTG)
Parameters Rim volume Rim area Disk area MD CPSD
RNFL Avg 0.627** 0.467* -0.543** 0.172 0.086
p 0.001 0.019 0.005 0.410 0.682
RNFL Sup 0.484* 0.285 -0.610** -0.126 0.279
p 0.014 0.167 0.001 0.550 0.176
RNFL Inf 0.508** 0.377 -0.462* 0.348 -0.158
p 0.010 0.064 0.019 0.088 0.451
RNFL Nas 0.422* 0.441* -0.192 0.140 0.135
p 0.035 0.027 0.358 0.505 0.521
RNFL Temp 0.257 0.346 -0.121 0.454* -0.470*
p 0.214 0.090 0.566 0.022 0.018
Rim volume - 0.746** -0.018 -0.072 0.149
p < 0.001 0.930 0.734 0.477
Rim area - -0.379 0.190 0.027
p 0.061 0.363 0.897
MD -0.136 - -0.475*
p 0.516 0.016
For explanation see under Table 3.
RNFL Inf and RNFL Temp (ρ = 0.418, p = 0.038), RNFL Inf and rim volume (ρ = 0.508, p = 0.010), RNFL Nas and rim volume (ρ = 0.422, p = 0.035), RNFL Nas and rim area (ρ = 0.441, p = 0.027), RNFL Temp and MD (ρ = 0.454, p = 0.022). The strongest correlation was found between RNFL Avg and RNFL Inf (ρ = 0.801, p < 0.001). A statistically
sig-Temp and CPSD (ρ = -0.470, p = 0.018), RNFL Avg and disk area (ρ = -0.543, p = 0.005), RNFL Sup and disk area (ρ = -0.610, p = 0.001), RNFL Inf and disk area (ρ = -0.462, p = 0.019) (Table 4).
Fig. 2 – Thickness of the retinal nerve fiber layer average (RNFL Avg) (µm) plotted versus the rim area (mm2) for the normal intraocular pressure (NTG) and elevated in-traocular pressure (HTG) patients (NTG: ρ = 0.847,
p < 0.001; HTG:ρ = 0.467, p = 0.019).
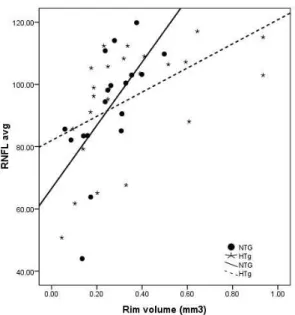
Fig. 3 – Thickness of the retinal nerve fiber layer average (RNFL Avg) (µm) plotted versus the rim volume (mm3) for the normal intraocular pressure (NTG) and elevated
intraocular pressure (HTG) patients (NTG: ρ = 0.713, p = 0.001; HTG: ρ = 0.627, p = 0.001).
Fig. 4 – Mean deviation (MD) in dB plotted versus the rim area for the normal intraocular pressure (NTG) and
ele-vated intraocular pressure (HTG) patients (NTG: ρ = 0.449, p = 0.054; HTG:ρ = 0.190, p = 0.363).
Fig. 5 – Thickness of the retinal nerve fiber layer average (RNFL Avg) (µm) plotted versusthe mean deviation (MD, dB) for normal intraocular pressure (NTG) and elevated
in-traocular pressure (HTG) patients
(NTG: ρ = 0.450, p = 0.053; HTG:ρ = 0.172, p = 0.410). tients with HTG, RNFL Avg and rim area (ρ = 0.467, p =
0.019) (Figure 2). The correlation between RNFL Avg thick-ness and rim volume showed statistical significance in both groups of patients (NTG: ρ = 0.713, p = 0.001, HTG: ρ = 0.627, p = 0.001) (Figure 3).
The study of correlation between changes in the visual
Discussion
Glaucoma is associated with the loss of retinal ganglion cells, which manifests as defects in the RNFL. The most im-portant part of glaucoma diagnosis is the evaluation of the thickness of the retinal nerve fibers and changes of the optic disc. This can be assessed by OCT, as a good, objective and repeatable method. Also, OCT with its high axial resolution of 9–10 µm is a much superior method than GDx VCC and Heidelberg retina tomograph (HRT) III 1, 29. For a long time it was thought that there are different patterns of RNFL thin-ning occurring in patients with POAG with elevated IOP and without elevated IOP. Kubota et al. 32 found a difference in RNFL defects in patients with HTG and NTG. RNFL thick-ness was reduced symmetrically in the superior and inferior quadrants in HTG patients, whereas in patients with NTG a more localized RNFL loss in inferior quadrant occurs 32, 35. Quite different results have appeared in recent years: there are no differences in RNFL thinning pattern between HTG and NTG, measured by OCT 29. Our research also shows no differences in the defect pattern (localized or diffuse) of RNFL in HTG and NTG patients, and no differences in the amount of lost retinal nerve fibers of the two groups of pati-ents. The strength of this statement is supplemented by the fact that the patients were at the same disease stage, with the same degree of structural damage of the optic nerve head and the same degree of change in the visual field (MD < 12 dB). In addition, all glaucoma patients had spherical equivalent (SE) within ± 4 Dsph, so the possibility of involving patients with very large or small optic nerve head (ONH) was reduced to a minimum. Our results are consistent with Mok et al. 1, 34, and Konstantakopoulou et al. 29 published results, that patients with HTG and NTG showed a similar RNFL thinning pattern, which is a mixture of diffuse and localized changes, measured by OCT 36.
Studying the localized RNFL loss by clock-hour sectors did not show any statistically significant difference, although this method provides more precise information on smaller fi-elds of peripapillary nerve fiber loss. Furthermore, OCT pa-remeters for inferotemporal and superotemporal sector, which are considered to be of great help for the early diagno-sis of glaucoma and making a difference compared to healthy eyes, did not differ significantly between our groups of HTG and NTG patients 1, 37. The study did not include
pa-tients with ocular hypertension as well as a healthy populati-on because the differences between these two groups of pati-ents with POAG patipati-ents are already tested and proven.
The results from this study related to age, gender, BCVA and morphological parameters of the optic nerve head did not differ significantly between the patients with HTG and NTG, and are fully in line with other publications 2, 29, 34, 38. Only the IOP was significantly lower in patients with NTG (p = 0.009) 2. Häntzschel et al. 2 reported that visual acuity was significantly better in patients with NTG than in patients with HTG (p < 0.002); we found that BCVA was higher in patients with NTG but there was no statistically significant difference compared to HTG patients (p = 0.160), most likely due to better randomizati-on. The sample size for this study is relatively small (38 NTG, 50 HTG), but it is in accordance with the groups studied by ot-her authors: Mok et al. 34 (38 NTG, 48 HTG), and Konstanta-kopoulou et al. 29 (20 NTG, 21 HTG).
Sihota et al. 28 found that defects in the visual field (MD) positively correlate with the thickness of RNFL supe-rior, infesupe-rior, nasal, temporal and average, and that there is a negative correlation between RNFL (average, superior, nasal, inferior, temporal) parameters with CPSD. Shin et al. 38 reported the connection between MD and CPSD and RNFL Avg and RNFL Inf thickness parameters. Our results of two visual field indices (MD and CPSD) showed that there is a statistically significant positive correlation between RNFL Temp and MD (ρ = 0.454, p = 0.022) and negative correlation between RNFL Temp and CPSD (ρ = -0.470, p = 0.018), only in patients with HTG. This diffe-rence could be due to the diffediffe-rence in sample size and be-cause the other authors compared the patients with POAG and healthy population 28.
Conclusion
OCT measurements of RNFL thickness provide clinically significant information in the monitoring of glau-comatous changes. There are no differences in RNFL thin-ning pattern per sectors and quadrants between NTG and HTG, as assessed by OCT. However, further larger studies are needed to supplement these findings view of the fact that it is known that RNFL thickness measurements and morphology of ONH have wide individual and inter-racial variations.
R E F E R E N C E S
1. Mok HK, Wing-Hong LV, So FK. Retinal Nerve Fiber Loss in High- and Normal-Tension Glaucoma by Optical Coherence Tomography. Opto Vis Sci 2004; 81(5): 369−72.
2. Häntzschel J, Terai N, Sorgenfrei F, Haustein M, Pillunat K, Pillunat LE. Morphological and functional differences between nor-mal-tension and high-tension glaucoma. Acta Ophthalmol 2013; 91(5): 386−91.
3. Häntzschel J, Terai N, Furashova O, Pillunat K, Pillunat LE. Comparison of Normal- and High-Tension Glaucoma: Nerve Fiber Layer and Optic Nerve Head Damage. Ophthalmologica 2014; 231(3): 160−5.
4. Sommer A, Katz J, Quigley HA. Clinically Detectable Nerve Fi-ber Atrophy Precedes the Onset of Glaucomatous Field Loss. Arch Ophthalmol 1991; 109(1): 77−81.
5. Gemenetzi M, Yang Y, Lotery AJ. Current concepts on primary open-angle glaucoma genetics: a contribution to disease pa-thophysiology and future treatment. Eye 2011; 26(3): 355−69. 6. Takai Y, Tanito M, Ohira A. Multiplex Cytokine Analysis of
7. Motolko M, Drance SM, Douglas GR. Visual field defects in low-tension glaucoma. Comparison of defects in lowlow-tension glau-coma and chronic open angle glauglau-coma. Arch Ophthalmol 1982; 100(7): 1074−77.
8. Lewis RA, Hayreh SS, Phelps CD. Optic Disk and Visual Field Correlations in Primary Open-Angle and Low-Tension Glau-coma. Am J Ophthalmol 1983; 96(2): 148−52.
9. Miller KM, Quigley HA. Comparison of optic disc features in low-tension and typical open-angle glaucoma. Ophthalmic Surg 1987; 18(12) :882−9.
10.Iester M, Mikelberg FS. Optic nerve head morphologic charac-teristics in high-tension and normal-tension glaucoma. Arch Ophthalmol 1999; 117(8): 1010−3.
11.Nakatsue T, Shirakashi M, Yaoeda K, Funaki S, Funaki H, Fuku-shima A, et al. Optic disc topography as measured by confocal scanning laser ophthalmoscopy and visual field loss in Japa-nese patients with primary open-angle or normal-tension glau-coma. J Glaucoma 2004; 13(4): 291−8.
12.Caprioli J, Spaeth GL. Comparison of visual field defects in the low-tension glaucomas with those in the high-tension glauco-mas. Am J Ophthalmol 1984; 97(6): 730−7.
13.Chauhan BC, Drance SM, Douglas GR, Johnson CA. Visual field damage in normal-tension and high-tension glaucoma. Am J Ophthalmol 1989; 108(6): 636−42.
14.Chauhan BC, McCormick TA, Nicolela MT, LeBlanc RP. Optic disc and visual field changes in a prospective longitudinal study of patients with glaucoma: comparison of scanning laser to-mography with conventional perimetry and optic disc photog-raphy. Arch Ophthalmol 2001; 119(10): 1492−9.
15.Thonginnetra O, Greenstein VC, Chu D, Liebmann JM, Ritch R, Hood DC. Normal Versus High Tension Glaucoma: a Com-parison of Functional and Structural Defects. J Glaucoma 2010; 19(3): 151−7.
16.Hitchings RA, Anderton SA. A comparative study of visual field defects seen in patients with low-tension glaucoma and chron-ic simple glaucoma. Br J Ophthalmol 1983; 67(12): 818−21. 17.Caprioli J, Spaeth GL. Comparison of the optic nerve head in
high- and low-tension glaucoma. Arch Ophthalmol 1985; 103(8): 1145−9.
18.Gramer E, Althaus G, Leydhecker W. Site and depth of glauco-matous visual field defects in relation to the size of the neu-roretinal edge zone of the optic disk in glaucoma without hy-pertension, simple glaucoma, pigmentary glaucoma. A clinical study with the Octopus perimeter 201 and th. Klin Monbl Au-genheilkd 1986; 189(3): 190−8. (German)
19.Yamagami J, Araie M, Shirato S. A comparative study of optic nerve head in low- and high-tension glaucomas. Graefes Arch Clin Exp Ophthalmol 1992; 230(5): 446−50.
20.Araie M, Yamagami J, Suziki Y. Visual field defects in normal-tension and high-normal-tension glaucoma. Ophthalmology 1993; 100(12): 1808−14.
21.Eid TE, Spaeth GL, Moster MR, Augsburger JJ. Quantitative dif-ferences between the optic nerve head and peripapillary retina in low-tension and high-tension primary open-angle glaucoma. Am J Ophthalmol 1997; 124(6): 805−13.
22.Kiriyama N, Ando A, Fukui C, Nambu H, Nishikawa M, Terauchi H, Matsumura M. A comparison of optic disc topographic pa-rameters in patients with primary open angle glaucoma, normal tension glaucoma, and ocular hypertension. Graefes Arch Clin Exp Ophthalmol 2003; 241(7): 541−5.
23.Hee MR, Izatt JA, Swanson EA, Huang D, Schuman JS, Lin CP, et al. Optical coherence tomography of the human retina. Arch Ophthalmol 1995; 113(3): 325−32.
24.Huang D, Swanson EA, Lin CP, Schuman JS, Stinson WG, Chang W, et al. Optical coherence tomography. Science 1991; 254(5035): 1178−81.
25.Schuman JS, Hee MR, Arya AV, Pedut-Kloizman T, Puliafito CA, Fujimoto JG, et al. Optical coherence tomography: a new tool for glaucoma diagnosis. Curr Opin Ophthalmol 1995; 6(2): 89−95.
26.Schuman JS, Pedut-Kloizman T, Hertzmark E, Hee MR, Wilkins JR, Coker JG, et al. Reproducibility of nerve fiber layer thickness measurements using optical coherence tomography. Ophthal-mology 1996; 103(11): 1889−98.
27.Budenz DL, Chang RT, Huang X, Knighton RW, Tielsch JM. Re-producibility of retinal nerve fiber thickness measurements us-ing the stratus OCT in normal and glaucomatous eyes. Invest Ophthalmol Vis Sci 2005; 46(7): 2440−3.
28.Sihota R, Sony P, Gupta V, Dada T, Singh R. Diagnostic capabil-ity of optical coherence tomography in evaluating the degree of glaucomatous retinal nerve fiber damage. Invest Ophthal-mol Vis Sci 2006; 47(5): 2006−10.
29.Konstantakopoulou E, Reeves BC, Fenerty C, Harper RA. Retinal nerve fiber layer measures in high- and normal-tension glau-coma. Optom Vis Sci 2008; 85(7): 538−42.
30.Yamazaki Y, Koide C, Miyazawa T, Kuwagaki N, Yamada H. Comparison of retinal nerve-fiber layer in high- and normal-tension glaucoma. Graefes Arch Clin Exp Ophthalmol 1991; 229(6): 517−20.
31.Woo SJ, Park KH, Kim DM. Comparison of localised nerve fi-bre layer defects in normal tension glaucoma and primary open angle glaucoma. Br J Ophthalmol 2003; 87(6): 695−8. 32.Kubota T, Khalil AK, Honda M, Ito S, Nishioka Y, Inomata H.
Comparative study of retinal nerve fiber layer damage in Japa-nese patients with normal- and high-tension glaucoma. J Glau-coma 1999; 8(6): 363−6.
33.Kook MS, Sung K, Kim S, Park R, Kang W. Study of retinal nerve fibre layer thickness in eyes with high tension glaucoma and hemifield defect. Br J Ophthalmol 2001; 85(10): 1167−70. 34.Mok KH, Lee VW, So KF. Retinal nerve fiber loss pattern in
high-tension glaucoma by optical coherence tomography. J Glaucoma 2003; 12(3): 255−9.
35.Thonginnetra O, Greenstein VC, Chu D, Liebmann JM, Ritch R, Hood DC. Normal versus high tension glaucoma: a comparison of functional and structural defects. J Glaucoma 2010; 19(3): 151−7.
36.Kim DM, Hwang US, Park KH, Kim SH. Retinal nerve fiber layer thickness in the fellow eyes of normal-tension glaucoma patients with unilateral visual field defect. Am J Ophthalmol 2005; 140(1): 165−6.
37.Kanamori A, Nakamura M, Escano MF, Seya R, Maeda H, Negi A. Evaluation of the glaucomatous damage on retinal nerve fiber layer thickness measured by optical coherence tomography. Am J Ophthalmol 2003; 135(4): 513−20.
38.Shin IH, Kang SY, Hong S, Kim SK, Seong GJ, Tak MK, et al. Comparison of OCT and HRT findings among normal, nor-mal tension glaucoma, and high tension glaucoma. Korean J Ophthalmol 2008; 22(4): 236−41.