ISSN 0104-6632 Printed in Brazil
Brazilian Journal
of Chemical
Engineering
Vol. 21, No. 01, pp. 13 - 22, January - March 2004
HEAT TRANSFER IN PACKED BEDS:
EXPERIMENTAL EVALUATION OF
ONE-PHASE WATER FLOW
J. C. Thoméo
1and J. R. Grace
2 1Departamento de Engenharia e Tecnologia de Alimentos, Universidade Estadual Paulista, Rua Cristóvão Colombo 2265, 15054-000, São José do Rio Preto - SP, Brasil.
E-mail: [email protected] 2
Department of Chemical and Biological Engineering, University of British Columbia, Vancouver, Canada V6T 1Z4.
(Received: April 15, 2003 ; Accepted: July 3, 2003)
Abstract - Experimental heat transfer studies were carried out in 50.8 mm diameter packed beds of glass
beads percolated by water and heated from the wall. The tube-to-particle diameter ratio (D/dp) ranged from
1.72 to 13.7 and the water flow rate from 1.1 to 9.9 l/min. Bed heights ranged from 100 mm to 700 mm. The radial temperature was measured above the bed surface by five aligned sheathed thermocouples. Variations in angular temperature were observed, independent of both radial position and particle diameter. Results of repeated tests with the same packing and with repacking did not differ statistically. The radial temperature profile at the bed entrance, measured by a ring-shaped sensor, was uniform except very close to the tube wall.
Keywords: heat transfer, one-phase water flow, radial temperature profile.
INTRODUCTION
Heat transfer studies in packed beds with liquid flow are crucial for biochemical reactors. In these systems, both reactor selectivity and velocity as well as biocatalyst activity and stability depend largely on bed temperature. Many kinetic parameters, e.g. maximum reaction velocities and reaction constants, have an Arrhenius-type thermal dependence (Ashley et al., 1999; Faqir and Attarakih, 2002). Thus, knowledge of temperature profiles within the bed and the heat removal rate is essential to achieve reactor productivity and product homogeneity.
Few previous articles have dealt specifically with liquids percolating through a packed bed (Yagi et al, 1964; Gunn and Sabri, 1987; Lamine et al., 1992a). Some work on two-phase gas-liquid flow provides limited results for liquids (e.g. Weekman and Myers, 1965; Hashimoto et al., 1976; Nakamura et al., 1981; Silveira, 1991; Freire et al., 1991; Lamine et al., 1992b). However, none of these articles considers special features that affect heat transfer
when a liquid flows through a packed bed. On the other hand, there are a number of studies on gas flow discussing experimental, statistical and theoretical aspects, and the results are quite conclusive (e.g. see Tsotsas and Schlünder, 1990; Borkink et al., 1992; Freiwald and Paterson, 1992; Thoméo and Freire, 2000).
In this paper, beds of glass beads were percolated by water at low and moderate flow rates. The tube-to-particle diameter ratio ranged from values that minimise wall effects to those where wall effects profoundly influence bed structure. The outlet bed temperature was measured above the bed surface at many angular and radial positions. The radial temperature profile was also measured at the bed entrance. The results indicate that the thermal behaviour for liquid flow differs significantly from that for gas flow.
MATERIALS AND METHODS
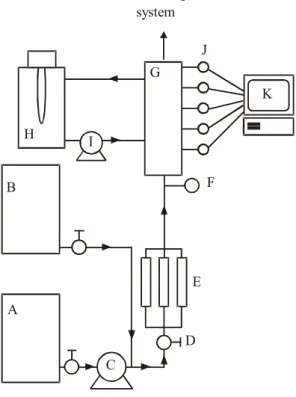
A or B, depending on the desired flow rate. Tank B was used for lower flow rates; it was placed on a metallic frame, 5 m high, and water flowed into the system by gravity. Tank A was used for higher flow rates; in this case, water was pumped into the bed by a centrifugal pump (C). The flow rate was controlled by a globe valve (D) and measured by rotameters (E). The temperature of the water was measured by a thermocouple PT100 (F) just before entering the measuring cell (G). After percolating through the bed, the water was discharged into the sewer. The heating system was composed of an immersion heater in the tank (H) and a centrifugal pump (I) that delivered the hot water to the cell jacket. Bed temperatures were measured by thermocouples (J) and recorded by a data acquisition system (K).
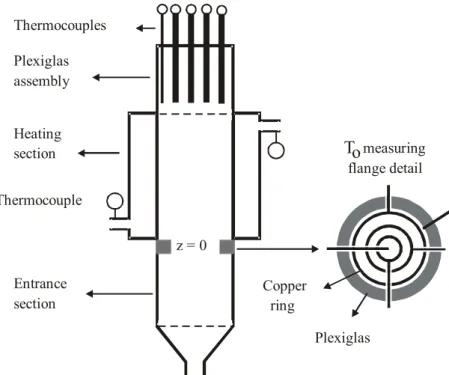
Figure 2 shows the measuring cell. The entrance section, 50.8 mm in diameter and 150 mm long, was used to develop the water velocity profile. It was made of PVC to minimise heat conduction from the heating section to the entrance section through the tube walls. The heating section was made of an inner tube of copper, 50.8 mm in diameter, and an outer tube of brass, 102 mm in diameter, providing an annular space which was used as the heating jacket through which hot water flowed. This heating section was made in modules with lengths of 100 and 200 mm. The temperature of the liquid, TL, was measured by five thermocouples, each inside a stainless steel 152 mm long sheath, four having a diameter of 3.2 mm and one of 1.6 mm. These thermocouples were fixed in a Plexiglas assembly that allowed 360º rotation and permitted the distance
between the tip of the thermocouples and the bed surface to be varied from 0 to 15.9 mm.
The temperature at the entrance of the heating section (plane z = 0 in Figure 2) was measured by a ring-shaped assembly made of three copper rings 1.5 mm thick. A thermocouple was soldered to each ring. One extra thermocouple was placed on the axis (r = 0) and another near the tube wall. This assembly was mounted in a Plexiglas flange 25.4 mm thick. TL values measured with and without this flange were found to be statistically equal.
Glass beads with diameters of 3.7 mm, 16.0 mm, and 29.5 mm (D/dp = 13.73, 3.18 and 1.72, respectively) were used as packings. The packing technique developed by Zotin (1985) was employed for the smallest particles; for the other particle diameters beads were manually added to the bed to provide a stable configuration. Six consecutive tests with the same packing and six tests with repacking were carried out for the 3.7 mm particles and a water flow rate (Q) of 4.5 l/min. All other experimental conditions were replicated twice. The bed length was varied from 100 to 700 mm, and the flow rate from 1.1 to 9.9 l/min.
The inlet temperature of the cold water in the measuring cell and the entrance temperature of the hot water in the heating section jacket were fixed at 10.0ºC and 47.0ºC, respectively. Steady state was assumed when all temperature readings were equal in two consecutive 15-min intervals. All the thermocouples were of the T type. They were calibrated in a thermostatic water bath using a thermometer with a precision of 0.5ºC.
A B
C
D E
F G
H I
J
K To the sewage
system
z = 0 Thermocouples
Plexiglas assembly
Heating section
Entrance section Thermocouple
To measuring flange detail
Copper ring
Plexiglas
Figure 2: Measuring cell geometry.
RESULTS AND DISCUSSION where
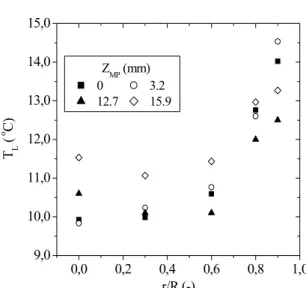
The influence of the distance between the thermocouple tips and the bed surface (ZMP) on TL is shown in Figure 3. For distances up to 3.2 mm, the temperature profile is practically unchanged, but for greater distances there are evident distortions. As the restraining packing screen was made of nylon, conduction from the cell jacket to the thermocouple tips through the screen was not significant, and these tips were allowed to touch the screen for all other tests. If the screen had been made of a metallic material, the effect of conduction on the measured temperature would have had to have been evaluated. Rouiller et al. (2000) tested a stainless screen in a gas flow experiment and demonstrated that screen conduction significantly distorted the temperature profile when the thermocouples touched the screen.
)
1
n
(
)
1
n
(
S
)
1
n
(
S
)
1
n
(
S
2 1
2 2 2
2 1 1 2
p
−
+
−
−
+
−
=
(2)Here are the variances for samples 1 and 2, respectively, while n
2 1
S and S22
1 and n2 are the sizes of samples 1 and 2, respectively.
Table 1 shows calculated and standard values of the Student’s t statistic, with (N - p) degrees of freedom (where N is the sum of sample sizes and p is the number of estimated parameters) at the 95% significance level. In these experiments N was 12 and p was 2 (X1 and X )2 . As the Student’s
t-values were always higher than the calculated values, the mean temperatures with and without repacking were statistically equal for all the radial positions tested. Thus, the heat transfer mechanisms related to the structure of the porous media are less intense than the heat dispersion through the continuous liquid phase. This is in contrast with the results for single-phase gas flow (Dixon, 1994; Rouiller et al., 2000), where repacking caused variability far beyond that observed in tests with the same packing.
A Student’s t-test was used to compare consecutive experiments with and without repacking. To calculate the statistic (tcalc), equal experimental population variances were assumed, resulting in (Berenson and Levine, 1999):
+ − =
2 1 2 p
2 1
n 1 n
1 S
X X
0,0 0,2 0,4 0,6 0,8 1,0 9,0
10,0 11,0 12,0 13,0 14,0 15,0
ZMP (mm) 0 3.2
12.7 15.9
TL
(
o C)
r/R (-)
Figure 3: Outlet bed profile distortion due to the clearance from the thermocouple tips to the bed surface. (dp = 3.7 mm; Q = 4.5 l/min; L = 100 mm)
Table 1: Standard and calculated Student’s t values.
t(10,5%) = 2,2281 (Standard)
r/R (-) 0 0.3 0.6 0.8 0,9
tcalc -1.65 -1.77 -1.99 -1.72 -0.63
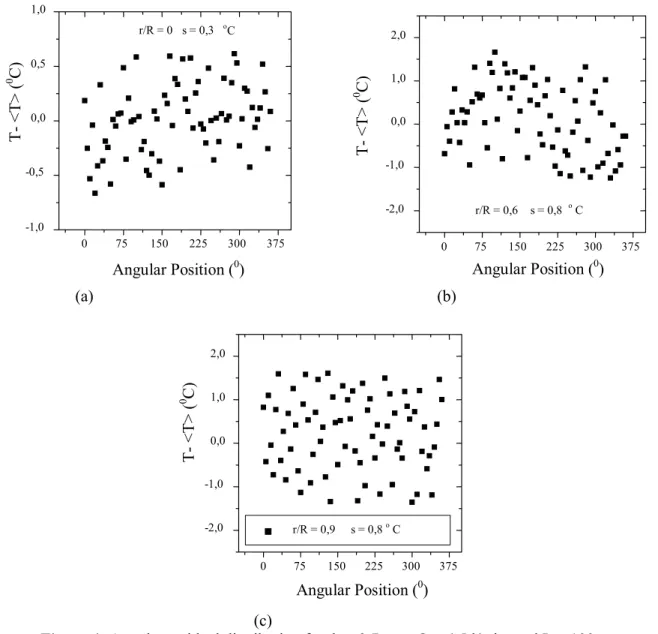
The influence of angular position on measured temperature is shown in Figures 4 and 5. <T> is the temperature averaged over all the angular positions for each radial position and S is the sample standard deviation. For dp = 3.7 mm, measurements were made at 5o intervals from 0 to 360o, while intervals of 15o were used for dp = 29.5 mm. Again, the structure of the porous media seems to have had little influence on the heat transfer, as there is no apparent dependence of measured temperature on angular position. Rouiller et al. (2000) presented results for gas flow where it was possible to identify the positions of both particles and interstices from the shape of the profile of measured TL for very low D/dp. According to Dixon (1994), the effects of repacking and angular fluctuation of TL are of similar magnitude when a gas percolates through the bed.
Figures 4 and 5 still show a slight increase in the standard deviation S from the bed centre to the tube wall. Since variations in porosity tend to be greater in the wall region than in the central region (Benenati and Brosilow, 1962; Zotin, 1985), the angular temperature profile near the wall shows greater variability depending on whether temperatures are measured at or between particles. For air flow in glass bead packings (Dixon, 1994; Rouiller et al., 2000), S is higher than it is for liquid flow, indicating that heat dispersion through the fluid phase is greater for flowing liquid than for gas flow, as discussed above.
The relative independence of TL from the bed structure for liquid flow is a great advantage for modelling the heat transfer problem, because it allows pseudohomogeneous conditions to be assumed, even for very low tube-to-particle diameter ratios. This assumption avoids the need for two-phase models, where separate energy balances are required for the solid phase and for the fluid phase, as well as the difficult separate measurement of the temperatures of the solid phase, the liquid phase and the interface between them.
At a 95% significance level, the temperatures averaged over 72 and 24 angular positions (for D/dp = 13.7 and 1.72, respectively) are statistically equal, , to the temperatures averaged over eight positions, measured at 45º intervals, according to the Student’s
t-test. Dixon (1994) reported the same result for gas flow heat-transfer experiments.
0 75 150 225 300 375 -1,0
-0,5 0,0 0,5 1,0
r/R = 0 s = 0,3 o
C
<T> (
0 C)
Angular Position (0
)
0 75 150 225 300 375
-2,0 -1,0
0,0 1,0 2,0
r/R = 0,6 s = 0,8 o C
<T> (
0 C)
Angular Position (0
)
(a) (b)
0 75 150 225 300 375 -2,0
-1,0 0,0 1,0 2,0
r/R = 0,9 s = 0,8 oC
T- <T>
(
0 C)
Angular Position (0)
(c)
Figure 4: Angular residual distribution for dp = 3.7 mm, Q = 4.5 l/min, and L = 100 mm.
0 75 150 225 300 375
-0,5 0,0 0,5
r/R = 0,3 s = 0,2 o C
T - <T>
(
0 C)
Angular Position (0)
0 75 150 225 300 375
-1,0 -0,5 0,0 0,5 1,0
r/R = 0,8 s = 0,5 o C
T - <
T
>
(
0 C)
Angular Position (0)
0 75 150 225 300 375 -2,0
-1,0 0,0 1,0 2,0
r/R = 0,9 s = 0,8 oC
T -
<T>
(
0 C)
Angular Position (0)
(c)
Figure 5: Angular residual distribution for dp = 29.5 mm, Q = 5.6 l/min, and L = 300 mm.
0,0 0,2 0,4 0,6 0,8 1,0 7,5
15,0 22,5 30,0 37,5 45,0 52,5
100 200
L (mm) 300 400
500 600
700
T
L
(
o C)
r/R (-)
0,0 0,2 0,4 0,6 0,8 1,0
7,5 15,0 22,5 30,0 37,5 45,0 52,5
100 200
L (mm) 300 400
500 600 700
T L
(
o C)
r/R (-)
(a) (b)
Figure 6: Radial temperature profile for dp = 3.7 mm: (a) Q = 1.1 l/min; (b) Q = 7.9 l/min
0,0 0,2 0,4 0,6 0,8 1,0 7,5
15,0 22,5 30,0 37,5 45,0 52,5
200 300
L (mm) 400 500
600 700
T
L
(
0 C)
r/R (-)
0,0 0,2 0,4 0,6 0,8 1,0
7,5 15,0 22,5 30,0 37,5 45,0 52,5
200 300
L (mm) 400 500
600 700
T
L
(
0 C)
r/R (-)
(a) (b)
0,0 0,2 0,4 0,6 0,8 1,0 7,5
15,0 22,5 30,0 37,5 45,0 52,5
200 300
L (mm) 400 500
600 700
TL
(
0 C)
r/R (-)
0,0 0,2 0,4 0,6 0,8 1,0
7,5 15,0 22,5 30,0 37,5 45,0 52,5
200 300
L (mm) 400 500
600 700
TL
(
0 C)
r/R (-)
(a) (b)
Figure 8: Radial temperature profile for dp = 29.5 mm (a) Q = 4.5 l/min; (b) Q = 9.9 l/min
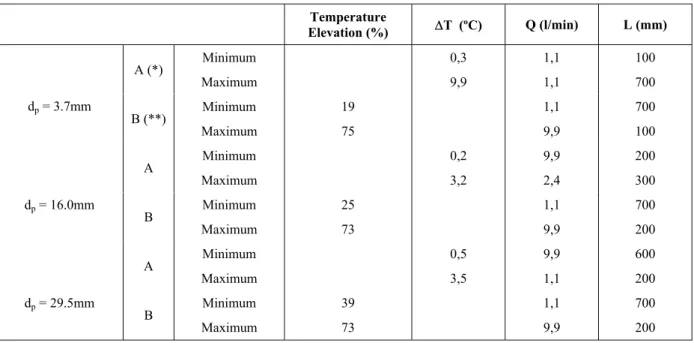
Table 2: Temperature variation in the central bed region (∆T) and temperature rise in the wall region.
Temperature
Elevation (%) ∆T (ºC) Q (l/min) L (mm)
A (*) Minimum
Maximum
0,3 9,9
1,1 1,1
100 700 dp = 3.7mm
B (**) Minimum
Maximum
19 75
1,1 9,9
700 100
A Minimum
Maximum
0,2 3,2
9,9 2,4
200 300 dp = 16.0mm
B Minimum
Maximum
25 73
1,1 9,9
700 200
A Minimum
Maximum
0,5 3,5
9,9 1,1
600 200 dp = 29.5mm
B Minimum
Maximum
39 73
1,1 9,9
700 200 (*) - Between r/R=0 and r/R = 0,9
(**) - Between r/R=0,9 and the wall.
In Table 2 it can be observed that the temperature difference from r/R = 0.0 to r/R = 0.9 is significant only for the smallest particle diameter. A considerable difference was observed for flow rates lower than 5.6 l/min and bed heights under 400 mm. For all other experimental conditions for dp = 3.7mm, the temperature difference was less than 5ºC, while for the other particle diameters it was always less than 3.5ºC. Under these conditions it is reasonable to assume a flat temperature profile in the central bed
axial thermal conductivity and wall-to-bed coefficient). As the present work found a well-defined wall region, the extent of this region could be fixed in the model, reducing the uncertainties in the estimation process.
In terms of parameter estimation, large errors may occur in estimating radial thermal conductivity since there is little temperature variation in the central core. However, the wall-to-bed heat transfer coefficient can be estimated quite accurately, given the large temperature gradient in the wall region.
Figure 9 contains profile for the radial temperature measured at the entrance of the heating section (To measured at z = 0, as shown in Figure 2). For all radial positions except the one closest to the wall, measured temperature is equal to water
temperature at the entrance of the cell, i.e. 10.0ºC. The temperature measured in the wall region increases with decreasing flowrate. Although this wall region temperature was measured with only one sheathed thermocouple, it can be considered accurate since these temperatures were always close in replicated tests. Moreover, there was little fluctuation in local angular temperature at the exit of the bed. Thus, it is reasonable to assume a flat temperature profile for To for the purpose of parameter estimation. For gas flow studies, a large variation in To was observed with both radial position and gas flow rate (Dixon, 1985; Borkink et al., 1992; Thoméo and Freire, 2000), and this variation was attributed to the entrance effects rather than to the effective thermal parameters with the increasing axial distance.
0,0
0,2 0,4 0,6 0 ,8 1,0
9 ,0
10,0
1 1,0
12,0
1 3,0
14,0
1 5,0
16,0
1 7,0
d
p = 3.7mm
Q (l/min)
1,1
2,4 4,4
5,6 7,9
9,9
T0
0 (
C)
r/R (-)
0,0 0,2 0,4 0,6 0,8 1,0
9,0 10,0 11,0 12,0 13,0 14,0 15,0 16,0 17,0
d
p= 16.0mm
T0
(
0 C)
Q (l/min) 1,1 2,4 4,4 5,6 7,9 9,9
r/R (-)
(a) (b)
0,0 0,2 0,4 0,6 0,8 1,0
9,0 10,5 12,0 13,5 15,0 16,5 18,0 19,5
d
p= 29.5mm
Q (l/min)
1,1 2,4
4,4 5,6
7,9 9,9
r/R (-)
T0
(
o C)
(c)
Figure 9: Radial temperature profile at the entrance of the heating section.
CONCLUSIONS
An experimental apparatus was constructed to study heat transfer in a packed bed percolated by water. Stable reproducible results were obtained.
ratios. The results suggest that heat dispersion through the liquid phase is the most significant thermal mechanism.
A steep temperature increase in the outlet bed temperature occurred close to the tube wall, indicating control of heat transfer by a thermal boundary layer. At the same time, the radial temperature profiles were flat over the central core for most of the experimental conditions studied. This suggests that a two-region heat transfer model can be applied with two thermal energy balances one for the central core and the other for the wall region, as proposed by Gunn et al. (1987).
The radial temperature profile at the entrance of the heating section was nearly uniform and may be assumed flat as a boundary condition in heat transfer models for liquid-permeated packed beds.
NOMENCLATURE
D Tube diameter, [L] dp Particle diameter, [L] L Bed length, [L] Q Water flow rate, [L3 T-1] R Radial co-ordinate, [L] R Tube radius, [L] T Variable temperature, [θ] TL Liquid temperature at bed outlet, [θ] To Temperature at entrance of heating section, [θ] Z Axial coordinate, [L] ZMP Distance from thermocouple tips to bed
surface, [L]
∆T Difference in temperature at same level between r/R = 0 and r/R = 0.9, [θ]
ACKNOWLEDGEMENT
J. C. Thoméo thanks FAPESP (00/07262-0) for its financial support, DETA/IBILCE/UNESP for the opportunity of working in Vancouver, and Dr. J. T. Freire for his constant support. We are also grateful to the Natural Sciences and Engineering Research Council of Canada for its research support.
REFERENCES
Ashley, V.M., Mitchell, D.A. and Howes, T. (1999). Evaluating Strategies for Overcoming Overheating Problems during Solid-state
Fermentation in Packed-bed Bioreactors. Biochem. Eng. J., 3, 141-150.
Benenati, R. F. and Brosilow, C. B. (1962). Void Fraction Distribution in Beds of Spheres, AIChE J., 8, 359-361.
Berenson, M.L. and Levine, D.M. (1999). Basic Business Statistics: Concepts and Applications, 7th ed, Prentice-Hall, Upper Saddle River.
Borkink, J.G.H.; van der Watering, C.G. and Westerterp, K.R. (1992). The Statistical Character of Bed-scale Effective Heat Transport Coefficients for Packed-bed, Trans. Inst. Chem. Engineers, 70A, 610-619.
Dixon, A.G. (1985). The Length Effect on Packed-bed Effective Heat Transfer Parameters. Chem. Eng. J., 31, 163-173.
Dixon, A.G. (1994). Heat Transfer in Packed-beds of Spheres with DT/Dp ≤ 4. Proc. 10th Int. Heat Transfer Conf., 225 - 230, Brighton.
Faqir, N.M. and Attarakih, M.M. (2002). Optimal Temperature Policy for Immobilized Enzyme Packed-bed Reactor Performing Reversible Michaelis-Menten Kinetics using Disjoint Policy." Biotech. and Bioeng., 77, 163-173.
Freire, J.T.; Silveira, A.M. and Thoméo, J.C. (1991). Determination of the Effective Radial Thermal Conductivity for the Two-phase Flow at Low Rates in Fixed Beds. AIChE Symp. Ser., 283, 368-374.
Freiwald, M.G. and Paterson, W.R. (1992). Accuracy of Model Predictions and Reliability of Experimental Data for Heat Transfer in Packed Beds. Chem. Eng. Sci., 47, 1545-1560.
Gunn, D.J., Ahmad, M.M. and Sabri, M.N. (1987). Radial Heat-transfer to Fixed-beds of Particles. Chem. Eng. Sci., 42, 2163-2171.
Gunn, D.J. and Sabri, M.N. (1987). A Distributed Model for Liquid-phase Heat Transfer in Fixed Beds. Int. J. Heat Mass Transfer, 30, 1693-1702. Hashimoto, K. et al. (1976). Effective Radial
Thermal Conductivity in Concurrent Flow of a Gas and a Liquid through a Packed Bed. Int. Chem. Eng., 16, 720-727.
Lamine, A.S.; Colli Serrano, M.T. and Wild, G. (1992a) Hydrodynamics and Heat Transfer in Packed Beds with Liquid Upflow. Chem. Eng. Proc., 31, 385-394.
Lamine, A.S.; Colli Serrano, M.T. and Wild, G. (1992b). Hydrodynamics and Heat Transfer in Packed Beds with Cocurrent Upflow. Chem. Eng. Sci., 47, 3493-3500.
Rouiller, C.O., Thoméo, J.C. and Freire, J.T. (2000). Distortions in the Radial Temperature Profile in Packed Beds. Proc. XIII Congresso Brasileiro de Engenharia Química (COBEQ), on CD-ROM, Águas de Lindóia - SP (In Portuguese).
Silveira, A.M. (1991). Heat Transfer in Porous Media: One Phase Model in Fixed Beds Analysis. Ph.D. Diss., PEQ-COPPE/UFRJ, Rio de Janeiro-RJ. (In portuguese)
Thoméo, J.C. and Freire, J.T. (2000). Heat Transfer in Fixed Bed: a Model Non-linearity Approach. Chem. Eng. Sci., 55, 2329-2338.
Tsotsas, E. and Schlünder, E.U. (1990). Heat Transfer
in Packed Beds with Fluid Flow: Remarks on the Meaning and the Calculation of a Heat Transfer Coefficient at the Wall. Chem. Eng. Sci.,45, 819-837.
Weekman, V.W. and Myers, J.E. (1965). Heat Transfer Characteristics of Cocurrent Gas-liquid Flow in Packed Beds. AIChE J., 11, 13-17.
Yagi, S., Kunii, D. and Endo, K. (1964). Heat Transfer in Packed Bed through which Water Is Flowing. Int. J. Heat Mass Transfer, 7, 333 - 338. Zotin, F.M.Z. (1985). Wall Effect in Packed