Manuscript ID: 558 DOI: 10.18462/iir.icr.2019.0558
Modeling the heat transfer and the pressure loss in flat
fin-and-tube compact heat exchangers
Martim AGUIAR
(a, b), Pedro D. GASPAR
(a, b), Pedro D. SILVA
(a, b)(a) University of Beira Interior, Rua Marquês d’Ávila e Bolama, 6201-001, Covilhã, Portugal (b) C-MAST - Centre for Mechanical and Aerospace Science and Technologies, Covilhã, Portugal
ABSTRACT
Fin-and-tube heat exchangers (HX) have wide application in the industry. The study of HXs with reduced tube diameter has allowed the development of more compact and equally efficient equipment. Most of the HXs of this type are composed of flat fins, not only due to the ease of construction but also to their reliability in long-term operation and reduced friction characteristics. The formulation of mathematical equations that predict the effect of the geometric characteristics on the heat transfer and friction factors of the HXs lead many researchers to try to establish correlations that approximate the experimental results. In this paper is developed a computational tool based on literature correlations is used to evaluate the Colburn and friction factors for flat fin-and-tube compact HXs. The results of predictions show the Colburn and friction factors behavior for different geometrical parameters (fin pitch, tube diameter, tube number) and typical Reynolds number. Keywords: Refrigeration, Heat exchangers, Compact, Computational simulation, Evaporators, Energy Efficiency.
1. INTRODUCTION
Fin-and-tube heat exchangers are widely used in engineering applications such as air-conditioning systems, gas heaters and refrigeration systems. This type of exchanger is usually composed of mechanically or hydraulically expanded round tubes in continuous and parallelly arranged fin blocks. The fins associated with the exchangers can take several forms, the most common of which are the flat type. Although the wavy, louver and slit fins significantly improve the heat transfer coefficient compared to the flat fins, they do not guarantee as much reliability in long-term operation, as they have characteristics regarding higher friction. Many researches have been developed in the field of heat transfer and friction characteristics in flat-geometry fin plate changers, and the most influential works in this area are synthesized by Wang et al. (2000). These collected tests differ essentially in the geometric characteristics of the exchangers, such as the number of rows of tubes, the diameter of the tubes, the thickness of the tube wall, the transverse distance between tubes, the longitudinal distance between tubes, the space between the fins and the thickness of the fins.
Tests on this subject have been based on smaller diameters of the exchanger tubes, lower than 9.0mm, due to the increasing use in domestic applications. This geometry enhances the development of more compact heat exchangers, with high heat transfer coefficients and low load losses, as well as using smaller amounts of refrigerant (Wang and Chi, 2000; Wang et al., 1997; Seshimo and Fujii, 1991).
The experimental tests conducted by researchers in this area are usually governed by recommendations from ASHRAE (1993) and ASHRAE Standard 41.2 (1987), thus allowing uniformity among the various measured values.
The main objective of the data collection is to try to establish mathematical correlations, with minimal error, in order to predict the values of the performance parameters of the exchanger for different geometric dimensions. This will enable, without experimental testing, to predict the best geometry of the exchanger in order to optimize it.
Experimentally, obtaining the coefficient of heat transfer and the loss of load are what allows the study of heat exchangers. These are generally obtained by applying the ε-NTU method to determine
the product of UA. This situation then allows to know the overall transfer coefficient of the exchanger between the fluid circulating inside the exchanger and the surrounding circulating air.
Considering the ε-NTU method and the global thermal transfer resistance, which is given by:
Eq. (1)
whose coefficients are obtained from other studies (Gnielinski, 1976; Schmidt, 1949), according to Wang et al. (1996, 2000a) the heat transfer characteristics are presented in terms of the factor Colburn by:
Eq. (2)
The friction factor is calculated from the equation of pressure drop described by Kays and London (1984), being expressed by:
Eq. (3)
2. CORRELATION
Result of the 74 samples collected by Wang et al. (2000), a database was created that allowed to obtain the performance of the passage of the air by the exchanger based on the Colburn factor (j) and the friction factor (f). The increase of the database induces better correlations, increasing their reliability. Many attempts have been made to correlate the results of the experiments, and the basic forms of correlations are:
Eq. (4)
Eq. (5)
Where the parameters C1, C2, C3, and C4 are dependent on the physical dimensions of the heat
exchanger. From the detailed evaluation of this database, Wang et al. (2000) indicates that the final expressions for heat transfer performance are given by:
For N = 1 Eq. (6) Where Eq. (7) Eq. (8) For N ≥ 2 Eq. (9)
Where
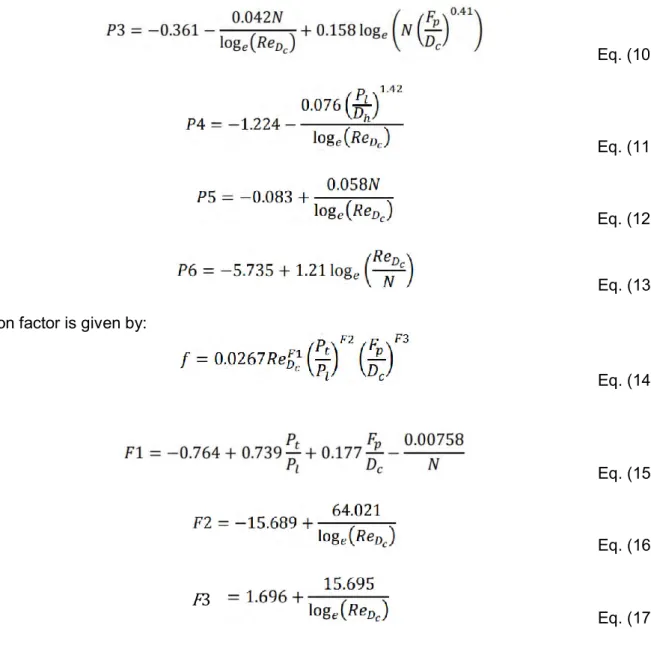
Eq. (10)
Eq. (11)
Eq. (12)
Eq. (13)
The friction factor is given by:
Eq. (14)
Where
Eq. (15)
Eq. (16)
Eq. (17)
These correlations, however, should only be applied to exchangers with the characteristics described below, since only these ranges were taken into account when obtaining them:
• Type of fin – flat • N - between 1 and 6
• DO - between 6.35 and 12.7 mm
• Fp - between 1.19 and 8.7 mm
• Pt - between 17.7 and 31.75 mm
• Pl - between 12.4 and 27.5 mm
Other correlations have been established by several researchers, however they are focused on the tests carried out by each researcher and are not assigned to a large database.
3. SIMULATION OF CORRELATIONS
From the correlations established by Wang et al. (2000), a simulation of the same was done using the MATLAB program, providing the study of the effect of the various geometric parameters on the thermal transfer characteristics.
Table 1 shows the geometric dimensions assumed in the computational simulations. The choice of
diameters of the exchanger tubes. In order to carry out the study, different air velocity values were assumed, implying different Reynolds numbers.
Table 1. Geometric dimensions of heat exchangers
No D0 (mm) Fp (mm) Pt (mm) Pl (mm) δt (mm) N 1 7 1.22 21 12.7 0.115 2 2 7 1.78 21 12.7 0.115 2 3 7 1.22 21 12.7 0.115 4 4 7 1.78 21 12.7 0.115 4 5 9.52 1.23 25.4 19.05 0.115 1 6 9.52 2.23 25.4 19.05 0.115 1 7 9.52 1.23 25.4 19.05 0.115 2 8 9.52 2.23 25.4 19.05 0.115 2 9 9.52 1.23 25.4 19.05 0.115 4 10 9.52 2.31 25.4 19.05 0.115 4
4. ANALYSIS OF RESULTS AND DISCUSSION
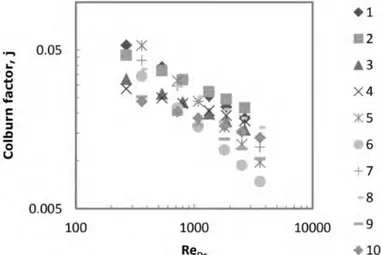
Figs. 1 and 2 illustrate the resulting values of the simulations performed from the above-described correlations. These are relatively close to the experimental values published by Wang et al. (2000). As Wang et al. (2000) described, the proposed correlation for heat transfer can describe 88.6% of the Colburn (j) factors with ±15% deviation, while the correlation of the friction factor correlates 85.1% of the factors by ±15%.
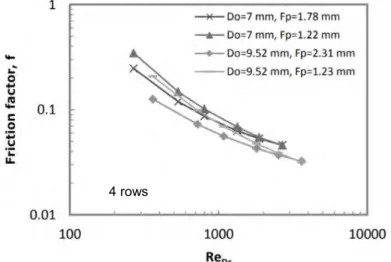
Figs. 3 and 4 show the effect of the space between the fins (Fp) on the heat transfer and the friction
factor, respectively, on heat exchangers with 4 rows of tubes. As can be seen in Fig. 3, the Colburn factor for heat transfer is practically independent of the spacing between the fins in any of the configurations. The same was concluded in the works developed by Rich (1973) and Wang et al. (1996), who reported that although the space between fins was not the same, the coefficient of heat transfer is independent.
Figure 1: Simulation of the Colburn factor correlation for different Reynolds numbers and for the different geometric dimensions of the heat exchangers.
Figure 2: Simulation of the correlation of the friction factor (f) for different Reynolds numbers and for the different geometric dimensions of the heat exchangers.
Figure 3: Effect of the space between fins on the Colburn factor for N = 4.
Figure 4: Effect of the space between fins on the friction factor for N = 4.
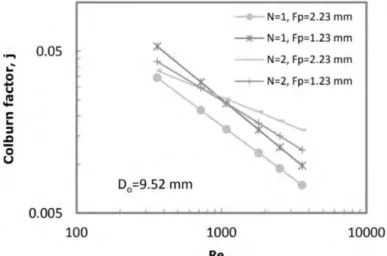
The effect of the spacing between fins is also shown in Fig. 5 and 6 for heat transfer and coefficient of friction, respectively, but now for one and two rows of tubes. Contrary to the previous situation, here we see that there is a relation between the space between fins with the Colburn factor and the coefficient of friction. Regardless of the Reynolds number, for N = 1 it is observed that the heat
transfer factor increases with the decrease of the spacing between the fins. For N = 2, the same situation exists, but only for 𝑅𝑒𝐷𝑐 < 1200, once when 𝑅𝑒𝐷𝑐 > 1200 this situation is reversed.
Figure 5: Effect of the space between fins on the Colburn factor for N = 1 and N = 2.
Figure 6: Effect of the space between fins on the friction factor for N = 1 and N = 2.
Similarly, it is also observed that the friction factor increases with the reduction of the spacing between fins, independently of the number of rows of tubes, a situation which is also verified experimentally by Wang et al. (2000).
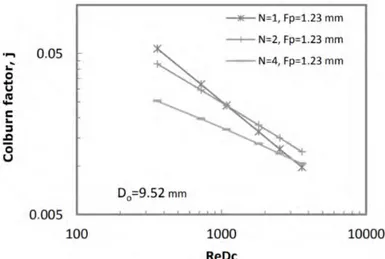
Figs. 7 and 8 illustrate the effect of the number of rows of tubes on heat transfer and the coefficient of friction. As can be seen, for values of 𝑅𝑒𝐷𝑐 < 1200 the Colburn factor decreases with increasing
number of rows of tubes. However, this effect tends to attenuate with the increase of Reynolds number. This same situation is identified by Wang et al. (1996) and Rich (1975), although for higher Reynolds numbers. The friction factor is independent of the number of rows of tubes, also confirmed experimentally by Wang et al. (2000)
Figure 7: Effect of the number of rows of tubes in the heat transfer (Fp = 1.23mm).
Figure 8: Effect of the number of rows of tubes on the coefficient of friction (Fp = 1.23mm).
5. CONCLUSIONS
The attempt to establish mathematical correlations with the minimum of errors in relation to the experimental results has shown to be very relevant for the most different test conditions, with mean deviations of less than 7.51% and 8.31% being obtained for the correlations of the coefficient of heat transfer and the friction coefficient, respectively (Wang et al., 2000). Among the many correlations that have been published, we highlight the correlation presented here, not only because of the average deviations of the values being reduced, but also because of the large data base that supported the formulation. Although some simulations of correlations do not accurately rewrite the assays, as has been found, they are a good approximation to the assays. In this way, although in a general way, this situation allows to conjecture the influence of the geometric characteristics on the coefficients of transference of heat and friction. In short, we can therefore state that the correlations described above are presented as a good solution to the experimental tests.
ACKNOWLEDGEMENTS
This work has been supported by the project Centro-01-0145-FEDER-000017 - EMaDeS - Energy, Materials and Sustainable Development, co-financed by the Portugal 2020 Program (PT 2020), within the Regional Operational Program of the Center (CENTRO 2020) and the European Union through the European Regional Development Fund (ERDF). The authors wish to thank the opportunity and financial support that permitted to carry on this project.
REFERENCES
ASHRAE, 1993, Handbook Fundamental, SI-Edition, American Society of Heating, Refrigerating and Air-Conditioning Engineers, Atlanta, pp.14-15.
ASHRAE, 1987, Standard 41.2, Standard Methods for Laboratory Air-flow Measurement, American Society of Heating, Refrigerating and Air-Conditioning Engineers.
Gniclinsk, V, 1976, New equation for heat and mass transfer in turbulent pipe and channel flow, Int. Chem. Eng. 16, 359-368.
Rich, D.G., 1973, The effect of the fin spacing on the heat transfer and friction performance of multirow, smooth plate fin-and-tube heat exchangers, ASHRAE Transactions 79, 135-145. Rich, D.G., 1975, The effect of the number of tubes rows on heat transfer performance of smooth
plate fin-and-tube heat exchangers, ASHRAE Transactions 81, 307-317.
Schmidt, 1949, Th.E.. Heat transfer calculations for extended surfaces, Refrigerating Engineering, pp. 351-357.
Seshimo, Y., M. Fujii, 1991, An experimental study of the performance of plate fin and tube hea exchangers at low Reynolds number. Proceeding of the 3rd ASME/JSME Thermal Engineering Joint Conference 4, 449-454.
Wang, C.C. e K.-Y. Chi, 2000, Heat transfer and friction characteristics of plain fin-and-tube heat exchangers, part I: New experimental data, Int. J. Heat Mass Transfer 43, 2681-2691.
Wang, C.C. e K.-Y. Chi, 2000, Heat transfer and friction characteristics of plain fin-and-tube heat exchangers, part I: Correlation, Int. J. Heat Mass Transfer 43, 2693-2700.
Wang, C.C., Y.C. Hsish, Y.J. Chang, Y.T. Lin, 1996, Sensible heat and friction characteristics of plate fin-and-tube heat exchangers having plane fins, Int. J. Refrig. 19, 223-230.
Wang, C.C., W.S. Lee, C.T. Chang, 1997, Sensible heat transfer characteristics of plate fin-and-tube exchangers having 7-mm tubes, AIChe Symposium Series 93, 211-216.