Drying of polymer powder in fluidized bed. Modelling of multizone dryer
Nickolay M. Ostrovskii
Hipol a.d., Odžaci, Serbia
Abstract
The process of drying of porous polymer powder (polypropylene) intended to remove the solvent (heptane) is analyzed. The dryer consists of two stages (apparatus) with multizone fluidized bed. The mathematical model of the process in multizone fluidized bed is pro-posed. The rate-limiting step, depending on diameter of polymer particles, is determined. It was found that in relatively large particles (>200 µm) the rate of drying is limited by intraparticle diffusion. A way to decrease the energy consumption in drying has been also discussed and verified in experiments.
Keywords: polymer powder drying, fluidized bed, rate limiting step, multizone dryer, math-ematical model.
Polymers
SCIENTIFIC PAPER
UDC 676.742.3:66.047:51
Hem. Ind.68 (6) 661–671 (2014)
doi: 10.2298/HEMIND131016007O
Available online at the Journal website: http://www.ache.org.rs/HI/
Many polymerization processes are carried out in suspension, which consists of liquid monomer itself (or its solution in some solvent) and of growing polymer particles. At the reactor exit, porous polymer particles should separate from the suspension. If the liquid is not ease vaporable, then first centrifugation and next drying stages are used for separation. An example of such a process is the propylene polymerization over solid Ziegler–Natta catalysts in heptane or hexane solution. After centrifugation, the polymer powder (50– –500 µm) contains 15–20% of heptane in its pores.
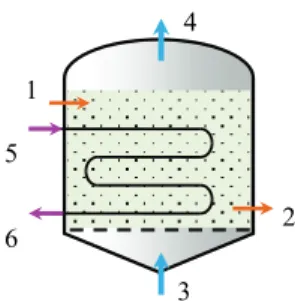
For such a powder (as well as for corns, inorganic and pharmaceutical materials) the fluidized-bed drying is widely used. It provides a good mixing of powder, easy heat application, a relatively homogeneous tem-perature and a continuous process operation (Fig. 1).
1
2
3 4
6 5
Figure 1. Schematic diagram of fluidized-bed dryer. 1, 2 – par-ticles flow; 3, 4 – gas flow; 5, 6 – heat-transfer flow.
Most of the gas passes through the fluidized bed in the form of bubbles, which almost do not contain solids. Bubbles merge and disintegrate in the bed, and collapse at the exit of bed. Thus, the fluid provides
Correspondence: Hipol a.d., Gračački put b.b., 25250 Odžaci, Serbia Serbia.
E-mail: [email protected] Paper received: 16 October, 2013 Paper accepted: 7 February, 2014
almost ideal mixing of solids, and prevents from local overcooling and particles agglomeration.
On the other hand, bubbles diameter (3–10 cm) considerably exceeds the typical particles diameter (0.02–1 mm). This reduces the interface area (gas– –particles) that becomes equal to the external surface of bubbles, and consequently, slows down the rate of mass transfer (rate of drying).
Therefore, the bubble fragmentation in fluidized bed is desirable. It is possible in so-called “organized fluidized bed” with small-volume packing, grates, or even with immersed heaters (like in Fig. 1).
The size of polymer particles varies from 20 to 550 µm. The particles size distribution, coupled with the mixing of solid phase, generates the distribution of par-ticles residence time in a fluidized bed. That is why at the exit of bed, there is always a mixture containing particles from “almost dry” to “almost wet”. The dis-tribution of particles moisture determines the average polymer moisture that should satisfy the requirements of polymer quality (0.1%).
The mathematical model of drying process should include all peculiarities (mentioned above) if the pur-pose of modelling is a detail analysis and optimization. Heat balance equations should enclose a fluid convect-ion, an interphase heat transfer, and a mixing of solid phase. Mass balance equations (for both fluid and solid moisture) also should represent phase flow velocities, an interphase mass transfer, and a moisture transfer inside particles.
Total heat balance of the process
Let us consider the structure of energy consump-tion in a drying process. The heat is consumed for the heating of polymer powder, heptane and nitrogen to the drying temperature, as well as for heptane eva-poration:
(
)
(
)
(
)
o o HLPS MPS W S S H S S
S
G G G G G H H
G
G G Q G Cp Cp T T
G
F Cp ρ T T G Q
+ = + − +
+ − +
(1)
Specific consumption of water steam depends on input moisture of polymer powder (heptane concentration), Wo = GH/(GS+ GH):
(
)
(
)
o o o o o o 1 1 1 LPS MPSS H S S
S W
G G G H
G G
S W W
G G W
Cp Cp T T
G Q W
F Cp W Q
T T
G Q W Q
ρ + = + − + − + − + − (2)
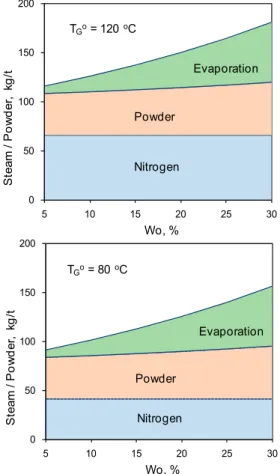
The Eq. (2) is illustrated in Fig. 2. It is seen that the total consumption of steam is much higher than required for heptane evaporation. It means that
pro-bably some potential opportunities exist for the saving of heat energy. For example, almost half water steam is supplied for a heating of nitrogen. Its mass flow (FGρG)
depends on dryer capacity and optimal fluidization velocity, and therefore cannot be decreased. Mean-while, the contribution of nitrogen in total heat balance of the process is quite low (less than 12%), because of low heat capacity (CpG) and low difference of
tempera-tures (TG – TS).
Thus, the temperature of input nitrogen (TGo) can be
optimized in order to decrease the energy consumption (Fig. 2). Besides, when the temperature TGo is
dec-reased from 120 to 80 °C, the middle-pressure steam (MPS, 11 bar) can be replaced by low-pressure steam (LPS, 2 bar).
Nevertheless, a decreasing of TGo can cause some
undesirable changes in drying dynamics, which is impossible to estimate on the base of only total heat balance. For this purpose, a detail modelling of dryer is necessary based on drying kinetics (Eqs. (11)–(17)), equations of mass and heat balance (Eqs. (18)–(26)), and fluidized bed hydrodynamics (Eqs. (27)–(30)).
Process in particle
For the description of heptane concentration inside particle (moisture of particle, wr) the diffusion equation
can be used [1–3]:
2
2
r r r
P
w w s w
D
t r r r
∂ ∂ ∂
= +
∂ ∂ ∂ (3)
It not represents the actual mechanism of moisture transfer in porous particles, which is the combination of diffusion, capillary and surface phenomena [3]. Nevertheless, it gives the possibility to estimate the rate of particles drying or corresponding time.
At the particle center the symmetry condition is valid:
r = 0: dwr/dr = 0 (4)
At the external particle surface, the diffusion flux from the particle is equal to the rate of mass transfer through the external laminar layer of fluid:
r = RP: P P r m P
(
E)
P P P
d w
S k S
D C C
V d r =ρ V − (5)
Defining the dimensionless radius, φ = r/RP, we
obtain:
φ = 1: d Bi
(
)
d r E P w C C
φ =ρ − , Bi
m P
P
k R D
= (6)
The mass transfer Biot number (Bi) indicates the ratio of external mass transfer and internal diffusion. Let’s try to estimate the value of Bi. An effective
dif-0 50 100 150 200
5 10 15 20 25 30
St e a m / Po w d e r, k g /t Wo, % TGo= 120 oC
Nitrogen Powder Evaporation 0 50 100 150 200
5 10 15 20 25 30
Ste a m / P o w d e
r, k
g /t Wo, % Nitrogen Powder Evaporation TGo= 80 oC
fusivity in porous particle depends on its moisture
ψ(w), porosity (εP), and porous tortuosity (h):
DP(w) = ψ(w)DmεP/h (7)
Molecular diffusivity in gas phase (heptane in nit-rogen) consist of DmG, from 7×10⁻² to 9×10⁻² cm2/s, and
in liquid phase DmL, from 3×10⁻⁵ to 8×10⁻⁵ cm2/s [4].
The particle porosity varies in the range 0.15–0.25 and the tortuosity, h, in range4–6[5].
The most complicated is ψ parameter, which rep-resents an influence of surface tension and osmotic and capillary effects [3]. It decreases with w and vary in the interval 0.02–0.1.
The mass transfer coefficient, km, is usually changed
within 10–100 cm/s [6]. Then, Biot number values reach 102–103 (in the case of gas phase diffusion) and 105–106 (liquid phase diffusion).
Because of Bi >> 1, the rate of external mass trans-fer is always higher than the rate of internal diffusion, which is therefore the rate limiting step of the process.
In the case of small particles (<1 mm), it is not necessary to calculate the moisture distribution inside particles, and it is sufficient to estimate the integral (average) moisture:
2
3 0
3 ( )d
P
R
r P
r
W w r r
R
=
(8)Because of Bi >>1, at the particle surface (r = RP) we
have wr(RP) = WE. Thus, after integrating Eqs. (3) and (8)
we obtain the well-known approximate solution:
2 2 2 o 6 exp E P E P
W W D
w t
W W π π R
−
= ≈ −
− (9)
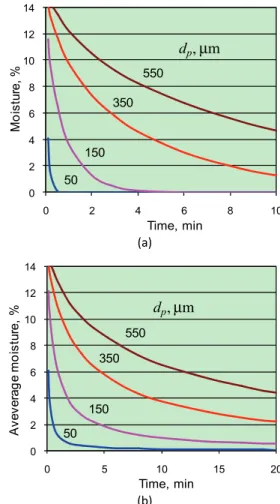
The example of drying dynamics of polymer par-ticles, according to Eq. (9), is presented in Fig. 3a. Dry-ing time is proportional to particle diameter as square. For example, in the case of dP = 50 µm, the moisture
reducing from 16 to 1.6 %, requires the only 0.2 min. Meanwhile, for particles having diameter dP = 350 µm,
this time is increased up to 12 min.
In a fluidized bed (even with uniform particles), the non-uniform distribution of residence time f(t) exists (Fig. 4), which is tended to a normal distribution with increasing of n [2]:
(
)
1
1
( ) exp
1 ! n
Z Z Z
t t
f t
n
τ τ τ
−
= −
−
That is why the average moisture, w, differs from the moisture estimated by Eq. (9). For the bed having only one stage, the Eq. (10) can be used for w calculation (Fig. 3b):
0 2 4 6 8 10 12 14
0 2 4 6 8 10
Mo is tu re , % Time, min dp, µm
550 350 150 50 (a) 0 2 4 6 8 10 12 14
0 5 10 15 20
A v e v er ag e m o is tu re, % Time, min dp, µm
550
350
150
50
(b)
Figure 3.a) Particle drying dynamics in accordance with Eq. (9) and b) particle drying dynamics in fluidized bed in accordance with Eq. (10); WO = 16%, WE = 0.1%; DP = 1·10
–7 cm2/s.
0.0 0.2 0.4 0.6 0.8 1.0
0 0.5 1 1.5 2
n
τZ
f(
t)
t / (n τZ ) 1 stage
3 stages
5 stages
Figure 4.Distribution function of particles residence time in multi-stage (n) fluidized bed.
0
1 2
2 2
1
exp( / ) ( ) d
6 1 Z Z P Z P
w t w t t
From the comparison of Fig. 3a and b, it is seen that the drying time in fluidized bed (under particles mixing) is two times longer than without mixing. Such an inf-luence of residence time distribution should be taken into account during analysis of fluidized bed dryer.
Mass transfer in fluidized bed
Another peculiarity of fluidized bed is the influence of external mass transfer. The rate of gas-solid mass transfer in fluidized bed is lower than in the case of single freely settling particle. The reason is a bubbling regime of gas flow (about 90 %) passing through the suspension phase (Fig. 5). In this case the bubbles external surface determines the rate of mass transfer.
In any j-th zone of the bed (having volume Vj ) the
rate of mass transfer is given by
(
)
F
m T j j E
F
R β V ρ W W
ε
= − , WE = H CE (11)
kB
Figure 5. Interphase mass transfer in fluidized bed.
The value of total coefficient, βT, depends on local
coefficients:
1) βP– inside particle to its surface, SP:
βP = kP(SP/VP)(1–εF) = kP(6/dP)(1–εF) (12)
2) βB– into bubble through its surface, SB:
βB = kB(SB/VB)εF = kB(6/dB)εF (13)
Here (SB/VB)εF = aBand (SP/VP)(1–εF) = aPare specific
areas of bubbles and particles in the unit of bed volume (cm2i/cm3bed). So, the coefficients βP, βB, and also βT,
have the same unit (cm3gas/(cm3bed s)). Because of
suc-cessive steps (12) and (13), their rates are equal each other in quasi-steady state and equals to Rm. Then, the
total coefficient, βT, is defined by formula:
1 1 1
T P B
β = β +β (14)
The local transfer coefficient in bubble (kB, cm3gas/
/(cm2bubble s)) depends on hydrodynamic regime in
fluid-ized bed, namely on bubble diameter (dB) and on its
velocity (uB), which is indirectly dependent on particles
diameter (dP) [2]:
1
5/4 3/2
1/4 1/2
B B
B
B B
d d
k
a bd cu
−
= +
+
(15)
a, b and c are empirical parameters.
The local transfer coefficient in particle (kP, cm
3 gas/
/(cm2particle s)) approximates the diffusion flux inside particle, similarly to first member of Eq. (5):
(
)
P L ddP P E P P
P G
D W
k a W W a
R ρ ε
ρ φ
− ≈ (16)
Then kP can be defined by formula:
2 P P L
P
P G
D k
d Δ
ε ρ
φ ρ
= ,Δ = −φ 1 δo
(
W W/ o)
1/3 (17) The parameter Δφ is a formal dimensionless depthof a dry zone in particle, through which the moisture is diffused. It is increased from 1–δo at the beginning,
when W = WO, to ∼1 at the end of the process, when W≈WE. Thus, the coefficient kP (or DP) is decreased in
drying process, which is typical for capillary-porous materials [3].
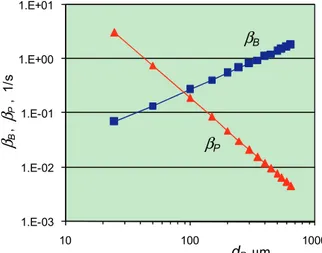
Anticipated values of parameters βB and βP are
pre-sented in Fig. 6. They were calculated using formulas (12)–(17) under conditions of drying of polypropylene powder.
1.E-03 1.E-02 1.E-01 1.E+00 1.E+01
10 100 1000
βB
,
βP
,
1/
s
dP, µm βB
βP
Figure 6. Dependencies of mass-transfer coefficients on particle diameter.
In contrast to mass transfer under the blowing of a single particle, there is a little difference between the intensity of external (through bubble surface) and internal (through particle surface) mass transfer here (Fig. 6).
In the case of relatively large particles (>200 µm),
βP < βB, therefore the rate of process is limiting by
moisture diffusion in particles, and βT≈βP. In the case
of fine particles (<50 µm), βB < βP, therefore the rate of
βT≈βB. In transition region (50–200 µm), the formula
(14) should be used.
In polymerization process, the polydisperse par-ticles are usually formed, and their size distribution depends on the catalyst type (Fig. 7). That is why par-ticles separation along the height of fluidized bed always takes place. Consequently, the distribution of
particles residence time in a dryer becomes rather complicated. These are the main reasons of application of multi-stage fluidized bed dryer in industry.
Zones of fluidization in dryer
The simplified scheme of drying of polypropylene powder (PP) is presented in Fig. 8. Each stage of dryer is divided in two parts by vertical curtain wall. The pow-der is transferred from the left part to the right part under this wall. The heat is supplied in dryers by two ways: 1 – by heating of fluidized bed using water low-pressure steam (LPS, 2 bar), supplying in heat radiators; 2 – by heating of fluid (N2) in heat exchangers using
water middle-pressure steam (MPS, 11 bar).
Because of these peculiarities of dryer design (Nara Machinery, Japan), the hydrodynamic regime in pro-cess vessels is quite complicated (Fig. 9). Each fluidiz-ation vessel can be divided in three groups of zones distinguished by hydrodynamic conditions. Upper zones (1, 6 and 7, 12) are located over radiators. Mid-dle zones (2, 5 and 8, 11) occupy the majority of a bed volume, where radiators are allocated. Lower zones (3, 4 and 9, 10) represent the space between radiators and gas distributors (perforated metal grates).
0 10 20 30 40 50 60
0 200 400 600 800
g,
%
dP, µm
Catalyst -1
Catalyst - 2
Figure 7. The distribution of polypropylene particles size depending on polymerization catalyst; initial moisture WO (% of heptane): catalyst 1: 16–18%; catalyst 2: 17–25%.
PP PP
PP
LPS LPS
N2 MPS
N2 MPS
Figure 8. The principle circuit of PP drying.
zone 6 zone 1
zone 2 zone 5
zone 3 zone 4
zone 7
zone 8
zone 9 PP
PP Gas
N2 N2 N2
Gas
zn 11 zn 12
zn 10
Mathematical model of the process
Each mentioned zone we can consider to be com-pletely mixed stage, which is typical for a fluidized bed [2,6]. For the drying process modelling, four equations are necessary in each zone. They are: moisture con-centrations in gas and solid phases, as well as gas and solid temperatures. Thus, for dryer with 12 zones, this implies a model with 48 equations. Besides, heat bal-ance equations in radiators and in heat exchangers should be formulated.
Gas phase (bubbles)
The moisture concentration in gas (C) and the gas temperature (TG) are changed due to the gas streaming
and interphase transfer:
j-th zone
Solids Gas
Rm j , Rq j
FG Cj , FG CpGρG TG j
FG Cj+1 , FG CpGρG TG j+1
Rates of mass and heat transfer:
(
)
F
m j T j j E
F
R β V ρ W W
ε
= − , Rq j=αTV Tj
(
G j−TS j)
(18)Balance equations:
(
1)
G j j m j
F C −C+ =R , F CpG GρG
(
TG j−TG j+1)
=Rq j (19)Dense phase (particles)
The process in a dense phase is much more com-plicated. Except the main flow of solids (input-output,
GS), the interstage particles transfer takes place. This
transfer is the result of fluidization and is interpreted often as particles diffusion (axial dispersion). Such a flux provides an interchange of moisture and heat between zones. Thus, corresponding rate coefficients of these mass (DS) and heat (λS) transfer can be defined
by formula:
(
1)
j
S j F F F
j
F
D D
L ρ ε
= − , S j F j
j
F
L
λ =λ (20)
In a heat balance, a significant role plays the heating of solids by immersed radiator (RR) and the cooling by
heptane evaporation (QH). The rate of heating is
pro-portional to the difference of temperature in zones 2, 5, 8 and 11, and in radiators:
(
)
R j R j R j S j
R =α V T −T (21)
j-th zone
Solids Gas
Rm j , Rq j
GS Wj-1
GS CpS TS j-1
GS Wj
GS CpS TS j
DS j-1 (Wj-1 – Wj )
λS j-1(TS j-1 – TS j )
DS j (Wj+1 – Wj )
λS j(TS j+1 – TS j )
RR j
Rm j QH
Mass and heat balance equations in a j-th zone:
(
)
(
)
(
)
1 1
1 1
S j j S j j j
S j j j m j
G W W D W W
D W W R
− +
− −
− = − +
+ − −
(22)
(
)
(
)
(
)
1 1
1 1
S S S j S j S j S j S j
S j S j S j q j R j m j H
Cp G T T T T
T T R R R Q
λ
λ
− +
− −
− = − +
+ − + + +
(23)
Heating
Heat balance equation in a radiator:
(
)
LPS j LPS LPS R j LPS j W R j
G Cp T −T +G Q =R (24)
Balance equation in a heat exchanger (for the heat-ing of N2):
(
)
(
)
o
G G G G G
MPS MPS MPS G MPS W
F Cp T T
G Cp T T G Q
ρ − =
= − +
(25)
Overall heat balance in a fluidized bed:
(
) (
)
(
)
o o o
o
S S S S S S S H
G G G G G LPS W
Cp G T G T G G Q F Cp ρ T T G Q
− + − =
= − +
(26)
Fluidization parameters
Most hydrodynamic characteristics of fluidized bed depend on Archimedes and Reynolds numbers:
3
2
Ar P P G
G
gd ρ ρ
µ
= , ReP G P G
G
u d ρ µ
= (27)
Particular Reynolds numbers: current (ReP), start of
fluidization (RePF), and start of particle transport (RePT)
are functions of Archimedes number. They give the possibility to calculate corresponding gas velocities [7]:
0.5 Ar Re
18 5.22 Ar
P=
+ , 0.5
Ar Re
1400 5.22 Ar
PF=
+ ,
0.5 Ar Re
18 0.61 Ar
PT=
+ (28)
2/3 1/3
Re
Nuq q P 0.4 Pr
G F
h d
λ ε
= =
,
0.14 0.22
NuR R P 0.75 1 c Ar
G c
d h d
L λ
= = −
(29)
In a fluidized bed hydrodynamics a bed porosity (εF),
particles „diffusivity“ (DF), and an effective heat
con-ductivity of the bed (λF) are also very important [2]: 0.21
2
18Re 0.36Re Ar F
ε = +
,
(
)
2
2
3
B F
F G F
F d
D u u
u
α ε
δ
= − ,
F D CpF S F
λ = ρ (30)
Here α and δ are empirical functions of bubbles diameter.
The model should also include well-known equa-tions for heat transfer coefficient in heat exchangers; for physical properties of nitrogen, heptane, water steam and polymer powder; for pressure drop in fluid-ized bed, etc. [4,6].
Modelling of drying process
First, the modelling of standard drying regime has been done (Fig. 10). It provides a drying of PP powder (3.8–4.1 t/h) from initial moisture of 15–18% to final moisture less than 0.1%. The temperature in 1st and 5th zone, and powder moisture at the exit of dryers are in a good agreement with experimental data (Fig. 10). From this simulation of drying process the following para-meters were estimated: DP, from 2.5×10
–7
to 3.0×10⁻⁷ cm2/s; DF, 80–120 cm
2
/s; dB, 5–7 cm. The rest of
para-meters were calculated using the above formulas. The bubbles diameter (dB) is determined by
dis-tance between tubes of immersed steam radiator [8,9]. The axial dispersion of particles (DF), calculated by (30),
is also corresponded to latter estimations [10]. Finely, the effective intra-particle diffusivity (DP) lies in the
interval of values predicted by formula (7) at DmL =
6.6×10⁻⁵ cm2/s, εP = 0.2, h = 5, and ψ = 0.1.
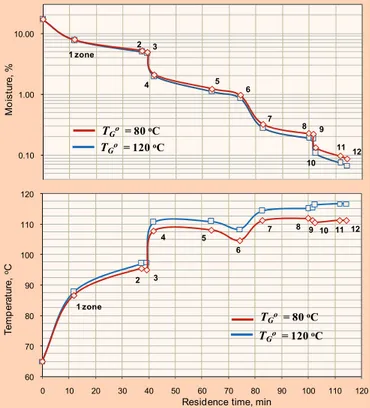
Using these parameters, two regimes of drying pro-cess were simulated: 1st – at the N2 inlet temperature
TG
o
= 120 °C, and 2nd – at TG
o
= 80 °C. The results are presented in Fig. 11.
12 14 16 18 20
1 2 3 4 5 6 7 8 9 10
Wo
, %
0.4 0.6 0.8 1.0 1.2
1 2 3 4 5 6 7 8 9 10
W, %
0 0.05 0.1 0.15
1 2 3 4 5 6 7 8 9 10
W,
%
Time on stream, days
80 90 100 110 120
1 2 3 4 5 6 7 8 9 10
Ts
,
oC
Time on stream, days Inlet moisture
Outlet moisture After 6-th zone
In 5-th zone
In 1-st zone
Figure 10. Results of standard regime modelling. GS = 3.8-4.1 t/h, TG o
0.01 0.10 1.00 10.00
0 10 20 30 40 50 60 70 80 90 100 110 120
Mo
is
tu
re
, %
Time, min 1 zone
2 3
4 5
6
7
8 9
10 11
12 TGo = 80 oC
TGo = 120 oC
60 70 80 90 100 110 120
0 10 20 30 40 50 60 70 80 90 100 110 120
T
e
m
p
e
rat
ure,
oC
Residence time, min 1 zone
2 3
4 5
6
7 8 9 10 11 12
TGo = 80 oC
TGo = 120 oC
Figure 11. Results of dryer modeling: the influence of TG o
. GS = 3.94 t/h. Numbers indicate a zone number.
It is seen from Fig. 11 that supposed decrease in energy consumption, which has been made in Section „Total heat balance of the process“ and Fig. 2, is quite possible. The decreasing of TG
o
only slightly increases the outlet powder moisture, which remains lower than 0.1%.
Nitrogen mass flows, as well as flow rates of low-pressure steam (LPS) and middle-low-pressure steam (MPS)
for these two regimes, are presented in Figs. 12 and 13. It is seen, that the decreasing of MPS by 130 kg/h increases the consumption of LPS by 110 kg/h without remarkable changing in zone temperature, and without loss of drying quality. It happens because the gas moisture (heptane content in N2) affects the rate of
drying much stronger than the gas temperature.
17 %
65 oC
0.212 % 113 oC
7.80 % 87oC
0.92 % 109oC
5.12 % 96 oC
4.88 % 96 oC
2.05 % 106oC
1.18 % 109 oC
0.92 %
0.079 %
N2 = 2952 m3/h, 120 oC,
MPS = 182kg/h
N2 = 1735 m3/h, 120 oC,
MPS = 142 kg/h LPS
236 kg/h
LPS
21 kg/h
0.204 % 113 oC
0.122 % 113 oC 0.087 % 113 oC
0.079 % 113 oC
0.303 % 112 oC
Figure 12. Results of standard regime modelling. GS = 3.94 t/h of dry powder. TG o
= 120 °C. Numbers – powder moisture and temperature in zones.
For the experimental verification of these regimes (and for the model validation), the trial run of dryer was carried out, and the results are presented in Fig. 14. The nitrogen inlet temperature TG
o
has been varied from 120 to 95 °C, and the inlet moisture of polymer – from 15 to 25%. It is clearly seen from Fig. 14 that the
average outlet moisture is in acceptable correlation with the average inlet moisture at all nitrogen tempe-ratures. The best illustration for the possibility of TG
o
provide almost the same average outlet moisture of 0.12–0.13%.
These experiments open up the possibility to rep-lace the middle-pressure steam (MPS) by low-pressure steam (LPS) for the heating of nitrogen.
CONCLUSIONS
The simulation based on the Multizone Model showed good agreement with experimental data. It was demonstrated that proposed model could also
predict hydrodynamic and thermal behavior of multi-zone fluidized bed dryer with immersed heating tubes. The model consists of plausible values of mass and heat transfer parameters.
The application of presented model is proved to be fruitful in optimization of dryer operation and of energy consumption.
Nomenclature
aB, aP specific area of bubble and particle [cm
2
/cm3 or m2/m3]
17 %
65 oC
0.065 % 113 oC 7.86 %
87oC
0.95 % 108oC
5.18 % 96 oC
4.94 % 95 oC
2.10 % 105oC
1.22 % 108 oC
0.95 %
0.087 %
N2 = 2952 m3/h, 80 oC,
MPS = 105 kg/h
N2 = 1735 m3/h, 80 oC,
MPS = 90 kg/h LPS
345 kg/h
LPS
21 kg/h
0.063 % 113 oC
0.132 % 110 oC 0.095 % 111 oC 0.087 % 111 oC
0.077 % 112 oC
Figure 13. Results of modified regime modelling. GS = 3.94 t/h of dry powder. TG o
= 80 °C. Numbers – powder moisture and temperature in zones.
10 15 20 25 30
0 10 20 30 40 50 60 70 80 90 100 110 120 130 140 150 160 170
In
le
t
m
o
is
tu
re
, %
90 100 110 120 130
0 10 20 30 40 50 60 70 80 90 100 110 120 130 140 150 160 170
T N
2
,
oC
0 0.05 0.1 0.15 0.2
0 10 20 30 40 50 60 70 80 90 100 110 120 130 140 150 160 170
Ou
tl
e
t
m
o
is
tu
re
, %
Time on stream, days
Figure 14. Trial run of dryer. GS = 3.9–4.0 t/h of dry powder. TG o
aR specific area of radiator [m2/m3]
C, CE current and equilibrium moisture content in
gas [g/cm3 or kg/m3]
CpG, CpL, CpS heat capacity of gas, liquid and solid
[J/(g K) or kJ/(kg K)]
CpLPS, CpMPS heat capacity of water steam [kJ/kg K] dB, dP bubbles and particles diameter [cm] dc diameter of radiator pipe [cm] Dm molecular diffusivity [cm2/s]
DP effective diffusivity in particles [cm2/s]
DF particles diffusivity (axial dispersion) in
fluidized bed [cm2/s, or m2/h]
DS inter-zone particles transfer [kg/h] FG gas flow rate [cm3/s, or m3/h] Fj cross-section area in j-th zone [m2] h tortuosity of porous structure
hq interphase heat-transfer coefficient [kJ/(m2 h K)] hR „radiator-to-bed“ heat-transfer coefficient
[kJ/(m2 h K)]
H Henry coefficient [cm3/g]
GS flow rate of dry particles [kg/h] GLPS, GMPS flow rate of water steam [kg/h]
km external mass-transfer coefficient [cm3/(cm2 s)] kB, kP local mass-transfer coefficient in bubble and
particle [cm3/(cm2 s)]
Lj height of j-th zone in bed [m]
Lc distance between pipes in radiator [cm] RP particles radius [cm]
Rm rate of mass transfer [g/s, or kg/h]
RR rate of „radiator-to-bed“ heat-transfer [kJ/h] Rq rate of interphase heat transfer [kJ/h] r coordinate inside particle [cm]
QH, QW heat of vaporization of heptane and water
[kJ/kg]
s particle shape parameter (0 – plate, 1 – cylin-der, 2 – sphere)
SB, SP external surface of bubble and particle [cm2 or
m2]
TG, TS, TR temperature of gas bed and radiator [°C] TLPS, TMPS temperature of water steam [°C] uG gas velocity [cm/s, or m/s]
uF minimum fluidization velocity [cm/s, or m/s] Vj volume of j-th zone [cm3, or m3]
VB, VP volume of bubble and particle [cm3]
W, WE current and equilibrium moisture of particles
[g/g or kg/kg]
w dimensionless moisture Eq. (7))
Greek symbols
αR = hRaR total „radiator-to-bed“ heat-transfer
coef-ficient [kJ/(m3 h K)]
αT = hq aB total interphase heat-transfer coefficient
[kJ/(m2 h K)]
βT total interphase mass-transfer coefficient [1/s
or 1/h]
βB, βP total mass-transfer coefficient in bubbles and
particles [1/h]
εP porosity of particles
εS, εF void fraction of a fixed and fluidized bed ψ empirical parameter (Eq. (5))
φ = r/RP dimensionless radius of particles
ρP polymer particles density [g/cm3 or kg/m3] ρS, ρF density of fixed and fluidized bed [g/cm3 or
kg/m3]
ρG, ρL density of gas and liquid [g/cm3 or kg/m3] µG, µL viscosity of gas and liquid [g/(cm s)]
λG, λL heat conductivity of gas and liquid [J/(cm s K)] λF heat conductivity of fluidized bed [kJ/(m h K)] λS inter-zone heat transfer [kJ/(h K)]
τZ residence time of particles in bed [min or h]
Aknowledgments
The author would like to acknowledge G. Mijatović and B. Dimić for survey work on the trial run of dryer.
REFERENCES
[1] A.V. Lykov, Theory of energy and mass transfer, Pren-tice-Hall, Englewood Cliffs, NJ, 1961.
[2] D. Kunii, O. Levenspiel, Fluidization Engineering, 2nd ed. Butterworth-Heinemann, Boston, MA, 1991.
[3] A.V. Lykov, Heat and mass transfer (Handbook), Energia, Moscow, 1972 (in Russian).
[4] R.C. Reid, J.M. Prausnitz, T.K. Sherwood, The properties of gases and liquids, McGraw-Hill, New York, 1977. [5] J.A. Debling, W.H. Ray, Heat and mass transfer effects in
multistage polymerization processes, Ind. Eng. Chem. Research 34 (1995) 3466–3480.
[6] Perry’s Chemical Engineers’ Handbook, McGraw-Hill, New York, 1984.
[7] Fluidization, J.F. Davidson, D. Harrison, Eds., Academic Press, London, 1971.
[8] M. Schreiber, T.W. Asegehegn, H.J. Krautz, Numerical and Experimental Investigation of Bubbling Gas- Solid Fluidized Beds with Dense Immersed Tube Bundles, Ind. Eng. Chem. Research 50 (2011) 7653–7666.
[9] M. Rudisuli, T.J. Schildhauer, S.M.A. Biollaz, J.R. van Ommen, Radial Bubble Distribution in a Fluidized Bed with Vertical Tubes, Ind. Eng. Chem. Research 51 (2012) 13815–13824.
IZVOD
SUŠENJE POLIMERNOG PRAHA U FLUIDIZOVANOM SLOJU. MODELIRANJE VIŠESLOJNE SUŠNICE
Nikolaj M. Ostrovski
Hipol a.d., Odžaci, Serbia
(Naučni rad)
Analiziran je proces sušenja poroznih čestica polimera (polipropilena) sa ciljem uklanjanja rastvarača (heptana). Sušnica uključuje dva stadijuma (aparata) sa flui-dizovanim slojem u kojima postoje nekoliko zona sušenja. Predložen je matema-tički model procesa u fluidizovanom sloju sa različitim zonama. Određen je limiti-rajući stupanj sušenja u zavisnosti od prečnika polimernih čestica. Pronađeno je da u relativno krupnim česticama (>200 µm) brzina sušenja se limitira difuzijom unutar čestica. U malim česticama (<50 µm) proces limitira prenos mase kroz spo-ljašnu površinu mehuriča gasnog fluida (azota). Model je pokazao zadovoljavajuću saglasnost sa eksperimentalnim podacima i korišćen je za optimizaciju rada suš-nice. Data je analiza načina smanjenja potrošnje energije koje su ispitane u ekspe-rimentima na industrijskom postrojenju.
Ključne reči: Sušenje polimernog praha •
Fluidizovani sloj • Limitirajući stupanj •