Linkage disequilibrium, SNP frequency change due to selection,
and association mapping in popcorn chromosome regions containing QTLs
for quality traits
Geísa Pinheiro Paes
1, José Marcelo Soriano Viana
1, Fabyano Fonseca e Silva
2and Gabriel Borges Mundim
1 1Departmento de Biologia Geral, Universidade Federal de Viçosa, Viçosa, MG, Brazil.
2Departmento de Zootecnia, Universidade Federal de Viçosa, Viçosa, MG, Brazil.
Abstract
The objectives of this study were to assess linkage disequilibrium (LD) and selection-induced changes in single nu-cleotide polymorphism (SNP) frequency, and to perform association mapping in popcorn chromosome regions con-taining quantitative trait loci (QTLs) for quality traits. Seven tropical and two temperate popcorn populations were genotyped for 96 SNPs chosen in chromosome regions containing QTLs for quality traits. The populations were phenotyped for expansion volume, 100-kernel weight, kernel sphericity, and kernel density. The LD statistics were the difference between the observed and expected haplotype frequencies (D), the proportion of D relative to the ex-pected maximum value in the population, and the square of the correlation between the values of alleles at two loci. Association mapping was based on least squares and Bayesian approaches. In the tropical populations, D-values greater than 0.10 were observed for SNPs separated by 100-150 Mb, while most of the D-values in the temperate populations were less than 0.05. Selection for expansion volume indirectly led to increase in LD values, population differentiation, and significant changes in SNP frequency. Some associations were observed for expansion volume and the other quality traits. The candidate genes are involved with starch, storage protein, lipid, and cell wall polysac-charides synthesis.
Keywords: gametic phase disequilibrium, GWAS, candidate gene.
Received: May 18, 2015; Accepted: October 9, 2015.
Introduction
Linkage disequilibrium (LD) or gametic phase dis-equilibrium is the difference between haplotype frequency products (P(AB).P(ab) – P(Ab).P(aB)) (Kempthorne, 1957). Because this difference corresponds to the cova-riance between values of alleles at two loci (Weir, 2008), LD is commonly defined as the non-random association of alleles at different loci. LD between molecular markers and genes, the basis of quantitative trait locus (QTL) mapping, association mapping, and genomic selection, is due to or af-fected by selection, mutation, population admixture, ge-netic drift, outcrossing, inbreeding, and recombination (Guptaet al., 2005). With respect to biallelic markers, the most common statistics to measure LD in a population are the difference between the observed and expected (under linkage equilibrium) haplotype frequencies (D), the pro-portion of D relative to the expected maximum value in the population (D’), and the square of the correlation between the values of alleles at two loci (r2) (Flint-Garcia et al., 2003).
Association mapping refers not only to the identifica-tion of QTLs, but also to the identificaidentifica-tion of candidate genes based on statistical significance between markers and phenotype. Its main advantages relative to QTL mapping are the use of breeding population instead of population de-rived by crossing two inbred or pure lines and more precise identification of candidate genes (Flint-Garciaet al., 2005). However, association mapping is only capable of identify-ing effects of alleles present in reasonably high frequency in a population. In addition, the efficiency of association mapping is significantly influenced by relatedness and pop-ulation structure, which can generate spurious associations, that is, associations between unlinked marker and QTL (Weir, 2010). The association mapping methodologies are the candidate gene approach and the genome-wide associa-tion study (GWAS) (Rafalski, 2010). Both methods have been successfully used to determine the genetic basis of im-portant complex traits and to identify some of the key genes.
In maize (Zea maysL.), LD analyses and association studies have been performed using inbred line panels. The LD analysis performed by Van Inghelandtet al.(2011) was based on 1,537 inbreds genotyped for 359 simple sequence
DOI: http://dx.doi.org/10.1590/1678-4685-GMB-2015-0126
Send correspondence to José Marcelo Soriano Viana. Federal Uni-versity of Viçosa, Department of General Biology, 36570-900, Viçosa, MG, Brazil. E-mail: [email protected]
repeat (SSR) loci and 8,244 single nucleotide polymor-phisms (SNPs). Considering only linked markers, LD un-der low (SSR) and high (SNP) marker densities was comparable for Flint and Lancaster heterotic pools. For Stiff Stalk Synthetic (SSS) and Iodent heterotic pools, the average LD based on SNPs was 45 to 52% greater than that based on SSR markers. Truntzleret al.(2012) assessed LD in a panel of 314 dent inbreds genotyped for 979 SNPs. They observed an r2value of 0.20 for SNPs at a spacing of 200 kb. Based on a panel of 240 inbreds genotyped for 29,619 SNPs, Thirunavukkarasuet al.(2013) estimated r2 values ranging from 0.21 to 0.25. LD blocks were observed on all chromosomes, with the LD decay occurring over re-gions of 200-300 kb.
Association mapping in maize has been effective for identifying candidate genes for complex traits such as pathogen resistance, root development, drought tolerance, chilling tolerance, oil biosynthesis, plant architecture, ker-nel composition, flowering, and metabolic processes. Using simulated and field data from five plant species in-cluding maize, Stich and Melchinger (2009) and Yanget al.
(2010) compared association mapping methods. They con-cluded that a mixed-model approach using a kinship matrix to correct for relatedness was the best method. This ap-proach outperformed a model controlling for relatedness and population structure because the spurious associations could not be completely controlled by population structure. Thirunavukkarasuet al.(2014) assessed 240 inbreds under water-stressed and well-watered environments. They mea-sured anthesis-to-silking interval, grain yield, 100-kernel weight, and four ear traits, and carried out association map-ping based on 29,619 high-quality SNPs. Fifty and 70 SNPs were strongly associated with tolerance to water stress un-der stressed and well-watered environments, respectively. Significant SNPs were identified mainly on chromosomes 5 and 3 under the water-stressed environment and on chro-mosomes 10, 1, and 7 under well-watered conditions. Thirty-one of the SNPs detected under water-stressed con-ditions were situated near drought-tolerance genes.
To our knowledge, little information is available on LD and SNP frequency changes due to selection in maize and special maize breeding populations, nor have QTLs been identified in such populations by association map-ping. Thus, our objectives were to assess LD and SNP fre-quency changes due to selection, and to perform associa-tion mapping in popcorn (Zea maysL. ssp.everta(Sturtev.) Zhuk.) chromosome regions containing QTLs for quality traits.
Materials and Methods
Populations
The populations employed in this study were Viçosa, Viçosa cycles 1 (c1) and 4 (c4) (obtained from Viçosa after one and four half-sib selection cycles, respectively), Viçosa
cycle 2 (c2) fsf (derived from Viçosa after two full-sib selection cycles), Viçosa S4(generated from four inbred
progeny selection cycles applied in the Viçosa population), Beija-Flor c1 and Beija-Flor c4 (obtained from Beija-Flor c1 after three half-sib selection cycles), and UFV MP-1 and UFV MP-2 (derived from hybrids P622 and P625, respec-tively, developed by the Agricultural Alumni Seed Im-provement Association, Romney, IN, USA). The first seven populations, representing tropical germplasm, were cultivated during the 2012-2013 growing season in an ex-perimental field at the Federal University of Viçosa (UFV), Minas Gerais, Brazil. The populations UFV MP-1 and UFV MP-2, representing temperate germplasm, were culti-vated in 20-L pots in a greenhouse at UFV, in 2014. Leaf samples of 100-150 young plants were collected from each population for genotyping.
The populations derived from Viçosa and Beija-Flor c1 were obtained by progeny and plant-within-progeny se-lection for expansion volume. In trials of non-inbred prog-eny, 196 progeny were assessed using a 14 x 14 lattice design with two replications, at the UFV experimental sta-tion located in Coimbra, Minas Gerais. The 20 superior half-sib families were recombined using one male row to four female rows. In the recombination plots with the 20 su-perior full-sib families, at least one female per family was crossed with a male from another progeny, providing 380 full-sib families. In the half-sib progeny recombination plots, 196 plants were selected, providing the half-sib fami-lies for the next cycle. The 196 full-sib famifami-lies for the next cycle were selected based on the expansion volume of the female parent.
The inbred progeny were assessed in an experimental field at UFV using an incomplete block design with replica-tions only for the controls (commercial hybrids and popula-tions). Each incomplete block consisted of 10 progeny and the controls. The trials included 344 S1progeny, 309 S2
progeny, 277 S3progeny, and 268 S4progeny. In each
prog-eny, three to five plants were selfed. The progeny for the next cycle were obtained by selecting the best families and then the superior selfed plants. Populations Viçosa S1 to
Viçosa S4were obtained by recombining all assessed
in-bred progeny. The progeny tests and recombination plots were conducted during 1998-1999 to 2007-2008 growing seasons. To assess expansion volume, we used a hot air popcorn popper (1,200 W) or a 27-L microwave oven (900 W), and samples of 30 g per plot and 10 g per plant.
Genotyping
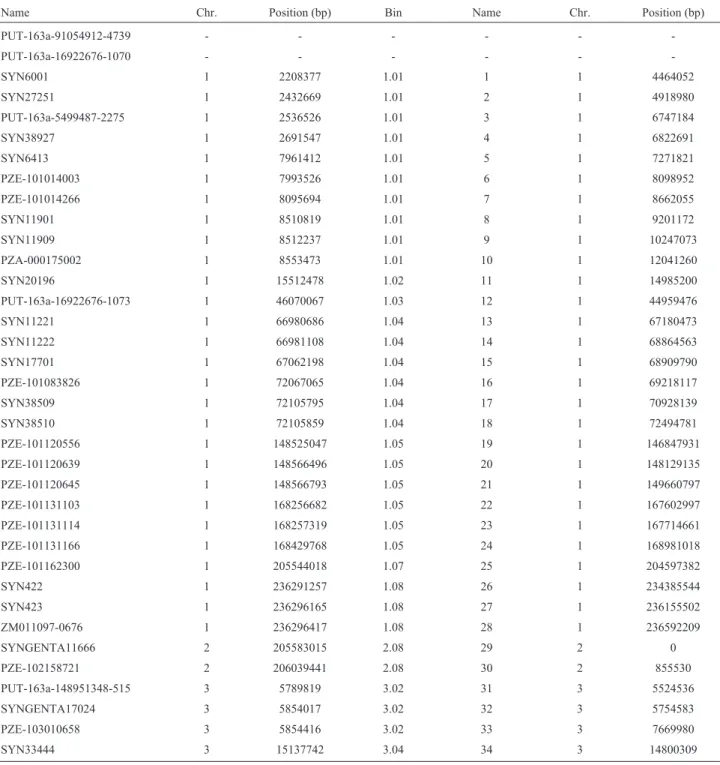
from 50 ng/mL DNA samples using GoldenGate assays (Illumina, San Diego, CA, USA). Genotyping was per-formed on an Illumina BeadXpress. Individuals were geno-typed for 96 SNPs located in chromosome regions containing QTLs for the following popcorn quality traits: expansion volume, flake volume, unpopped kernel number, and flake size (Table 1). The SNPs were selected from the maize 56-kb SNP50 array (56,110 SNPs from ~19,000 genes) on the basis of locations of the SSR primers flanking the QTLs mapped by Liet al.(2006, 2007, 2008, 2009),
Babuet al.(2006), and Luet al.(2003) and by using infor-mation in Maize Genetics and Genomics (MaizeGDB) and National Center for Biotechnology Information (NCBI) da-tabases. Two SNPs did not map to any assembly. The num-ber of genotyped plants ranged from 38 to 113. Genotypes were assigned using Illumina GenomeStudio (version 2011.1), with the GC score specified as 0.25. The average distance between adjacent SNPs was 9.1 Mb, and within bins, 464 kb.
Table 1- Name and location of the true and simulated SNPs.
Name Chr. Position (bp) Bin Name Chr. Position (bp)
PUT-163a-91054912-4739 - - -
-PUT-163a-16922676-1070 - - -
-SYN6001 1 2208377 1.01 1 1 4464052
SYN27251 1 2432669 1.01 2 1 4918980
PUT-163a-5499487-2275 1 2536526 1.01 3 1 6747184
SYN38927 1 2691547 1.01 4 1 6822691
SYN6413 1 7961412 1.01 5 1 7271821
PZE-101014003 1 7993526 1.01 6 1 8098952
PZE-101014266 1 8095694 1.01 7 1 8662055
SYN11901 1 8510819 1.01 8 1 9201172
SYN11909 1 8512237 1.01 9 1 10247073
PZA-000175002 1 8553473 1.01 10 1 12041260
SYN20196 1 15512478 1.02 11 1 14985200
PUT-163a-16922676-1073 1 46070067 1.03 12 1 44959476
SYN11221 1 66980686 1.04 13 1 67180473
SYN11222 1 66981108 1.04 14 1 68864563
SYN17701 1 67062198 1.04 15 1 68909790
PZE-101083826 1 72067065 1.04 16 1 69218117
SYN38509 1 72105795 1.04 17 1 70928139
SYN38510 1 72105859 1.04 18 1 72494781
PZE-101120556 1 148525047 1.05 19 1 146847931
PZE-101120639 1 148566496 1.05 20 1 148129135
PZE-101120645 1 148566793 1.05 21 1 149660797
PZE-101131103 1 168256682 1.05 22 1 167602997
PZE-101131114 1 168257319 1.05 23 1 167714661
PZE-101131166 1 168429768 1.05 24 1 168981018
PZE-101162300 1 205544018 1.07 25 1 204597382
SYN422 1 236291257 1.08 26 1 234385544
SYN423 1 236296165 1.08 27 1 236155502
ZM011097-0676 1 236296417 1.08 28 1 236592209
SYNGENTA11666 2 205583015 2.08 29 2 0
PZE-102158721 2 206039441 2.08 30 2 855530
PUT-163a-148951348-515 3 5789819 3.02 31 3 5524536
SYNGENTA17024 3 5854017 3.02 32 3 5754583
PZE-103010658 3 5854416 3.02 33 3 7669980
Name Chr. Position (bp) Bin Name Chr. Position (bp)
SYN33443 3 15222626 3.04 35 3 15194865
SYN33442 3 15222864 3.04 36 3 16334091
PZE-103160210 3 211405876 3.08 37 3 209104813
PZE-103160218 3 211408703 3.08 38 3 210855530
PZE-103160227 3 211410592 3.08 39 3 211377457
SYN33394 3 215456783 3.08 40 3 213475311
PZE-103165953 3 215462316 3.08 41 3 215009460
PUT-163a-149100944-925 3 215513343 3.08 42 3 216145401
PZE-104008299 4 5595386 4.02 43 4 0
PZE-104033459 4 41873008 4.05 44 4 34923515
PZE-104033791 4 42284265 4.05 45 4 36303978
PZE-104033817 4 42288134 4.05 46 4 38019829
PZE-104033826 4 42306869 4.05 47 4 39186188
SYN22745 4 154716125 4.06 48 4 148089966
PZE-104080384 4 154716758 4.06 49 4 148380829
SYN509 5 4219552 5.01 50 5 0
SYN524 5 4254273 5.01 51 5 1575760
SYN526 5 4254700 5.01 52 5 1580048
PZE-105018859 5 8560599 5.02 53 5 4536728
SYN4651 6 147905068 6.05 54 6 146819366
SYN4646 6 147909387 6.05 55 6 148468338
SYN4642 6 147909507 6.05 56 6 148928894
PZE-106100715 6 153502018 6.05 57 6 151316528
PZE-106100720 6 153502756 6.05 58 6 152790375
PZE-106100728 6 153508407 6.05 59 6 153651642
PZE-106115889 6 161854167 6.07 60 6 159940903
PZE-106116148 6 161924948 6.07 61 6 161828934
PZE-106116156 6 161990361 6.07 62 6 162886520
SYN12692 6 164180276 6.07 63 6 164783844
PZA02688.2 6 164183687 6.07 64 6 166620102
SYN12698 6 164186726 6.07 65 6 167632980
PZE-107083430 7 125723001 7.02 66 7 0
PZE-107083429 7 125723685 7.02 67 7 1462112
PZE-107105783 7 157912189 7.04 68 7 14959671
SYN36108 7 157914433 7.04 69 7 16157837
PZE-107105855 7 157934803 7.04 70 7 17505219
PZE-108004863 8 4967925 8.01 71 8 0
PZE-108004875 8 4969812 8.01 72 8 1878784
PZE-108004908 8 5025189 8.01 73 8 2059971
PZE-108052599 8 92730672 8.03 74 8 86063553
PZE-108052600 8 92730702 8.03 75 8 87675003
PZE-108052603 8 92732462 8.03 76 8 87804291
PZE-108134983 8 173931575 8.09 77 8 166943466
SYN20808 8 173953651 8.09 78 8 167344955
SYN20806 8 173973257 8.09 79 8 168464798
PZE-108135203 8 174257043 8.09 80 8 170052048
Phenotyping
Expansion volume was assessed in a 27-L microwave oven (900 W) using samples of 10 or 30 g per plant. To pro-vide an estimate of error variance for expansion volume, two measurements were obtained for most plants in the temperate populations. Hundred-kernel weight was mea-sured with an electronic scale. Average kernel sphericity was calculated as the ratio of geometric mean diameter (cu-bic root of the multiplied length, width, and depth) to kernel length (as measured with a digital caliper [0.005-mm preci-sion]) of 10 randomly-selected kernels per plant (Tianet al., 2001). To determine kernel density, 50 kernels were weighted and placed in a 100-mL beaker (1.0-mL preci-sion) containing 50 mL of 90% aqueous ethanol. Kernel volume was obtained by subtracting 50 mL from the final volume (Vyn and Tollenaar, 1998). The number of pheno-typed plants ranged from 43 to 108.
Data simulation
Because no reference was available for interpreting the LD analysis results for the popcorn populations, we also analyzed two simulated populations. Simulated population 1 (Pop1) was a second generation composite obtained by crossing two populations in linkage equilibrium. This pop-ulation was in LD only for linked markers and/or genes. The second simulated population (Pop2) was obtained from Pop1 after 10 cycles of random crosses assuming sample sizes of 100 and 300. The effective population sizes were 200 and 600, respectively. The program used for sim-ulating genotypes and phenotypes - REALbreeding - has been developed by the second author using REALbasic software (Vianaet al., 2013). In the simulation process, we tried to reproduce the same distribution of SNPs observed in the popcorn populations. We simulated 1,170 SNPs on nine chromosomes, of which 94 were selected and analyzed (Table 1). The average distance between adjacent SNPs was 9.1 Mb.
Nineteen QTLs (candidate genes) and 81 minor genes affecting the expansion volume trait were randomly distrib-uted along the nine chromosomes. Based on user input, which included minimum and maximum genotypic values for homozygotes, degree of dominance (d/a), direction of dominance, and broad sense heritability, the REALbreeding program provided the phenotypic values of each genotyped individual. The phenotypic values were computed from the true population mean, additive and dominance values, and error effects sampled from a normal distribution. The error variance was computed from the broad sense heritability. The minimum and maximum genotypic values of homozygotes were 5 and 50 mL g-1. We also defined bidirectional dominance (-1.2£(d/a)i£ 1.2)
and used a heritability of 50%. The proportion of the pheno-typic variance explained by each QTL was set to 2.4%.
Statistical analyses
Missing genotypes were imputed with Beagle 3.3.2 (Browning and Browning, 2007). PowerMarker 3.25 (Liu and Muse, 2005) was used to compute SNP frequencies, gene diversity (expected heterozygosity), and LD statistics and to perform Hardy-Weinberg equilibrium tests and as-sociation mapping based on analysis of variance (equiva-lent to a least-squares regression analysis). The fixation index (FST) was computed using GenAlEx 6.5 (Peakall and
Smouse, 2006). For the population structure analysis, we used the Structure software (Falushet al., 2003). SAS (SAS Institute, 2007) was used to compare population means and to compute phenotypic correlations. We used the R pack-ages MCMCpack (Martin et al., 2011) and boa (Smith, 2007) for a Bayesian GWAS.
A SNP was considered to be non-polymorphic when the minor allele frequency (maf) was less than 1%. Only SNPs in Hardy-Weinberg equilibrium, as assessed using a chi-square test at the 5% significance level, were used for the LD analysis. The LD measures were D, D’, and r2. The
Name Chr. Position (bp) Bin Name Chr. Position (bp)
SYN17233 10 4992947 10.01 82 9 2942947
PZE-110006423 10 4993061 10.01 83 9 4581985
PZE-110007091 10 5485252 10.02 84 9 5060295
PZE-110007194 10 5537112 10.02 85 9 6864235
SYN16757 10 5592617 10.02 86 9 7174065
PZE-110012640 10 11088851 10.02 87 9 9114563
PZE-110012671 10 11184622 10.02 88 9 10769264
PZE-110012682 10 11195007 10.02 89 9 12219177
PZE-110045755 10 86439624 10.03 90 9 85800064
SYN37480 10 86528026 10.03 91 9 87218643
SYN16982 10 114875299 10.04 92 9 113242081
SYN16979 10 114876217 10.04 93 9 114440567
significance of a SNP frequency change was based on Waples (1989) assuming a 0.05% level of significance. For the population structure analysis, the burn-in period and the number of Markov chain Monte Carlo (MCMC) replica-tions consisted of 5,000 and 25,000 iterareplica-tions, respectively, and the number of assumed populations (K) was varied from 2 to 10. We ran the analysis under the no-admixture model with correlated frequencies. The most probable K-value was determined based on the inferred plateau method (Vianaet al., 2013). The least-squares association mapping used a Benjamini-Hochberg false discovery rate (FDR) of 5% (Benjamini and Hochberg, 1995). For the Bayesian GWAS, the burn-in period, number of MCMC replications, and sampling interval were 50,000, 100,000, and five, re-spectively. Significant SNP effects were identified using 95% highest posterior density (HPD) intervals.
Candidate gene analysis
SNP sequences in FASTA format were obtained from the NCBI Database of Single Nucleotide Polymorphisms and used to perform BLAST searches against the ‘B73’RefGen_v2 reference genome at the MaizeGDB. In-formation on gene products, expression, and ontology (bio-logical process, molecular function, and cellular compo-nent) was obtained using the MaizeCyc database, the Maize eFP browser, and the Gramene database. To identify candi-date genes, we searched up to 1 Mb upstream and down-stream of each SNP region.
Results
LD analysis
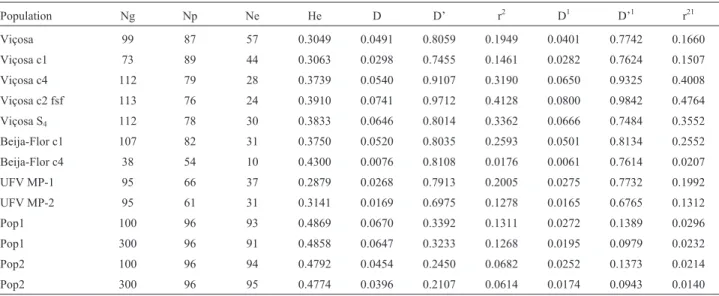
The percentage of polymorphic SNPs in the popcorn populations ranged from 56.0 in Beija-Flor c4 to 93.0 in Viçosa c1 (Table 2), but the number of SNPs in
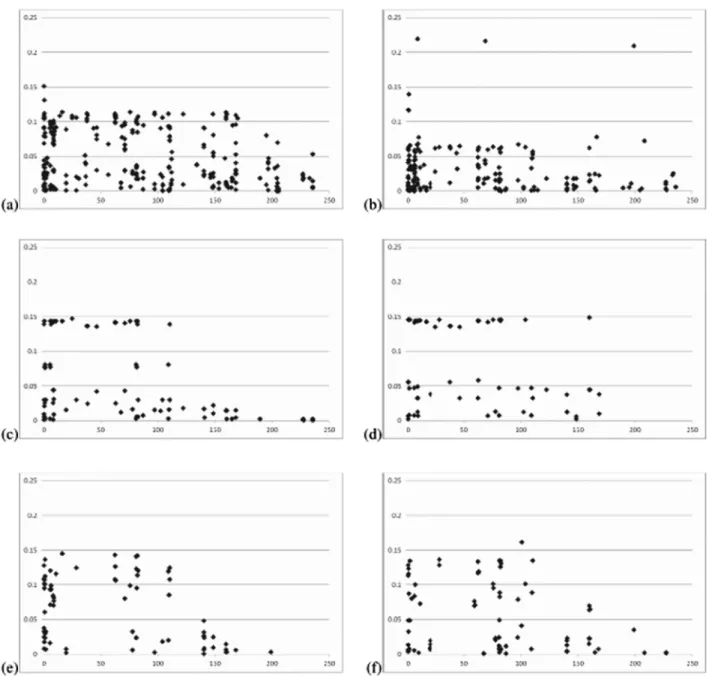
Hardy-Weinberg equilibrium was the factor that negatively af-fected the LD analysis. The percentage of polymorphic SNPs in Hardy-Weinberg equilibrium ranged from 18.5 in Beija-Flor c4 to 65.5 in Viçosa. Expected heterozygosity ranged from 0.29 in UFV MP-1 to 0.39 in Viçosa c2 fsf. The minimum and maximum average D and r2values were observed in Beija-Flor c4 and Viçosa c2 fsf, respectively. The lowest and highest average D’ values were observed in UFV MP-2 and Viçosa c2 fsf, respectively. In the simulated populations, the number of polymorphic SNPs agreed with the value expected at the 5% significance level (at least 91), the expected heterozygosity approached the maximum value, and 10 generations of random mating decreased LD values. Also as expected, average LD values for linked SNPs were greater than those for linked and unlinked SNPs. This decrease occurred only in 50% of the cases for the popcorn populations. In the tropical popcorn popula-tions, D-values greater than 0.10 were observed for SNPs separated by 100-150 Mb. Most of the D-values relative to the temperate populations were less than 0.05 (Figure 1). For the simulated populations, SNPs separated by more than 50 Mb generally exhibited a D-value less than 0.05, and SNPs separated by less than 10 Mb generally showed a D-value greater than 0.10.
Efficiency of selection
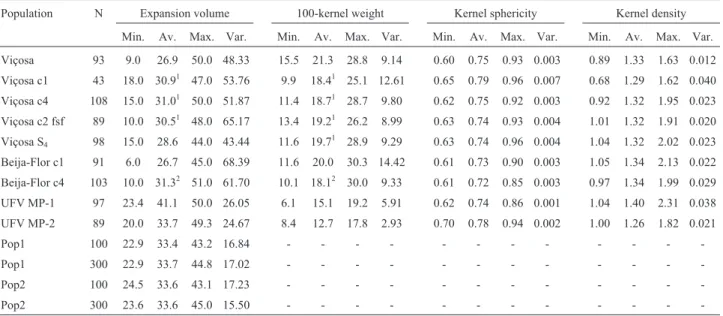
According to at-test at the 5% significance level, the selection process used on non-inbred and inbred progeny caused, with one exception, an increase in the mean expan-sion volume of the base populations (Viçosa and Beija-Flor c1) and an indirect decrease in 100-kernel weight (Table 3). Compared with tropical populations, temperate popula-tions had a greater expansion volume and a lower 100-kernel weight, with lower phenotypic variance for both traits. The tropical and temperate populations had
equiva-Table 2- Population, number of genotyped individuals (Ng), number of polymorphic SNPs (Np), number of SNPs in Hardy-Weinberg equilibrium (Ne), average expected heterozygosity (He), and average absolute values of the LD measures by chromosome and for all SNPs1.
Population Ng Np Ne He D D’ r2 D1 D’1 r21
Viçosa 99 87 57 0.3049 0.0491 0.8059 0.1949 0.0401 0.7742 0.1660
Viçosa c1 73 89 44 0.3063 0.0298 0.7455 0.1461 0.0282 0.7624 0.1507
Viçosa c4 112 79 28 0.3739 0.0540 0.9107 0.3190 0.0650 0.9325 0.4008
Viçosa c2 fsf 113 76 24 0.3910 0.0741 0.9712 0.4128 0.0800 0.9842 0.4764
Viçosa S4 112 78 30 0.3833 0.0646 0.8014 0.3362 0.0666 0.7484 0.3552
Beija-Flor c1 107 82 31 0.3750 0.0520 0.8035 0.2593 0.0501 0.8134 0.2552
Beija-Flor c4 38 54 10 0.4300 0.0076 0.8108 0.0176 0.0061 0.7614 0.0207
UFV MP-1 95 66 37 0.2879 0.0268 0.7913 0.2005 0.0275 0.7732 0.1992
UFV MP-2 95 61 31 0.3141 0.0169 0.6975 0.1278 0.0165 0.6765 0.1312
Pop1 100 96 93 0.4869 0.0670 0.3392 0.1311 0.0272 0.1389 0.0296
Pop1 300 96 91 0.4858 0.0647 0.3233 0.1268 0.0195 0.0979 0.0232
Pop2 100 96 94 0.4792 0.0454 0.2450 0.0682 0.0252 0.1373 0.0214
lent kernel sphericities and densities. The simulated popu-lations showed the same mean and phenotypic variance regardless of sample size. Estimates of phenotypic correla-tions for expansion volume and kernel traits included some significant values (p< 0.05,t-test), but were characterized by intermediate (0.4) to low (0.2) magnitudes, especially for tropical populations. The sign of the estimates was also variable depending on the population.
SNP frequency change
Selection for expansion volume was accompanied by increases in LD values in the Viçosa population (Table 2), population differentiation, and significant (non-random) changes in SNP frequency (Table 4). Increases in average
LD values occurred only after four cycles of half-sib and inbred progeny selection and after two cycles of full-sib se-lection. With respect to linked SNPs, increases in average D, D’, and r2ranged from approximately 10% to 51%, 13% to 20%, and 64% to 118%, respectively. The increments for linked and unlinked SNPs were even higher. The genetic differentiation was proportional to the number of cycles. Relative to the Viçosa population, FSTranged from 0.09 in
Viçosa c1 to 0.16 in Viçosa S4. The highest FSTestimates,
ranging from 0.19 to 0.34, were observed between tropical and temperate populations. The lowest value (0.00) was ev-idence of no genetic differentiation between Beija-Flor c1 and Beija-Flor c4 populations. Interestingly, genetic
entiation between the improved Viçosa and Beija-Flor pop-ulations was negligible (less than 0.05).
These findings are partially consistent with results from the population structure analysis. The inferred plateau method uncovered six subpopulations corresponding to
UFV MP-1, UFV MP-2, Viçosa, three Viçosa-derived pop-ulations as a fourth subpopulation, Viçosa S4and
Beija-Flor derived populations as a fifth subpopulation, and a non-existent population (with individuals in the five previ-ous subpopulations). Based on the Waples’ test, the number
Figure 1 - (cont.)
Table 3- Population, number of phenotyped individuals (N), and minimum, average, maximum and variance for expansion volume (mL/g), 100-kernel weight (g), kernel sphericity, and kernel density (g/mL)
Population N Expansion volume 100-kernel weight Kernel sphericity Kernel density
Min. Av. Max. Var. Min. Av. Max. Var. Min. Av. Max. Var. Min. Av. Max. Var.
Viçosa 93 9.0 26.9 50.0 48.33 15.5 21.3 28.8 9.14 0.60 0.75 0.93 0.003 0.89 1.33 1.63 0.012
Viçosa c1 43 18.0 30.91 47.0 53.76 9.9 18.41 25.1 12.61 0.65 0.79 0.96 0.007 0.68 1.29 1.62 0.040
Viçosa c4 108 15.0 31.01 50.0 51.87 11.4 18.71 28.7 9.80 0.62 0.75 0.92 0.003 0.92 1.32 1.95 0.023
Viçosa c2 fsf 89 10.0 30.51 48.0 65.17 13.4 19.21 26.2 8.99 0.63 0.74 0.93 0.004 1.01 1.32 1.91 0.020
Viçosa S4 98 15.0 28.6 44.0 43.44 11.6 19.71 28.9 9.29 0.63 0.74 0.96 0.004 1.04 1.32 2.02 0.023
Beija-Flor c1 91 6.0 26.7 45.0 68.39 11.6 20.0 30.3 14.42 0.61 0.73 0.90 0.003 1.05 1.34 2.13 0.022
Beija-Flor c4 103 10.0 31.32 51.0 61.70 10.1 18.12 30.0 9.33 0.61 0.72 0.85 0.003 0.97 1.34 1.99 0.029
UFV MP-1 97 23.4 41.1 50.0 26.05 6.1 15.1 19.2 5.91 0.62 0.74 0.86 0.001 1.04 1.40 2.31 0.038
UFV MP-2 89 20.0 33.7 49.3 24.67 8.4 12.7 17.8 2.93 0.70 0.78 0.94 0.002 1.00 1.26 1.82 0.021
Pop1 100 22.9 33.4 43.2 16.84 - - -
-Pop1 300 22.9 33.7 44.8 17.02 - - -
-Pop2 100 24.5 33.6 43.1 17.23 - - -
-Pop2 300 23.6 33.6 45.0 15.50 - - -
-1
of SNPs with significant (p < 0.05%) allele frequency changes relative to the base populations (Viçosa and Beija-Flor c1) ranged from 23 in Viçosa c1 to 41 in Viçosa c4, proportional to the number of cycles. The average change in SNP frequency ranged from 0.21 in Beija-Flor c4 to 0.30 in Viçosa c4 and Viçosa S4, which was also
propor-tional to the number of cycles. Unexpected significant changes in SNP frequencies in the simulated population Pop2, with a sample size of 300, ranged from 0.10 to 0.14 (average of 0.12). It should be noted that one to seven SNPs in almost all bins showed significant frequency changes.
Association mapping
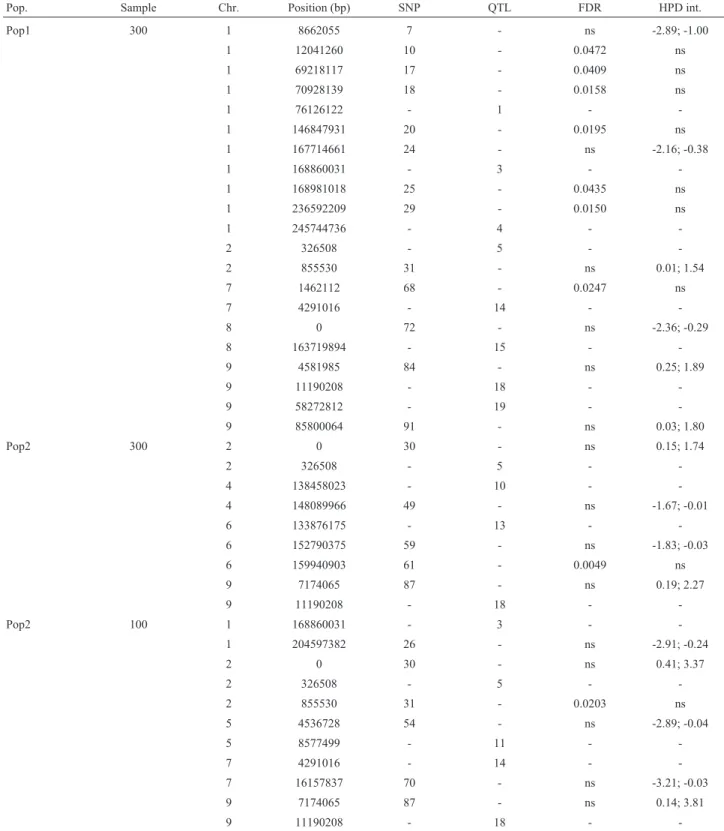
Not a single significant association at a FDR of 5% was observed in the popcorn populations. Assuming a FDR of 10%, we found three associations for expansion volume, two associations for 100-kernel weight, and seven associa-tions for kernel density in distinct populaassocia-tions (Table 5). The Bayesian GWAS uncovered no significant tions. With respect to the simulated populations, associa-tion mapping at 5% level of significance revealed 13
significant associations in Pop1 with a sample size of 300, five significant associations in Pop2 with a sample size of 300, no significant associations in Pop1 with 100 individu-als, and, surprisingly, six significant associations in Pop2 with 100 individuals (Table 6). Most of the significant asso-ciations were uncovered by Bayesian GWAS. Analyses of both field and simulated data evidenced differences be-tween least squares regression and Bayesian GWAS re-sults, and between SNPs with significant associations. Only SNPs 30 and 87 showed an association in Pop2 at both sample sizes, identifying QTLs 5 and 18, respectively. These two QTLs were also identified from the analysis of Pop1 data with a sample size of 300, but the associations were with SNPs 31 and 84. Importantly, no false positives were apparent, and in 70% of the significant associations, the distance between the SNP and the candidate gene ranged from 121 to 11,867 kb (average of 4,117 kb).
We found one or more candidate genes for each SNP with a significant association at a FDR of 10% and/or a sig-nificant frequency change at 0.05% (see Tables S1 and S2 in the Supplementary Material). In general, the identified candidate genes are involved in starch biosynthesis, lipid metabolism, cell wall polysaccharide (hemicellulose, cellu-lose, and pectin) biosynthesis, and storage protein meta-bolic/catabolic processes such as a-zein synthesis. Expression levels of these candidate genes in seeds (em-bryo, endosperm, and pericarp) are variable, generally ranging from intermediate to high depending on the repro-ductive stage (R1 to R4).
Discussion
Selection based on expansion volume indirectly led to a decrease in the number of polymorphic SNPs and in the number of SNPs in Hardy–Weinberg equilibrium, and an increase in expected heterozygosity, FST, and D and r2
val-Table 4- Number of SNPs with significant allele frequency change by the Waples’s test at 0.05% (N), and minimum, average, and maximum of the absolute value of the significant allele frequency changes in relation to population Viçosa, Beija-Flor c1, or Pop1
Population N Minimum Average Maximum
Viçosa c1 23 0.1848 0.2748 0.5493
Viçosa c4 41 0.0657 0.3004 0.8254
Viçosa c2 fsf 40 0.0657 0.2862 0.6537
Viçosa S4 35 0.1012 0.2999 0.7853
Beija-Flor c4 25 0.1635 0.2136 0.4299
Pop21 0 0.0000 0.0551 0.1600
Pop22 5 0.1017 0.1220 0.1433
1Sample size 100;2sample size 300.
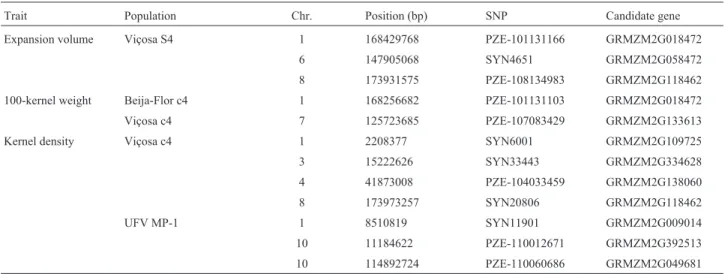
Table 5- Location of SNPs with significant association at a false discovery rate of 10% for expansion volume, 100-kernel weight, or kernel density, in popcorn populations, and the candidate genes.
Trait Population Chr. Position (bp) SNP Candidate gene
Expansion volume Viçosa S4 1 168429768 PZE-101131166 GRMZM2G018472
6 147905068 SYN4651 GRMZM2G058472
8 173931575 PZE-108134983 GRMZM2G118462
100-kernel weight Beija-Flor c4 1 168256682 PZE-101131103 GRMZM2G018472
Viçosa c4 7 125723685 PZE-107083429 GRMZM2G133613
Kernel density Viçosa c4 1 2208377 SYN6001 GRMZM2G109725
3 15222626 SYN33443 GRMZM2G334628
4 41873008 PZE-104033459 GRMZM2G138060
8 173973257 SYN20806 GRMZM2G118462
UFV MP-1 1 8510819 SYN11901 GRMZM2G009014
10 11184622 PZE-110012671 GRMZM2G392513
ues in populations derived from Viçosa after two or four non-inbred progeny selection. The selection procedures also caused several non-random changes in SNP frequen-cies. Theoretically, the possible causes are selection
(indi-rectly, due to linkage disequilibrium between the SNPs and QTLs for quality), genetic drift (due to finite population size), migration, and mutation. Migration and mutation should be irrelevant causes. The inclusion of the simulated
Table 6- Location of SNPs with significant association for expansion volume, based on a false discovery rate (FDR) of 5% or the 95% highest probability density (HPD) interval of the regression coefficients, and location of the closest QTL (candidate gene), in two simulated populations
Pop. Sample Chr. Position (bp) SNP QTL FDR HPD int.
Pop1 300 1 8662055 7 - ns -2.89; -1.00
1 12041260 10 - 0.0472 ns
1 69218117 17 - 0.0409 ns
1 70928139 18 - 0.0158 ns
1 76126122 - 1 -
-1 146847931 20 - 0.0195 ns
1 167714661 24 - ns -2.16; -0.38
1 168860031 - 3 -
-1 168981018 25 - 0.0435 ns
1 236592209 29 - 0.0150 ns
1 245744736 - 4 -
-2 326508 - 5 -
-2 855530 31 - ns 0.01; 1.54
7 1462112 68 - 0.0247 ns
7 4291016 - 14 -
-8 0 72 - ns -2.36; -0.29
8 163719894 - 15 -
-9 4581985 84 - ns 0.25; 1.89
9 11190208 - 18 -
-9 58272812 - 19 -
-9 85800064 91 - ns 0.03; 1.80
Pop2 300 2 0 30 - ns 0.15; 1.74
2 326508 - 5 -
-4 138458023 - 10 -
-4 148089966 49 - ns -1.67; -0.01
6 133876175 - 13 -
-6 152790375 59 - ns -1.83; -0.03
6 159940903 61 - 0.0049 ns
9 7174065 87 - ns 0.19; 2.27
9 11190208 - 18 -
-Pop2 100 1 168860031 - 3 -
-1 204597382 26 - ns -2.91; -0.24
2 0 30 - ns 0.41; 3.37
2 326508 - 5 -
-2 855530 31 - 0.0203 ns
5 4536728 54 - ns -2.89; -0.04
5 8577499 - 11 -
-7 4291016 - 14 -
-7 16157837 70 - ns -3.21; -0.03
9 7174065 87 - ns 0.14; 3.81
9 11190208 - 18 -
populations evidenced that genetic drift is not a relevant cause. Notice the equivalence between the parameters esti-mated in the populations with sample sizes 300 (lower ge-netic drift) and 100 (higher gege-netic drift). It should be also highlighted that the average random change in SNP fre-quencies in the simulated populations was lower than the average changes in the popcorn populations.
Newellet al.(2014) observed an increase in LD be-tween SNPs having significant associations with nine levels over cycles of divergent selection for methio-nine content. The LD increase occurred for linked and unlinked SNPs. They also observed changes in allele fre-quencies for two genes controlling methionine concentra-tion. At thecys2locus, one allele showed a decrease with selection for high methionine content (from 0.25 to 0.01) and an increase with selection for low methionine content (from 0.25 to 0.74). Wenet al.(2011) observed that 57% of SNPs with significant allelic frequency changes among ac-cession regenerations were within flowering-time QTL re-gions, which was evidence of assortative mating.
Our results revealed greater LD for SNPs separated by more than 10 Mb in tropical populations than in both temperate and simulated populations. In general, tropical populations showed average LD values greater than those of temperate populations. However, LD in the tropical pop-ulations was lower than that observed in a second-generation composite and higher than that in the composite after 10 generations of random crosses. Truntzler et al.
(2012) analyzed the extent of LD using a dent maize panel with public and private inbreds. For SNPs separated by 0 to 1,000 bp, the average r2 was higher for Syngenta lines (0.61) than for public lines (0.39). For SNPs separated by 1 to 10 Mb, the average r2was 0.03 and 0.04 for public and Syngenta inbreds, respectively. In a study on the extent of LD in commercial maize germplasm, Van Inghelandtet al.
(2011) observed r2values for unlinked and linked SNPs re-spectively ranging from 0.009 to 0.013 and 0.020 to 0.029 relative to four heterotic pools.
The differing efficacy of least squares association mapping and Bayesian GWAS to detect true associations, as evidenced by the analysis of the simulated data, can be best attributed to the reduced proportion of phenotypic variance explained by the QTLs. In QTL mapping studies performed by Yongbinet al.(2012), Liet al.(2006, 2007, 2008, 2009), Babuet al.(2006), and Luet al.(2003), the proportion of phenotypic variance explained by QTLs for expansion volume ranged from 3.1% to 35.9%, with aver-age values varying from 4.7% to 15.5%. These high values are due to the phenotyping of progeny or recombinant in-bred lines (RILs) instead of plants. In regard to the field data, inefficiency in the identification of QTLs for expan-sion volume and other quality traits in the breeding popula-tions or in validation of previously identified QTLs can be best explained by reduced heritability. Estimated herita-bilities at the plant level for expansion volume in the two
temperate populations were 53.2% and 50.7%; these values were lower than the heritabilities at the progeny level ob-served in the previous QTL mapping studies, which ranged from 72.0 to 83.0% with F2:3, BC1S1, or BC2F2 designs.
From an analysis of RILs in four environments, Yongbinet al.(2012) mapped seven QTLs for expansion volume and obtained an estimated heritability of 90.0%.
To identify candidate genes for expansion volume and other popcorn quality traits, we based our analysis on kernel physiochemical characteristics affecting expansion volume, such as kernel size, shape, and density as well as kernel moisture, starch, protein, and fatty acid contents. The endosperm is the most important kernel component af-fecting popping, while starch is the major polymer involved in popcorn expansion. Popcorn kernels contain both vitre-ous (horny or hard) and opaque (floury or soft) endosperm. During popping, starch granules in the vitreous endosperm are highly expanded and responsible for flake formation, whereas starch granules in the opaque endosperm appear to undergo little change. Acting as a pressure vessel during heating, the pericarp gives popcorn its distinct popping ability. The pericarp is the primary source of fiber in the popcorn kernel, while the germ (embryo) is the primary source of lipids. Other than fracturing the pericarp, popping does not substantially alter either the germ or pericarp. In general, small- to medium kernel size (lower 100-kernel weight) and greater kernel sphericity, kernel density, ratio of vitreous to opaque endosperm, and linoleic acid, oleic acid, anda-zein protein levels are associated with greater
expansion volume. Pericarp damage and thickness also greatly affect expansion volume (Sweleyet al., 2013).
One candidate gene for SNPs SYN4651 and SYN4646 is GRMZM2G058472 (Gramene ID). The gene product is a glycosyltransferase involved in synthesis of glucuronoxylan, a polysaccharide of the hemicellulose fraction of the cell wall. The gene exhibits intermediate ex-pression level in the pericarp during the middle fruit ripen-ing stage (R3). GRMZM2G060579 is the candidate gene for SNPs PZE-107105783 and SYN36108. This gene en-codes an uncharacterized protein involved in pectin bio-synthesis and shows an intermediate level of expression in the entire seed (embryo, endosperm, and pericarp) during early to middle stages of fruit ripening (R1 to R4). Tan-djunget al.(2005) showed that cellulose forms crystalline structures in the popcorn pericarp during microwave heat-ing, thereby improving moisture retention and popping per-formance, the latter mainly by decreasing the number of unpopped kernels.
uncharacterized protein that participates in protein meta-bolic processes and shows intermediate to high levels of ex-pression in the embryo during early to middle fruit ripening stages. The candidate genes for SNPs PZE-101083826, SYN38509, and SYN38510 are GRMZM2G179521 and GRMZM2G074946; their respective gene products, 6-phosphogluconolactonase and glucose-6-phosphate 1-dehydrogenase, participate in the oxidative pentose phos-phate pathway, which is a critical process for maize endo-sperm starch accumulation (Spielbauer et al., 2013). Surprisingly, these genes show intermediate to low levels of expression in the entire seed during early to middle stages of fruit ripening.
The candidate gene for SNPs 104033459, PZE-104033791, and PZE-104033817 is GRMZM2G138060 (sugary1), a determinant of starch composition in maize kernels (Jameset al., 1995). This gene shows high level of expression in seeds (especially endosperm) during early to middle stages of fruit ripening.
Among the SNPs with significant frequency changes, PZE-104008299, SYN33394, and SYN526 are particularly of interest. Changes in the frequency of these SNPs ranged from 0.23 to 0.38, 0.15 to 0.39, and 0.35 to 0.50, respec-tively. The SNP PZE-104008299 is located in a region con-taining at least 12 genes coding for precursors ofa-zeins, which are storage proteins accounting for 70% of maize en-dosperm protein (Holding and Larkins, 2006). Alla-zein genes (including 19B1, PMS1, A30, and Z4) are highly ex-pressed in the endosperm during early to middle stages of fruit ripening. The candidate gene for SNP SYN33394 is GRMZM2G429899 (shrunken-2), which encodes glu-cose-1-phosphate adenylyltransferase large subunit 1 in-volved in starch biosynthesis. Mutation at this locus greatly reduces starch levels in the endosperm (Bhaveet al., 1990). The gene is highly expressed in the endosperm during early to middle stages of fruit ripening. Finally, the candidate gene for SNP SYN526 is GRMZM2G007063 (ohp2). Sim-ilar to the well-known opaque-2 locus (o2), this gene also regulates the expression of many members of the zein multigene family of storage proteins (Ciceriet al., 1999). The gene displays intermediate to high levels of expression in the entire seed during early to middle stages of fruit rip-ening.
To conclude, our results confirm some previously mapped QTLs for popcorn quality traits and provide evi-dence for several candidate genes affecting starch, storage protein, and oil content of popcorn kernels and pericarp polysaccharide content. The highlighted candidate genes are located in bins 1.04, 3.08, 4.02, 4.05, 5.01, 6.05, 7.02, 7.04, and 10.04. Yongbin et al. (2012), Li et al. (2006, 2007, 2008, 2009), Babuet al.(2006), and Luet al.(2003) mapped QTLs for expansion volume in bins 1.04, 3.08, 4.02, 4.05, 5.01, 6.05, 7.03, and 10.04, among others. The main candidate genes affecting starch content are located in bins 1.04, 3.08, and 4.05. Those related to storage protein
content are located in bins 4.02, 5.01, and 7.02. Some can-didate genes associated with oil content were found in bins 1.01, 3.04, and 7.04. Yanyanget al.(2008) mapped QTLs for starch, protein, and oil concentration. Four of the six QTLs for starch content were mapped in bins 1.01, 1.06-1.07, and 4.01-4.02. Three of the seven QTLs for protein content were mapped in bins 4.01-4.02, 7.01, and 7.03. Three of the five QTLs for oil content were mapped in bins 1.03, 3.04, and 7.03.
Acknowledgments
The National Council for Scientific and Technologi-cal Development (CNPq), the Brazilian Federal Agency for Support and Evaluation of Graduate Education (Capes), and the Foundation for Research Support of Minas Gerais State (Fapemig) provided financial support.
References
Babu R, Nair SK, Kumar A, Rao HS, Verma P, Gahalain A, Singh IS and Gupta HS (2006) Mapping QTLs for popping ability in a popcorn x flint corn cross. Theor Appl Genet 112:1392-1399.
Benjamini Y and Hochberg Y (1995) Controlling the false discov-ery rate: a practical and powerful approach to multiple test-ing. J R Stat Soc B 57:289-300.
Bhave MR, Lawrence S, Barton C, Hannah C (1990) ldentifi-cation and molecular characterization ofshrunken-2cDNA clones of maize. The Plant Cell 2:581-588.
Browning SR and Browning BL (2007) Rapid and accurate haplo-type phasing and missing data inference for whole genome association studies using localized haplotype clustering. Am J Hum Genet 81:1084-1097.
Ciceri P, Locatelli F, Genga A, Viotti A and Schmidt RJ (1999) The activity of the maize opaque2 transcriptional activator is regulated diurnally. Plant Physiol 121:1321-1327.
Falush D, Stephens M and Pritchard JK (2003) Inference of popu-lation structure using multilocus genotype data: linked loci and correlated allele frequencies. Genetics 164:1567-1587. Flint-Garcia SA, Thornsberry JM and Buckler ES (2003)
Struc-ture of linkage disequilibrium in plants. Annu Rev Plant Biol 54:357-374.
Flint-Garcia SA, Thuillet A, Yu J, Pressoir G, Romero SM, Mitchel SE, Doebley J, Kresovich S, Goodman MM and Buckler ES (2005) Maize association population: a high-resolution platform for quantitative trait locus dissection. The Plant J 44:1054-1064.
Gupta PK, Rustgi S and Kulwal PL (2005) Linkage disequilib-rium and association studies in higher plants: Present status and future prospects. Plant Mol Biol 57 :461-485.
Holding BR and Larkins BA (2006) The development and impor-tance of zein protein bodies in maize endosperm. Maydica 51:243-254.
James MG, Robertson DS and Myers AM (1995) Characterization of the maize genesugaryl,a determinant of starch composi-tion in kernels. The Plant Cell 7:417-429.
Li YL, Dong YB and Niu SZ (2006) QTL Analysis of popping fold and the consistency of QTLs under two environments in popcorn. Acta Genet Sinic 33:724-732.
Li YL, Dong YB, Niu SZ and Cui DQ (2007) QTL for popping characteristics in popcorn. Plant Breed 126:509-514. Li YL, Dong YB, Niu SZ, Cui DQ, Wang YZ, Liu YY, Wei MG
and Li XH (2008) The genetic relationship between popping expansion volume and two yield components in popcorn us-ing unconditional and conditional QTL analysis. Euphytica 162:345-351.
Li YL, Dong YB, Niu SZ and Cui DQ (2009) Identification of QTL for popping characteristics using a BC2F2population
and comparison with its F2:3population in popcorn. Agric
Sci China 8:137-143.
Liu K and Muse SV (2005) PowerMarker: integrated analysis enviroment for genetic marker data. Bioinformatics 21:2128-2129.
Lu HJ, Bernardo R and Ohm HW (2003) Mapping QTL for pop-ping expansion volume in popcorn with simple sequence re-peat markers. Theor Appl Genet 106:423-427.
Martin AD, Quinn KM and Park JH (2011) MCMCpack: Markov chain Monte Carlo in R. J Stat Softw 42:1-21.
Newell MA, Vogel KE, Adams M, Aydin N, Bodnar AL, Ali M, Lauter ANM and Scott P (2014) Genetic and biochemical differences in populations bred for extremes in maize grain methionine concentration. BMC Plant Biol 14:e49. Peakall R and Smouse PE (2006) GENALEX 6: genetic analysis
in Excel Population genetic software for teaching and re-search. Mol Ecol Notes 6:288-295.
Rafalski JA (2010) Association genetics in crop improvement. Curr Opin Plant Biol 13:174-180.
Riedell WE and Miernyk JA (1988) Glycoprotein synthesis in maize endosperm cells. Plant Physiol 87:420-426.
SAS Institute. 2007. The SAS system for Windows. Release 9.2. SAS Inst., Cary, NC.
Smith BJ (2007) Boa: an R package for MCMC output conver-gence assessment and posterior inference. J Stat Softw 21:1-37.
Spielbauer G, Li L, Römisch-Margl L, Do PT, Fouquet R, Fernie AR, Eisenreich W, Gierl A and Settles AM (2013) Chloro-plast-localized 6-phosphogluconate dehydrogenase is criti-cal for maize endosperm starch accumulation. J Exp Bot 64:2231-2242.
Stich B and Melchinger AE (2009) Comparison of mixed-model approaches for association mapping in rapeseed, potato, sugar beet, maize, and Arabidopsis. BMC Genomics 10:e94. Sweley JC, Rose DJ and Jackson DS (2013) Quality traits and popping performance considerations for popcorn (Zea mays Everta). Food Rev Int 29:157-177.
Tandjung AS, Janaswamy S, Chandrasekaran R, Abaoubacar A and Hamaker BR (2005) Role of the pericarp cellulose ma-trix as a moisture barrier in microwaveable popcorn. Bio-macromolecules 6:1654-1660.
Thirunavukkarasu N, Hossain F, Shiriga K, Mittal S, Arora K, Rathore A, Mohan S, Shah T, Sharma R, Namratha PM,et al.(2013) Unraveling the genetic architecture of subtropical maize (Zea mays L.) lines to assess their utility in breeding programs. BMC Genomics 14:e877.
Thirunavukkarasu N, Hossain F, Arora K, Sharma R, Shiriga K, Mittal S, Mohan S, Namratha PM, Dogga S, Rani TS,et al. (2014) Functional mechanisms of drought tolerance in
sub-tropical maize (Zea maysL.) identified using genome-wide association mapping. BMC Genomics 15:e1182.
Tian Y, Buriak P and Eckhoff SR (2001) Effect of hybrid and physical properties of individual popcorn kernels on expan-sion volume. Cereal Chem 78:578-582.
Truntzler M, Ranc N, Sawkins MC, Nicolas S, Manicacci D, Lespinasse D, Ribière V, Galaup P, Servant F, Muller C,et al.(2012) Diversity and linkage disequilibrium features in a composite public/private dent maize panel: consequences for association genetics as evaluated from a case study using flowering time. Theor Appl Genet 125:731-747.
Van Inghelandt D, Reif JC, Dhillon BS, Flament P and Melchin-ger AE (2011) Extent and genome-wide distribution of link-age disequilibrium in commercial maize germplasm. Theor Appl Genet 123:11-20.
Viana JMS, Valente MSF, Silva FF, Mundim GB and Paes GP (2013) Efficacy of population structure analysis with breed-ing populations and inbred lines. Genetica 141:389-399. Vyn TJ and Tollenaar M (1998) Changes in chemical and physical
quality parameters of maize grain during three decades of yield improvement. Field Crops Res 59:135-140.
Waples RS (1989) Temporal variation in allele frequencies: test-ing the right hypothesis. Evolution 43:1236-1251.
Weir BS (2008) Linkage disequilibrium and association mapping. Annu Rev Genomics Hum Genet 9:129-142.
Weir BS (2010) Statistical genetic issues for genome-wide associ-ation studies. Genome 53:869-875.
Wen W, Taba S, Shah T, Tovar VHC and Yan J (2011) Detection of genetic integrity of conserved maize (Zea maysL.) germ-plasm in genebanks using SNP markers. Genet Resour Crop Evol 58:189-207.
Yang X, Yan J, Shah T, Warburton ML, Li Q, Li L, Gao Y, Chai Y, Fu Z, Zhou Y,et al.(2010) Genetic analysis and charac-terization of a new maize association mapping panel for quantitative trait loci dissection. Theor Appl Genet 121:417-431.
Yanyang L, Yongbin D, Suzhen N, Dangqun C, Yanzhao W, Mengguan W, Xuehui L, Jiafeng F, Zhongwei Z, Huanqing C and Yuling L (2008) QTL identification of kernel compo-sition traits with popcorn using both F2:3and BC2F2
popula-tions developed from the same cross. J Cereal Sci 48:625-631.
Yongbin D, Zhongwei Z, Qingling S, Qilei W, Qiang Z and Yuling L (2012) Quantitative trait loci mapping and meta-analysis across three generations for popping characteristics in popcorn. J Cereal Sci 56:581-586.
Internet Resources
NCBI Database of Single Nucleotide Polymorphisms, http://www.ncbi.nlm.nih.gov/snp (March-April 2015). Maize Genetics and Genomics database,
http://www.maizegdb.org (March-April 2015).
MaizeCyc database, http://maizecyc.maizegdb.org/MAIZE/or-ganism-summary (March-April 2015).
Maize eFP browser,
http://bar.utoronto.ca/efp_maize/cgi-bin/efpWeb.cgi (March-April 2015).
Gramene database,
Supplementary Material
The following online material is available for this ar-ticle:
Table S1 - Information on SNPs showing significant association at a false discovery rate of 10% with expansion volume, 100-kernel weight, or kernel density, and on candi-date genes.
Table S2 - Information on SNPs with significant al-lele frequency change at 0.05% and candidate genes.
This material is available as part of the online article from http://www.scielo.org/gmb
Associate Editor: Dario Grattapaglia