0103 - 5053 $6.00+0.00
Article
Hydrogen Peroxide Assessment in Exhaled Breath Condensate: Condensing
Equipment-Rapid Flow Injection Chemiluminescence Method
Efstathios G. Vasiliou,a Yaroslava M. Makarovska,#, a Ioannis A. Pneumatikos, b Nikolaos V. Lolis, c Evangelos A. Kalogeratos, c Emmanuel K. Papadakisc and Constantinos A. Georgiou*,a
a
Chemistry Laboratory, Agricultural University of Athens, Greece
b
Critical Care Unit, University Hospital of Alexandroupoli, Greece
c
Pulmonary and Critical Care Unit, Hospital of Chest Diseases “Sotiria”, Athens, Greece
Diversas biomoléculas analisadas na Condensação Respiratória Exalada (CRE) podem ser usadas como biomarcadoras, fornecendo informação clínica útil em doenças inflamatórias pulmonares. Peróxido de hidrogênio é um biomarcador especial, pois pode estar relacionado diretamente ao stress oxidativo gerado no corpo humano. Métodos para peróxido de hidrogênio em CRE são essenciais para um grande número de estudos, desde básicos até diagnósticos de doenças. Os métodos usados atualmente não são automatizados, são demorados e cansativos. Além disso, a maioria dos equipamentos de condensação não é portátil. Assim, desenvolvemos um equipamento portátil como uma alternativa extra e um método totalmente automático de injeção em fluxo (FI) com detecção por quimioluminescência para determinação de peróxido de hidrogênio. O equipamento proposto proporciona uma eficiência de coleta superior a 86%, permitindo coletar 2-3 mL de amostra em 20 min. O método envolve uma mistura em fluxo de solução de luminol como carregador da amostra com uma solução de cobalto(II). A reação de CRE com luminol na presença de cobalto(II) como catalisador produz luz proporcional à concentração de peróxido de hidrogênio. As características do método são limite de detecção de 10 nmol L–1 e boa linearidade (r= 0,997). Precisão e recuperações
são melhores do que 6,0% RSD e 64,9%, respectivamente. A comparação com o método fluorimétrico manual, comumente usado para CRE, mostrou diferença não significativa, P > 0,001, enquanto a correlação entre os métodos é alta, r=0,94. O método proporciona automatização no manuseio avaliando 180 amostras h–1 e baixo limite de detecção.
Several biomolecules in Exhaled Breath Condensate (EBC) can be used as breath biomarkers providing useful clinical information concerning inflammatory lung diseases. Hydrogen peroxide has a special place among biomarkers as it can be directly linked to oxidative stress built up in the human body. Methods for hydrogen peroxide in EBC are essential for a vast number of studies spanning from basic studies to disease diagnosis. Methods currently in use are not automated, time-consuming and tedious. Moreover, most condensing equipment in use is not portable. To address these, we developed portable condensing equipment as an extra alternative and a fully automated Flow Injection (FI) – Chemiluminescence method for hydrogen peroxide determination. The proposed condensing equipment provides collection efficiency better than 86% allowing the collection of 2-3 mL sample in 20 min. The method involves mixing a luminol solution stream that is used as sample carrier with a cobalt(II) stream. Reaction of EBC with luminol in the presence of cobalt(II) catalyst produces light proportional to hydrogen peroxide concentration. The automated FI method features a 10 nmol L–1 detection limit and good linearity (r= 0.997). Precision and recoveries are better than
6.0% RSD and 64.9%, respectively. Comparison with the, commonly used for EBC, manual fluorimetric method showed no significant difference, P > 0.001, while correlation of the methods is high, r=0.94. The method provides automation in sample handling, sample throughput of 180 samples h–1 and low detection limit.
Keywords: exhaled breath condensate, hydrogen peroxide, flow injection, chemiluminescence, portable condensing equipment
*e-mail: [email protected]
# On leave from the Institute for Scintillation Materials, Ukrainian National
Introduction
The last decade has shown growing interest in the use of Exhaled Breath Condensate (EBC) as means of clinical information leading to diagnosis and follow up treatment of lung diseases.1,2 This can be explained by EBC
composition. Although predominantly consisting of water, EBC contains dissolved non-volatile compounds including cytokines, lipids, surfactants, ions, oxidation products, adenosine, histamine, acetylcholine and serotonin. In addition, EBC encloses potentially volatile compounds, such as ammonia, hydrogen peroxide and ethanol, as well as volatile organic compounds.2 Such compounds are
products or by-products of protein, DNA, and lipid oxidation composed through reactions provoked by Reactive Oxygen Species (ROS), while their presence reflects oxidative stress built up.3
Increased concentrations of ROS and their products are often detected in EBCs collected from patients with various lung diseases such as asthma, adult respiratory distress syndrome, idiopathic pulmonary fibrosis, pneumonia, chronic obstructive pulmonary disease (COPD), cystic fibrosis, bronchiectasis, lung cancer and systemic inflammation.1–7 Concentration profiles of
detected compounds exhibit variations reflecting the severity of oxidative stress and could be clinically useful for diagnostic purposes.
Likewise, EBC based methods can be used for non-invasive, simple, safe and cost-effective medical diagnosis, as well as a research tool in identifying patient benefits from a given antioxidant or anti-inflammatory therapy.8
A further use concerns testing treatment responses9 and
efficiency of new drugs by assessing concentration decline of certain compounds after treatment.
The fact of the EBC being an area of great interest leads to continuous search for novel biomolecules of clinical significance. The main aim is correlation of the existence of such biomolecules to already diagnosed diseases.10 A good example of such a biomolecule is
hydrogen peroxide, which can be an important marker of oxidative stress in human lungs. Hence, the spectrum of clinical applications can be broad, as oxidative stress is a consequence of many different diseases. Elevated levels of hydrogen peroxide are found in the EBC of patients with bronchiectasis,11 acute respiratory distress syndrome
(ARDS),12 common cold,13 chronic obstructive pulmonary
disease (COPD),14 asthma,15 systemic sclerosis,16 uremia17
and community acquired pneumonia.18 These levels range
from 10 nmol L–1 to 10
µmol L–1.
The aforementioned concentration range is quite low and detection at such levels could be achieved through
fluorescence or chemiluminescence. Most of the methods used for hydrogen peroxide detection in the EBC of patients or healthy subjects are based on fluorescence detection.19-21 These are based on the
horseradish peroxidase catalyzed reaction of hydrogen peroxide with a suitable substrate to form a fluorescent dimmer. As far as chemiluminescence is concerned, only one method has been developed for hydrogen peroxide detection in EBC.22 This method is based on
the horseradish peroxidase catalyzed reaction of luminol with hydrogen peroxide. In addition to these main methods of hydrogen peroxide detection, there is also a colorimetric method that has been set up successfully but used minimally.23 This method is based
on the horseradish peroxidase catalyzed reaction of hydrogen peroxide with 3,3´,5,5´-tetramethylbenzidine forming a coloured product.
All the above-mentioned methods are time consuming, while some are tedious requiring prolonged sample preparation. These drawbacks can be avoided by the use of automation techniques. This has been recognized and led to the development of a FI based method using fluorescence detection.24 Nevertheless, in this method, the
FI system was merely used for sample transportation to the detector, while analytical derivatization was performed off-line, manually.
Based on the advances mentioned above we aimed at the development of a method to automate derivatization in combination with chemiluminescence detection to achieve full automation and high sample throughput. Moreover, convenient and portable condensing equipment was developed for EBC collection, for the use of hospital staff, as an alternative among portable methods in existence, to provide a simple and low-cost device.
Experimental
Reagents
Hydrogen peroxide, 30% in water solution, analytical grade, was obtained from Merck. Luminol, 97% analytical grade; homovanillic acid, analytical grade and glycine, 99% for TLC were obtained from Sigma-Aldrich. Ethylenediamine tetraacetic acid, analytical grade and horseradish peroxidase (HRP) were obtained from Serva. Cobalt (II) nitrate hexahydrate, 98%, analytical grade was obtained from Fluka. All other reagents used for buffer production were of analytical grade. Purified water supplied by Millipore Milli-Q water system was used throughout. Buffer used for the FI method was 0.10 mol L–1 Na
luminol in buffer, 1.00 mmol L–1 Co(II) in water and 2.5
mol L–1 H
2O2 in water were kept at +4 oC until use. Working
solutions of luminol in buffer, cobalt (II) in water and H2O2 standards in water were prepared daily.
Human subjects
Exhaled breath condensate was collected from patients with COPD (n=4), bronchial asthma (n=1) and pneumonia combined with myocardial infraction (n=1). Patients were hospitalized at the Pulmonary Department (n=2), as well as the Intensive Care Unit (n=4) of the Sotiria General Hospital (Athens, Greece). Participants, or relatives, gave their consent to be part of the investigation, after an appropriate briefing of the procedure that was to be followed, as well as an appropriate description of the aim of the study.
Condensing equipment and procedure
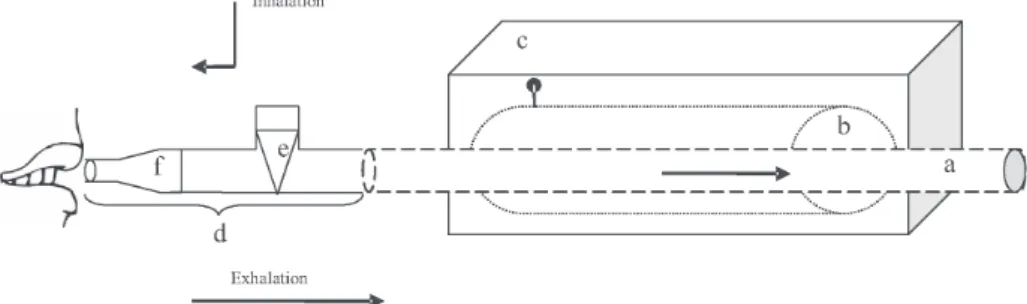
The condensing equipment is depicted in Figure 1. The apparatus is placed inside a wooden case, thermally insulated with fibreglass. The metal cylinder, a double walled vessel filed with propylene glycol (Load volume: ~1 L), is kept frozen at –80 °C. The condensation tube, made from glass, passes through the metal cylinder, the two edges merely extending outside the wooden case. A mouth piece is connected through the one way valve to the condensation tube. The main purpose of such a layout is to allow ambient air inhalation and to direct exhaled breath to the condensation tube during exhalation. Sterile-single use plastic pieces are used throughout. To avoid contamination, the glass condensation tube is washed with an antibacterial agent, rinsed with distilled water and sterilized before use. Patients are instructed to breathe normally through the Teflon mouthpiece. The breathing process lasts for approximately 20 min during which the patients use a nose clip to avoid nasal breathing. The metal cylinder freezes the glass tube provoking condensation
and freezing of exhaled breath. Likewise, EBC is entrapped inside the glass tube in a frozen form and the collection process ends with the glass tube removal, sealing with parafilm and storing at –80 oC till analysis.
Just before analysis, defrosting is effected at room temperature and EBC is collected in a sterile glass vial. The collection efficiency was assessed by connecting the condensing equipment to an ultrasonic hospital nebulizer loaded with 30 mL of saline physiological solution to simulate breathing. The simulation was performed by weighting the nebulizer (beaker + saline solution + tubing to the condensing equipment) before and after a collection session in order to compare the weight loss with that collected. The thus determined efficiency was better than 86%. The length of the sterile plastic tubing was 15 cm. The collected volume of EBC ranges between 2-3 mL for 20 min sampling. Such small collected volume compared to the collection tube’s nominal volume (~100 mL) ensures free gas flow without blocking of the collection tube by frozen samples. Once the collection device is removed from the freezer (–80 oC) it can be used during the next
hour. During that time, the temperature inside the box rises to –5 oC and refreezing for 1-2 h is required for proper
re-use. The main advantages of the condensing equipment are simplicity of layout, maximum collection efficiency, portability and a comparatively high operational time after freezing.
Analytical equipment and procedures
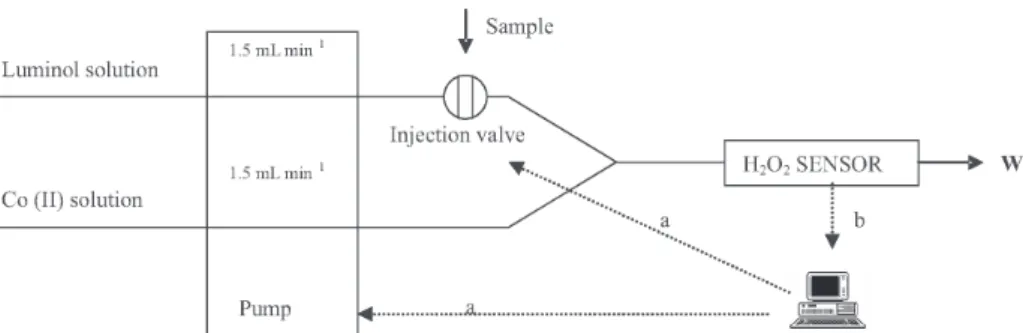
The developed method is based on the homemade FI system depicted in Figure 2. The system consists of an Ismatec IPC-8 peristaltic pump used for reagent pumping, a Valco C22Z-3186E six position injection valve used for injecting EBC samples in the carrier stream and a detector that uses a homemade sandwich type flow cell depicted in Figure 3 to divert the reaction mixture in front of a Hamamatsu HC-135 01 photomultiplier module that is used for chemiluminescence detection. The system setup
involves use of PTFE tubing, 1.6 mm external; 0.5 mm internal diameter, sample loop of 50 µL, flow rate of 1.5 mL min–1 and coil length (between the final convergence
point of the reactants and the detector) of 7 cm. Coil length was the minimum allowed length that permitted detection in the proposed home-made equipment. Hardware control, data acquisition and treatment are achieved through a homemade Labview program.
Analyser operation involves EBC injection in a luminol carrier stream. While flowing, the injected EBC sample mixes with luminol. The mixture converges downstream with a cobalt(II) catalyst stream that initiates the chemiluminescent reaction between luminol and hydrogen peroxide. This reaction takes place through a mechanism involving free radical formation and product excitation.25 Excited product
molecules return to the ground state through emission of photons that are counted by the detector and registered by the Labview program resulting in positive photon-counting peaks. Such peaks are illustrated in Figure 4 and their analytical information is extracted by peak height measurement, while the baseline signal is used as reagent blank. It should be noted that the shape of the peaks is illustrative of the speed of the reaction: The reaction is quite fast and only the descending part of the peaks is recorded.
The new automated FI assay was compared with the well-established fluorometric method of Ruch et al.26 as modified by Nowak et al.14 The Jobin Yvon fluorolog-3 spectrofluorometer used is a fully computer-controlled instrument that incorporates a double-grating monochromator for excitation and a single-grating emission monochromator. The spectrofluorometric determination setup involves excitation and emission slit widths set at 2 nm, acquisition interval of 1 nm, integration time of 0.3 s and right-angle geometry for acquisition in a 1.4 mL quartz cell. The analytical information is extracted by emission measurements.
Results and Discussion
Optimization
The FI parameter used for H2O2 quantitation in EBC is peak height. Peak height is a function of dispersion depending on flow system geometry, sample volume and reagents’ flow rates. Peak heights are also a function of reaction kinetics27
that are determined by concentration, pH and ionic strength of the reagent streams. Optimization was focused upon controlling two major factors affecting dispersion: sample loop and reagent flow rates, while keeping the geometry of the system intact. Optimization was further focused on two major factors affecting reaction kinetics:Luminol and Co(II) concentration, without changing the reagents pH and ionic strength. To facilitate complete reagent and catalyst stream mixing, a flow rate ratio of 1:1 was used throughout.
Co(II) concentration optimization
The optimization procedure regarding Co(II) con-centration involves hydrogen peroxide injections using
Figure 2. Flow injection system developed for hydrogen peroxide determination. Luminol solution: 4.0 × 10⁻⁵ mol L–1, Cobalt(II) solution: 2.0 × 10⁻⁶ mol L–1, Sample loop volume: 50
µL, W: waste, a: Digital control lines, b: Data acquisition line.
varying cobalt(II) solution concentrations. This is a univariate optimisation procedure using fixed sample loop volume of 50 µL, luminol concentration of 7.0 × 10⁻⁵ mol L–1 and reagents’ flow rates of 1.5 mL min–1. The effect of
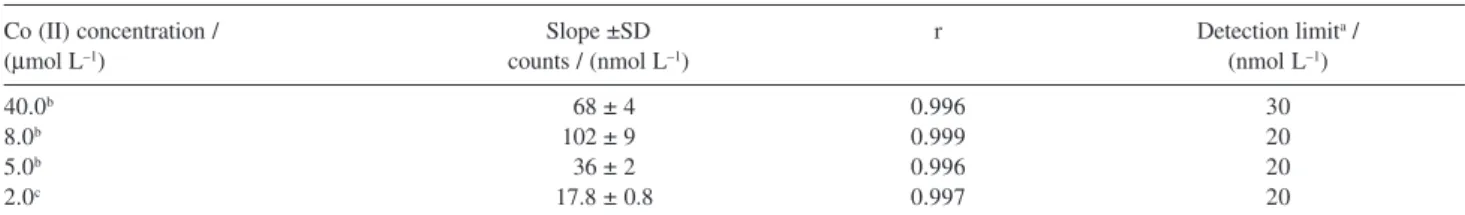
Co(II) concentration on the characteristics of the hydrogen peroxide calibration curve is shown in Table 1. Although optimum sensitivity (higher slop) was at 8.0 × 10⁻⁶ mol L–1
Co(II), the chosen concentration was 2.0 × 10⁻⁶ mol L–1, as
it provides a wider linear range towards smaller concentrations. This is a very important parameter that must be taken into account as samples analysed contain low hydrogen peroxide concentrations in close proximity to the lower end of the linear range.
Luminol concentration optimization
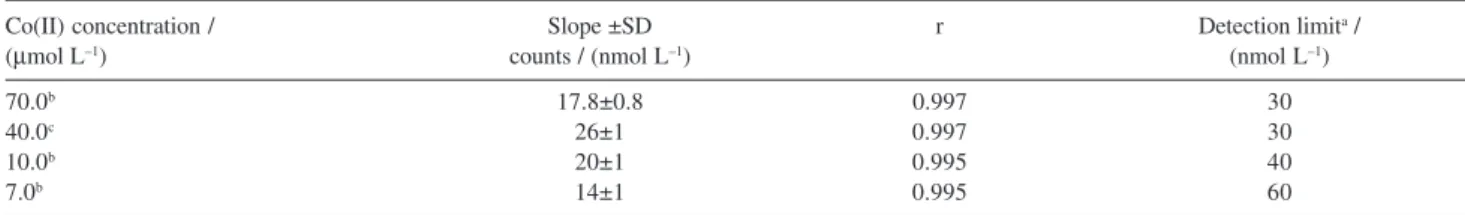
The optimization procedure regarding luminol concentration involves hydrogen peroxide injections using varying luminol solution concentrations. This is also a univariate optimization procedure using fixed sample loop volume of 50 µL, Co(II) solution of 2.0 × 10⁻⁶ mol L–1 and reagents’ flow rates of 1.5 mL min–1.
The effect of luminol concentration on the characteristics of the hydrogen peroxide calibration curve is shown in
Table 2. It is quite obvious that the optimum luminol concentration is 4.0 × 10⁻⁵ mol L–1, as it provides best
sensitivity and lowest detection limit.
Sample volume optimization
The univariate sample loop optimization procedure that was followed involves hydrogen peroxide measurements using a specific flow rate with different sample loop volumes. It is well established that sample volume changes dispersion modifying FI signals. In this study, a hydrogen peroxide concentration of 5.0 × 10⁻⁷ mol L–1 is injected using a flow
rate of 0.9 mL min–1. The sample loop volumes tested are 23
µL, 50 µL and 100 µL. Results are depicted in Figure 5. The optimum sample loop volume is 50 µL, as it provides the highest net signal (net signal = peak height – baseline signal). Creation of double peaks is due to inadequate mixing resulting in a lower reagent concentration, at the centre of the sample zone, than the required for complete reaction. This is more pronounced when increasing sample volume to 100 µL. Insertion of a 30 cm mixing/reaction coil between the confluence point and the detector results in single peaks at the expense of sensitivity: More than 80% of the reaction is completed before the sample zone reaches the flow cell for measurement.
Flow rate optimization
Flow rate optimization involves injections of 50 µL of a 5.0 × 10⁻⁷ mol L–1 hydrogen peroxide solution using different
flow rates. The parameters that are held constant during this investigation for the optimum flow rate are: Luminol and Co(II) concentrations, 4.0 × 10⁻⁵ mol L–1 and 2.0 ×10⁻⁶ mol
L–1, respectively. Results depicted in Figure 6 show the
optimum to be 1.5 mL min–1 yielding the highest net signal
in combination with a quite low background signal.
Validation
Effect of sample matrix
The effect of the sample matrix was checked through a recovery experiment. This experiment was carried out
Table 1.Effect of Co(II) concentration on the characteristics of the hydrogen peroxide calibration curve
Co (II) concentration / Slope ±SD r Detection limita /
(µmol L–1) counts / (nmol L–1) (nmol L–1)
40.0b 068 ± 4 0.996 30
8.0b 102 ± 9 0.999 20
5.0b 036 ± 2 0.996 20
2.0c 017.8 ± 0.8 0.997 20
a Calculated as three time the standard deviation of the intercept divided by the calibration curve slop. Linear range of calibration curve: b 0.5-20 µmol L–1; c 0.2-20 µmol L–1.
Figure 4. Flow injection peaks acquired through injections of standard
using a pool of EBC samples from ten healthy subjects. The pool was spiked with increasing concentrations of hydrogen peroxide that was subsequently measured through the proposed method. It should be noted that the signal of hydrogen peroxide in the pool of healthy subjects was found to be beyond detection limit with both the proposed and the literature method. Results from the recovery experiment are shown in Table 3, the mean % recovery found to be 70.1 ± 6.2.
Linearity
Linearity of the proposed method was assessed by triplicate injections of hydrogen peroxide standards (n=7) ranging from 100 nmol L–1 to 2000 nmol L–1. The
calibration curve was linear (r= 0.997) over the studied range and the equation of the calibration curve was: Signal = (33.1 ± 1.3) C + (1.9 ± 1.3) × 102 (counts-arbitrary
units/ nmol L–1 H 2O2).
Limit of detection
The LOD was calculated as three times the standard deviation of the background signal as measured during ten injections of the 200 nmol L–1 standard divided by the
slope of the calibration curve. The limit of detection determined was 10 nmol L–1. The limit of quantification
(LOQ) was calculated as ten times the standard deviation of the background signal, divided by the slope and was determined to be 35 nmol L–1.
Precision
The precision of the developed assay was determined through ten consecutive injections of standards with a hydrogen peroxide content of 200 nmol L-1, 700 nmol L-1
and 2000 nmol L-1 and was found to be 5.2, 6.0 and 3.3 %
RSD respectively.
Accuracy
The accuracy of the developed assay was determined by comparison with the fluorometric method described by Ruch et al.,26 as modified by Nowak et al.14 This is the most commonly used method for hydrogen peroxide Table 2.Effect of luminol concentration on the characteristics of the hydrogen peroxide calibration curve
Co(II) concentration / Slope ±SD r Detection limita /
(µmol L–1) counts / (nmol L–1) (nmol L–1)
70.0b 17.8±0.8 0.997 30
40.0c 26±1 0.997 30
10.0b 20±1 0.995 40
7.0b 14±1 0.995 60
a Calculated as three time the standard deviation of the intercept divided by the calibration curve slop. Linear range of calibration curve: b 0.2-20
µmol L–1;
c 0.1-20 µmol L–1.
Figure 5. Effect of sample volume on FI signals. Hydrogen peroxide concentration: 5.0 × 10⁻⁷ mol L–1, pump flow rate: 1.5 mL min–1.
Figure 6. Effect of reagents’ flow rate on chemiluminescence signals acquired.
Table 3.Hydrogen peroxide recovery results from EBC collected from healthy subjects
Spiking level H2O2 concentration/ (µmol L–1) Recovery / %
Added Recovered
1st 0.4 0.3 79.0
2nd 0.8 0.5 64.9
3rd 1.4 0.9 68.4
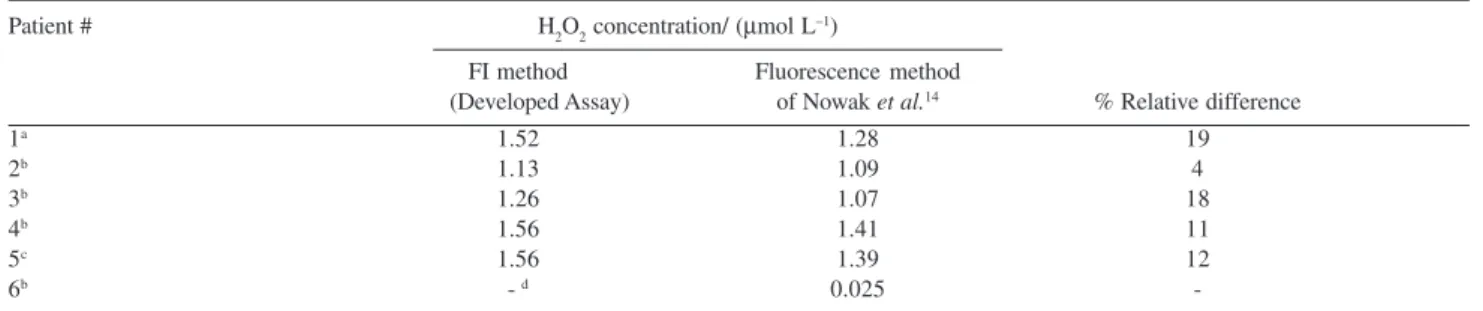
determination in EBC. Results of EBC samples analysis are shown in Table 4 indicating good accordance between the two methods, supported by the small relative differences between the two methods. A paired t-test between the two methods proves that there is no significant difference (P>0.001). Correlation between the two methods was also good, the slop being 0.76±0.16 and correlation coefficient r= 0.94.
Conclusions
The developed portable condensing apparatus gives the capability for bed side testing while the use of Flow Injection in combination with chemiluminescence detection provides a rapid, simple and fully automated method for hydrogen peroxide detection in exhaled breath condensate. In addition, the developed method is in good agreement with the commonly used method providing also a low detection limit of 10 nmol L–1. Taking into account
the above advantages in combination with the analytical figures of merit, linearity, r= 0.997, and precision, better than 6.0% RSD, it is obvious that the developed method will be a powerful tool in the clinicians hands.
The FI method developed, features sampling throughput of 180 samples h–1. Moreover, the developed method is fully
automated, overcoming the manual-off line derivatization required by a recently published automated method,24
providing a platform for on line-real time monitoring of exhaled breath. This warrants further research and development of suitable interface of the FI analyser to the condensing apparatus. It should be noted that FI methodologies are easily amenable to miniaturization through the concept of microconduits.27 This is important
for the development of point of care testing devices.
Acknowledgments
Yaroslava M. Makarovska acknowledges a N.A.T.O. fellowship administered through the Hellenic Republic,
Ministry of Foreign Affaires, B4 Directorate. The valuable help of Konstantina Poulli with the use of the Jobin Yvon fluorolog-3 spectrofluorometer is specially acknowledged.
References
1. Hunt, J.; J. Allergy Clin. Immun. 2002, 110, 28.
2. Kharitonov, S.; Barnes, P.; Biomarkers2002, 7, 1. 3. Rahman, I.; Kelly, F.; Free Radical Res.2003, 37, 1253.
4. Risby, T.; Sehnert, S.; Free Radical Biol. Med.1999, 27, 1182. 5. Montuschi, P.; Clin. Chim. Acta2005, 356, 22.
6. Yu, H.; Xu, L.; Wang, P.; J. Chromatogr., B2005, 826, 69. 7. Göen, T.; Müller-Lux, A.; Dewes, P.; Musiol, A.; Kraus, T.; J.
Chromatogr., B2005, 826, 261.
8. Biernacki, W.; Kharitonov, S.; Biernacka, H.; Barnes, P.; Chest
2005, 128, 1958.
9. Mercken, E.; Hageman, G.; Schols, A.; Akkermans, M.; Bast, A.; Wouters, E.; Am. J. Respir. Crit. Care2005, 172, 994. 10. Horvath, É.; Hunt, J.; Barnes, P.J.; Eur. Respir. J.2005, 26,
523.
11. Loukides, S.; Horvath, I.; Wodehouse, T.; Cole, P.; Barnes, P.;
Am. J. Respir. Crit. Care1998, 158, 991.
12. Heard, S.; Longtine, K.; Toth, I.; Puyana, J.; Potenza, B.; Smyrnios, N.; Anesth. Analg.1999, 89, 353.
13. Jöbsis, R.; Schellekens, S.; Kroesbergen, A.; Raatgeep, R.; Jongste, J.; Mediat. Inflamm.2001, 10, 351.
14. Nowak, D.; Kasielski, M.; Antczak, A.; Pietras, T.; Bialasiewicz, P.; Resp. Med.1999, 93, 389.
15. Antczak, A.; Nowak, D.; Shariati, B.; Król, M.; Piasecka, G.; Kurmanowska, Z.; Eur. Respir. J.1997, 10, 1235.
16. £uczyòska, M.; Szkudlarek, U.; Dziankowska-Bartkowiak, B.; Waszczykowska, E.; Kasielski, M.; Sysa-Jedrzejowska, A.; Nowak, D.; Eur. J. Clin. Invest.2003, 33, 274.
17. Rysz, J.; Kasielski, M.; Apanasiewicz, J.; Krol, M.; Woznicki, A.; Luciak, M.; Nowak, D.; Nephrol. Dial. Transpl.2004, 19,
158.
18. Majewska, E.; Kasielski, M.; Luczynski, R.; Bartosz, G.; Bialasiewicz, P.; Nowak, D.; Resp. Med.2004, 98, 669.
Table 4.Results obtained through patients’ EBC sample analysis
Patient # H2O2 concentration/ (µmol L–1)
FI method Fluorescence method
(Developed Assay) of Nowak et al.14 % Relative difference
1a 1.52 1.28 19
2b 1.13 1.09 4
3b 1.26 1.07 18
4b 1.56 1.41 11
5c 1.56 1.39 12
6b - d 0.025
19. Rota, C.; Chignell, C.; Mason, R.; Free Radical Biol. Med.
1999, 27, 873.
20. Van Beurden, W.; Harff, G.; Dekhuijzen, P.; Van den Bosch, M.; Creemers, J.; Smeenk, F.; Resp. Med.2002, 96, 197.
21. Nowak, D.; Kalucka, S.; Bialasiewicz, P.; Król, M.; Free Radical Biol. Med.2001, 30, 178.
22. Zappacosta, B.; Persichilli, S.; Mormile, F.; Minucci, A.; Russo, A.; Giardina, B.; De Sole, P.; Clin. Chim. Acta2001, 310, 187.
23. Emelyanov, A.; Fedoseev, G.; Abulimity, A.; Rudinski, K.; Fedoulov, A.; Karabanov, A.; Barnes, P.J.; Chest2001, 120, 1136.
24. Svensson, S.; Olin, A.; Lärstad, M.; Ljungkvist, G.; Torén, K.;
J. Chromatogr., B2004, 809, 199.
25. Yamashiro, N.; Uchida, S.; Satoh, Y.; Morishima, Y.; Yokoyama, H.; Satoh, T.; Sugama, J.; Yamada, R.; J. Nucl. Sci. Technol.
2004, 41, 890.
26. Ruch, W.; Cooper, P.H.; Baggiolinii, M.; J. Immunol. Methods
1983, 63, 347.
27. Ruzicka, J.; Flow Injection Analysis, 2nd ed., Wiley: New York, 1988.
Received: December 4, 2006