Printed in Brazil - ©2007 Sociedade Brasileira de Química 0103 - 5053 $6.00+0.00
Article
*e-mail: [email protected]
Application of Inductively Coupled Plasma Quadrupole Mass Spectrometry for the
Determination of Monazite Ages by Lead Isotope Ratios
José Marcus Godoy,*,a,b Maria Luiza D. P. Godoya and Cláudia C. Aronneb a
Instituto de Radioproteção e Dosimetria (IRD), CP 37750, Barra da Tijuca, 22642-970 Rio de Janeiro-RJ, Brazil
b
Departamento de Química, Pontifícia Universidade Católica do Rio de Janeiro, Rua Marquês de São Vicente 225, 22453-900 Rio de Janeiro-RJ, Brazil
A fim de avaliar a aplicabilidade da espectrometria de massa com plasma indutivamente acoplado à determinação de idades Pb/Pb, U/Pb e Th/Pb de monazitas, estudos foram realizados, inicialmente, em padrões isotópicos de referência para chumbo (NIST SRM 981 e 982). Posteriormente, a metodologia otimizada foi aplicada a areias monazíticas de três diferentes locais, Pão de Açúcar (Rio de Janeiro), Buena (Estado do Rio de Janeiro) e Praia Negra (Guarapari, Estado do Espirito Santo); as idades médias obtidas, (581 ± 21)Ma, (552 ± 32)Ma e (535 ± 3)Ma, respectivamente, estão de acordo com os valores da literatura para amostras de zircão e de monazita dos mesmos locais. Idades Th/Pb com mono-grãos foram também determinadas para a amostra de monazita da Praia Negra, nove grãos foram analisados e o valor médio, (530 ± 26)Ma, está no acordo com o valor obtido com alíquotas maiores. Finalmente, o método foi aplicado a uma amostra do torianita do Estado de Amapá e as idades obtidas Th-Pb, U-Pb e Pb-Pb foram de (2,15 ± 0,05)Ga, (2,03 ± 0,01)Ga e (2,044 ± 0,006)Ga, respectivamente, com um valor médio de (2,08 ± 0,07)Ga, coerente com a idade de (2,08 ± 0,02)Ga do complexo de Bacuri, Amapá, relatada na literatura.
In order to evaluate the applicability of inductively coupled plasma quadrupole mass spectrometry to the determination of Pb/Pb, U/Pb and Th/Pb ages of monazite, studies were carried out initially applying lead atom ratio reference standards (NIST SRM 981 and 982). Further, the optimized methodology was applied to monazite sands from three different sites, Sugar Loaf Hill (Rio de Janeiro city), Buena (Rio de Janeiro state) and Black Sands Beach (Guarapari, Espirito Santo state); the obtained mean ages, (581 ± 21)Myears, (552 ± 32)Myears and (535 ± 3)Myears, respectively, are in agreement with the literature values for zircon and monazite samples from the same sites. Single grain Th/Pb ages were also determined for the monazite sample from Black Sands beach, nine grains were analyzed and the mean value, (530 ± 26)Myears, is in agreement with the value obtained with bulk samples. Finally, the method was applied to a thorianite sample from Amapá state and the observed Th-Pb, U-Pb and Pb-Pb ages obtained were (2.15 ± 0.05)Gyears, (2.03 ± 0.01)Gyears anda (2.044 ± 0.006)Gyears respectively, with a mean value of (2.08 ± 0.07)Gyears. This value is coherent with the (2.08 ± 0.02)Gyears age of the Bacuri complex, Amapá, reported in the literature.
Keywords:inductively coupled plasma mass spectrometry (ICP-MS), lead dating, monazite
Introduction
Considering the four stable isotopes of lead, only 204Pb
is non-radiogenic. Since the other three, 206Pb, 207Pb and
208Pb, are end-members of the 232Th (208Pb), 235U (207Pb)
and 238U (206Pb) radioactive decay chains, different
minerals show different isotopic compositions according
to their age and the initial Th and U content of the source
rock.1 Although less resistant than zircon, monazite offers
the advantage of generally higher U and Th content and
often behaves as a closed-system for U and Pb.2
NIST-SRM-J. Braz. Chem. Soc.
9813-5 or BCR-SRM-278 (Mussel Tissue),
NIST-SRM-1577A (Bovine Liver) and BCR-SRM-422 (Cod Muscle).6
However, the precision values obtained for real samples
are in the range of 0.1-0.3%.7-9 Moreover, the relatively
high cost of TIMS instrumentation and the extensive chemical pre-treatment required have imposed limitations on the routine use of TIMS techniques in geochemical exploration applications.5,10,11
Although the quadrupole inductively coupled plasma mass spectrometry (ICP-MS) shows inferior precision in comparison with TIMS, it has some important advantages,
such as (i) simple sample pre-treatment, (ii) high sample
throughput and simple sample introduction and (iii)
widespread availability.12
Quadrupole based ICP-MS instruments have been used in many studies to measure Pb atom ratios. The precisions measured in reference materials are typically 0.1- 0.3% RSD,13-16 whereas for real samples, a precision in the range
of 0.2-0.5% RSD is usually obtained.8,9,17,18 Despite the
fact that quadrupole based instruments may offer a precision 100 times worse than that obtained with TIMS for reference materials, when applied to real samples this difference is reduced to less than one order of magnitude.6-9,19 Several factors may be responsible for this variability, but the most important factors affecting the precision are those regarding the sample variance, including sample and sample preparation uncertainties, sample matrix effects and chemical steps associated with the method other than
with the instrumental technique itself.7-9
In the present work, the application of quadrupole ICP-MS for the determination of lead atom ratios has been evaluated by aiming at its application for dating of monazites, using the 206Pb/238U, 208Pb/232Th, 207Pb/206Pb and U-Th-total Pb methods.
Experimental
Instrumentation
A Perkin-Elmer SCIEX ELAN 6000 ICP-MS equipped with the original cross flow nebulizer was used for the Pb isotopic measurement. A peristaltic pump performed the solution aspiration. The ICP-MS instrumental operating conditions are summarized in Table 1.
Reagents and standard solutions
All reagents used were of analytical-reagent grade or higher purity and de-ionized water was further purified using a Millipore Milli-Q water purification system. Certified lead atom ratio standard materials (SRM 981)
and (SRM 982) were purchased from the National Institute of Standards and Technology (NIST, USA).
Monazite samples
Buena monazite sample
A pure monazite concentrate sample from Buena (São Francisco de Assis county), in the north of the Rio de Janeiro State (Brazil), was obtained from INB (Indústrias Nucleares Brasileiras).
Sugar Loaf Hill and Black Sand beach samples
In both locations (Urca beach, Rio de Janeiro/RJ) and Black Sand Beach (BSB) (Guarapari, ES), the area with the highest radioactivity was localized with a cintilometer and approximately 5 kg sand samples were taken. The monazite fraction was separated as described by Barling et al.20
Sample dissolution and analysis
For each sample, a bulk sample was prepared by crushing, by hand, several monazite grains using an agate mortar. Three 25 mg aliquots of each sample, equivalent to 150 grains, were weighed, transferred to a 10 mL platinum crucible, to
which 500 µL of phosphoric acid was added and then was
heated to red-hot for a few minutes by applying a Meker burner. A clear solution was observed and diluted to 10 mL
with 7.2 mol L-1 nitric acid. One milliliter was removed and
diluted to 50 mL with 2% (v/v) nitric acid. All determinations were standardized against a reagent blank.
Using this solution, lead, uranium and thorium content were determined by ICP-OES and ICP-MS, respectively, using thallium as internal standard. Each aliquot is analyzed three times and the method standard deviation is 1% for lead and uranium and 2% for thorium.
Table 1. Perkin-Elmer SCIEX ELAN 6000 ICP-MS operation conditions
Operation conditions
RF Power / (W) 1050
Plasma gas flow rate / (L min-1) 17 Auxiliary gas flow rate / (L min-1) 1.2 Nebulizer gas flow rate / (L min-1) 0.9 Sample uptake rate / (mL min-1) 1.0
Scan mode Peak hopping
Lens scanning Enabled
Detector mode Dual – Pulse and Analog
Replicates 6
Sweeps / replicate 200
et al.
Prior to the lead isotopic ratio determinations, the mass bias correction factor for 204Pb, 207Pb and 208Pb related to
206Pb were determined using the NIST-SRM-981 (10 µg
L-1). The obtained values were verified using the
NIST-SRM-982 (10 µg L-1) as a sample. These factors were
verified at the end of each sample batch, analyzing the NIST-SRM-981 solution as a sample. One percent relative bias was specified as a limit for recalibration and sample reanalysis and during the present work no reanalysis was necessary.
Age calculation
In order to calculate the 206Pb/238U, 208Pb/232Th and
207Pb/206Pb ages the following methodology was adopted.
Based on the 204Pb/206Pb, 207Pb/206Pb and 208Pb/206Pb atom ratios, the 204Pb, 206Pb, 207Pb and 208Pb atom percent was
calculated. The radiogenic 206Pb, 207Pb and 208Pb atom
percentages were calculated according to equations 1-3, where the (206Pb/204Pb)
nat, (
207Pb/204Pb) nat, (
208Pb/204Pb) nat ratios were obtained based on the NIST-SRM-981 lead isotopic composition.
(206Pb) rad = (
206Pb) exp – (
206Pb/204Pb) nat× (
204Pb) exp = (
206Pb)
exp – 16.9374 ( 204Pb)
exp (1)
(207Pb) rad = (
207Pb) exp – (
207Pb/204Pb) nat× (
204Pb) exp = (
207Pb)
exp – 15.4916 ( 204Pb)
exp(2)
(208Pb) rad = (
208Pb) exp – (
208Pb/204Pb) nat× (
204Pb) exp = (
208Pb)
exp – 36.7219 ( 204Pb)
exp(3)
Based on these results, the 206Pb/238U, 208Pb/232Th and 207Pb/
206Pb ages were calculated according to equations 4-6:
(206Pb) rad =
238U (e-λ238.t – 1) (4)
(208Pb) rad =
232Th (e-λ232.t – 1) (5)
(206Pb) rad/(
207Pb) rad =
238U/235U [(e-λ238.t –1)/(e-λ235.t –1)] = 137.88 [(e-λ238.t –1)/(e-λ235.t –1)](6)
where:
λ238 = 238U decay constant = 1.55125×10⁻¹⁰ year-1 λ235 = 235U decay constant = 9.8485×10⁻¹⁰ year-1 λ232 = 232Th decay constant = 0.49475×10⁻¹⁰ year-1
In equations 1-3 (xxxPb)
rad are expressed as mass
concentration, while in equations 4-6 (206Pb)
rad, ( 207Pb)
rad, (208Pb)
rad, as well as
238U and 232Th, are expressed as number
of moles per sample mass.
Additionally to the 206Pb/238U, 208Pb/232Th and 207Pb/
206Pb ages, it was tested the U-Th-total Pb method,
applying the equation described by Rhede et al.21 and
supposing that all lead is radiogenic.
Pbtotal = 0.8929 Th (e-λ232.t – 1) + U [0.8643 (e-λ238.t – 1) + 0.00639 (e-λ235.t –1)] (7)
Results and Discussion
Atom ratio precision and accuracy
Many factors directly control the signal acquisition process on the ELAN 6000 ICP-MS. Some are auto-matically optimized; others can be manually controlled, among them, the dwell time, the number of sweeps/ replicate and the number of replicates/analysis. These three parameters were selected in this study in order to determine the best operation condition. Initially, the default operation conditions were applied and a high RSD was obtained. Considering the different atom ratios involved, better results were achieved by applying different
dwell times for each isotope, higher for 204Pb, the least
abundant, and lower for 208Pb, the most abundant,
according Platzner et al.14
Based on the ELAN 6000 operation manual,22 the
dwell time for each isotope was calculated in order to
obtain 106 counts/replicate, using 200 sweeps/replicate.
Also based on that, ten replicates/analysis was chosen. As the sample volume required and the time expended for each sample were too high, the same calculation was performed for 500.000 counts and 6 replicates/analysis.
202Hg was also included because of a potential isobaric
interference of 204Hg, a dwell time equal to that of 204Pb
was chosen (Table 1).
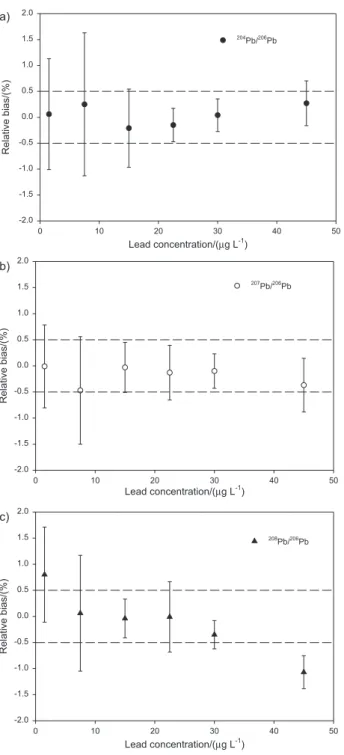
Based on the NIST SRM 981, 1.5, 7.5, 15, 30 and 45 µg
Pb L-1 solutions were prepared. The 204Pb, 206Pb, 207Pb and 208Pb values obtained using the 10 µg Pb L-1 standard solution
were used to calculate the mass fractionation correction factor for 204Pb, 207Pb and 208Pb related to 206Pb. Using these factors, 204Pb/206Pb, 207Pb/206Pb and 208Pb/206Pb atom ratios were
calculated and results are shown in Figure 1. For lead concentrations higher than 20 µg L-1, 208Pb/206Pb ratios lower than the certified value were obtained due to dead time effects
on the 208Pb determination. This concentration can be taken
as an upper limit of lead in the sample solution.
According to Platzner et al.,14 it is possible to reduce the relative standard deviation, in isotope composition determinations using a quadrupole ICP-MS with consecutive measurements. This procedure of multiple determinations was performed employing a solution of
10 µg L-1 of SRM 981 to nine sequential determinations.
The previous procedure was repeated using a 10 µg L-1
SRM 982 solution. The results are listed in Table 2 and show that precision better than 0.25% (95% confidence limits) as well as accuracy in the range of 0.1 to 2% can be achieved. In general, for 204Pb/206Pb, 207Pb/206Pb and 208Pb/206Pb atom ratios, the relative bias increases with the
J. Braz. Chem. Soc.
Bulk samples
The lead, uranium and thorium contents of the three analyzed monazite samples and the observed lead atom ratio are shown in Table 3. For each individual aliquot,
the monazite ages were calculated applying the 206Pb/238U,
208Pb/232Th, 207Pb/206Pb and U-Th-total Pb methods and the
obtained values are shown in Table 4. The agreement between the results of the 206Pb/238U and 208Pb/232Th dating methods shows the proposed procedure reliability. The association of a higher thorium content with a lower
uranium concentration leads to a low 207Pb signal and to a
large standard deviation related to the 207Pb/206Pb age. The calculated U-Th-total Pb ages were in the range of the 206Pb/238U, 208Pb/232Th and 207Pb/206Pb ages showing that,
at least, for monazite samples this relatively simple method can provide results that could be used as a starting point for further studies applying more accurate methods based on multi-collector mass spectrometers.
The obtained Sugar Loaf Hill 238U/206Pb age is coherent with the 560 Myears value published by Silva and
Ramos.23 Moreover, the obtained ages are in agreement
with Brasiliano orogeny.24-26
The overall compositional variations among various monazite types are governed by substitution of REE
by Th and U.27,28 Therefore, since the observed uranium
Lead concentration/(µg L-1)
0 10 20 30 40 50
Relative
bias/(%)
-2.0 -1.5 -1.0 -0.5 0.0 0.5 1.0 1.5 2.0
204
Pb/206
Pb
a)
b)
Lead concentration/(µg L-1)
0 10 20 30 40 50
R
e
lativ
e
bias
/(
%
)
-2.0 -1.5 -1.0 -0.5 0.0 0.5 1.0 1.5 2.0
207
Pb/206
Pb
c)
Lead concentration/(µg L-1)
0 10 20 30 40 50
Relative
bias/(%)
-2.0 -1.5 -1.0 -0.5 0.0 0.5 1.0 1.5 2.0
208
Pb/206
Pb
Figure 1. Influence of the lead concentration on the 204Pb/206Pb (a), 207Pb/
206Pb (b) and 208Pb/206Pb (c) atom ratio accuracy.
Table 2. Results for the analysis of lead atom ratio standard reference materials, errors are based on 95% confidence limits
SRM 981 SRM 982
204Pb/206Pb 207Pb/206Pb 208Pb/206Pb 204Pb/206Pb 207Pb/206Pb 208Pb/206Pb
Reference value 0.059042 0.91464 2.1681 0.027219 0.46707 1.00016
Relative error / (%) 0.063 0.036 0.037 0.10 0.043 0.030
Mean value (n=9) 0.058761 0.91353 2.1886 0.027782 0.46550 0.997151
Relative error of the mean / (%) 0.16 0.12 0.22 0.26 0.08 0.12
Relative bias / (%) –(0.48±0.17) –(0.12±0.13) (0.95±0.23) (2.07±0.28) –(0.34±0.10) –(0.30±0.12)
Figure 2. Light rare-earth elements (La:Sm) content relationship with
the actinide (Th+U) concentration.
(Th+U)/(mg g-1)
45.0 50.0 55.0 60.0 65.0 70.0 75.0
Σ(L
R
EE,
La:Sm
)/
(T
h+
U
)
et al.
and thorium contents were different (Table 3), an additional aliquot of each monazite sample, was taken and uranium, thorium and the rare earth elements (REE) were determined in order to verify if this substitution has occurred. Figure 3 shows that this substitution effectively occurs with an inverse correlation between
Σ(LREE: La-Sm) and (Th+U). The
chondrite-norma-lized REE content is shown in Figure 4. All monazite samples have patterns with negative europium anomaly and with similar light REE (LREE) composition. The
heavy REE are divergent, the largest difference being
found for the heaviest elements. Mohanty et al.,27
analyzing monazite sand grain from the Chhatrapur beach placer deposits, have also observed a uniform LREE enrichment with a prominent Eu anomaly, which has been attributed to the preferential incorporation of the LREE during the melting.
The method was also tested on older samples. A thorianite sample from Amapá was obtained from the Brazilian Nuclear Energy Commission. Three 10 mg
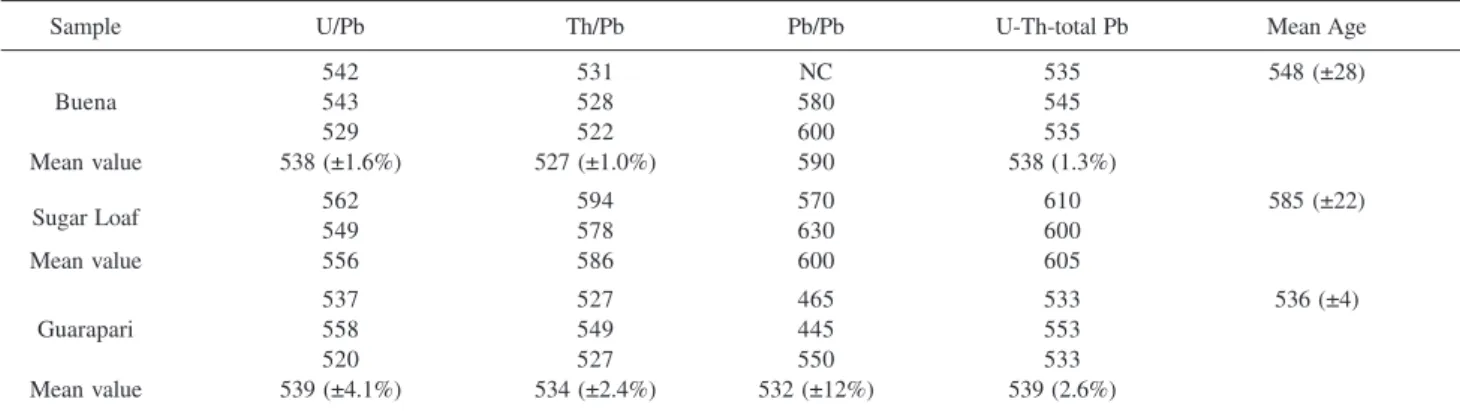
Table 4. Obtained monazite ages, values in Myears (± 95% confidence level)
Sample U/Pb Th/Pb Pb/Pb U-Th-total Pb Mean Age
542 531 NC 535 548 (±28)
Buena 543 528 580 545
529 522 600 535
Mean value 538 (±1.6%) 527 (±1.0%) 590 538 (1.3%)
Sugar Loaf 562549 594578 570630 610600 585 (±22)
Mean value 556 586 600 605
537 527 465 533 536 (±4)
Guarapari 558 549 445 553
520 527 550 533
Mean value 539 (±4.1%) 534 (±2.4%) 532 (±12%) 539 (2.6%)
Table 3. Observed lead, uranium and thorium contents (in g kg-1) and lead atom ratios of the analyzed monazite samples (errors are based on 95%
confidence limits)
Sample Pb U Th 204Pb/206Pb 207Pb/206Pb 208Pb/206Pb
1.24 1.73 46.0 0 0.04814 (2.3%) 8.3803 (0.4%)
Buena 1.24 1.72 45.1 0.00267 (3.6%) 0.09803 (0.5%) 7.9015 (0.2%)
1.20 1.72 44.5 0.00229 (6.6%) 0.09308 (2.1%) 7.9950 (0.2%)
Sugar Loaf 1.581.32 1.981.68 51.243.6 0.00381 (0.8%)0.00460 (6.2%) 0.11426 (0.5%)0.12718 (3.3%) 8.3481 (0.2%)8.2653 (0.7%)
1.57 1.24 61.9 0.00041 (4.2%) 0.06221 (0.8%) 15.6519 (0.2%)
Guarapari 1.47 1.10 55.6 0.00064 (5.8%) 0.06503 (0.5%) 15.7717 (0.2%)
1.51 1.26 59.3 0.00082 (0.2%) 0.07505 (0.7%) 15.1495 (0.2%)
Figure 3. Rare-earth elements concentration, normalized to the
Chon-drites, in the studied monazite samples. Chondrite values are taken from Anders and Grevesse (reference 33).
Element
log
([Sample]/Chondrites])
La Ce Pr Nd Pm Sm Eu Gd Tb Dy Ho Er Tm Yb Lu
2 3 4 5 6
Guarapari P. Vermelha Buena
Figure 4. Black Sand beach monazites: single grain Th/Pb ages obtained in
the present work (open dots) in comparison with those reported by Machado and Gauthier (closed dots refence 2), each errors bar represents two standard deviations. The black and the two red reference lines are the mean value and the 95% uncertainties calculated based on the open dot values.
Sample
0 10 20 30 40 50
Age/(M
years)
J. Braz. Chem. Soc.
aliquots were taken, and after total dissolution with
HNO3-HF-HClO4, they were analyzed in the same way
as the monazite samples. The obtained mean (95% confidence level) 206Pb/238U, 208Pb/232Th and 207Pb/206Pb ages were (2.15 ± 0.05)Gyears, (2.03 ± 0.01)Gyears, (2.044 ± 0.006)Gyears respectively, with a mean value of (2.08 ± 0.07)Gyears. This value is coherent with the (2.08 ± 0.02)Gyears age of the Bacuri complex, Amapá,
reported by Pimentel et al.29
Single grain analysis
Based on the lead content and on the weight of single
monazite grain, around 150-200 µg, it should be possible
to date single monazite grains using the 208Pb/232Th ratio. In order to test it, nine well formed round monazite grains from Black Sand beach, Guarapari/ES, with masses
ranging from 170 to 230 µg, were taken and dissolved in
100 µL H3PO4 as already described. Based on the lead
content observed in the BSB monazite (Table 3), the obtained melt was dissolved and diluted with 2% v/v
HNO3 in order to obtain a total lead concentration of ca.
10 µg L-1. The lead and thorium concentrations on each
solution was determined and, based on the obtained results, the lead and thorium content of each grain was calculated. Afterward, the same solution was used for the lead atom ratio determination. Using the lead and thorium content
and 208Pb atom ratio, 208Pb/232Th ages were calculated
(Table 5) and values between 473 and 605 Myears were observed. Similar results were obtained by Machado and
Gauthier2 working with BSB monazites. Figure 4 presents
a comparison of the results obtained in the present work
and those related by Machado and Gauthier,2 applying a
LA-ICP-QMS. The main source of uncertainty from using the present methodology was the determination of the lead and thorium contents, typically between 0.5 and 1.0%, for both elements. Therefore, the expanded uncertainty for a single grain monazite Th/Pb age is lower than 2%,
which is much lower than the 207Pb/206Pb age uncertainty
obtained by an equivalent LA-ICP-QMS. The observed mean value working with single grains, (530 ± 26)Myears, and with bulk samples, (535 ± 3)Myears, are statistically indistinguishable.
The work of Machado and Gauthier2 was chosen
since it deals with monazite grains taken from the same places as discussed in the present work. However, it is
interesting to compare the 206Pb/207Pb age uncertainty
achieved by them with those obtained in more recent
works also applying LA-ICP-QMS.29-31 It is possible to
observe that great improvement was achieved since the
Machado and Gauthier work;2 notwithstanding,
relatively high uncertainties have still been obtained
with mean values ranging from 5.3% to 20.0%.29, 31 The
same authors reported also 208Pb/232Th ages with a mean
uncertainty of 2.9% and 10.3%, respectively. On the other hand, in general, 1.5%-2% uncertainties were
obtained for 206Pb/238U ages despite laser-induced
elemental fractionation.30-32
Conclusions
The present study has shown that it is possible to obtain useful monazite dates regarding precision and accuracy applying quadrupole ICP-MS. Moreover, the use of monazite allows the direct determination of lead atom ratios without the need of a chemical separation, even for single grain samples. U-Th-total Pb ages were in the range of the 206Pb/238U, 208Pb/232Th and 207Pb/206Pb ages showing that, at least, for monazite samples this relatively simple method can provide results that could be used as a starting point for further studies applying more accurate methods based on multi-collector mass spectrometers.
Acknowledgments
The present work was supported by FINEP (Financiadora de Estudos e Projetos) and CAPES (Coordenação de Aperfeiçoamento de Pessoal de Nível Superior). The authors wish to express their gratitude to Claudio Valeriano (UERJ) and Marcio Pimentel (UnB) for their help during different phases of the present work.
References
1. Jager, E.; Hunziker, J.; Lectures in Isotope Geology, Springer Verlag: New York, 1979.
Table 5. Lead and thorium contents and 208Pb atomic percentage observed
in Black sand beach, Guarapari, monazite grains, and calculated Th/Pb ages (±95% confidence level)
Sample Pb / Th / 208Pb / Th / Pb age
(mg g-1) (mg g-1) atom % Myears
1 2.038 50.65 97.1426 483 ± 17
2 2.58 58.32 95.7408 583 ± 11
3 2.042 53.08 75.9825 605 ± 10
4 3.495 88.49 97.4197 473 ± 5
5 2.847 65.84 97.4512 517 ± 9
6 2.95 64.03 94.2273 569 ± 13
7 2.788 64.11 98.5611 514 ± 12
8 3.069 70.78 92.5643 546 ± 18
et al.
2. Machado, N.; Gauthier, G.; Geochim. Cosmochim. Acta1996,
60, 5063.
3. Hoven, H.M.; Gaudette, H.E.; Short, F.T.; Mar. Environ. Res. 1999, 48, 377.
4. Thirwall, M.F.; Chem. Geol.2000, 163, 299.
5. Weiss D.J.; Kober, B., Dolgopolova, A.; Gallagher, K.; Spiro, B.; Le Roux, G.; Mason, T.F.D.; Kylander, M.; Coles, B.J.; Int. J. Mass Spectrom.2004, 232, 205.
6. Encinar, J.R.; Garcia-Alonso, J.I.; Sanz-Medel, A.; Main, S.; Turner, P.J.; J. Anal. At. Spectrom.2001, 16, 322.
7. Pomies, C.; Cocheire, A.; Guerrot, C.; Marcoux, E.; Lancelot, J.; Chem. Geol. 1998, 144, 137.
8. Halicz, L.; Erel, Y.; Veron, A.; At. Spectrosc. 1996, 17, 186. 9. Weiss, D.; Boyle, E.A.; Chavagnac, V.; Herwegh, M.; Wu, J.;
Spectrochim. Acta, Part B2000, 55, 363.
10. Townsend, A.T.; Yu, Z.; Mcgoldrick, P.; Hutton, J.A.; J. Anal.
At. Spectrom. 1998, 13, 809.
11. Wannemacker, G.; Vanhaecke, F.; Moens, L.; Mele, A.; Thoen, H.; J. Anal. At. Spectrom. 2000, 15, 323.
12. Prohaska, T.; Watkins, M.; Latkoczy, C.; Wenzel, W.W.; Stingeder, G.; J. Anal. At. Spectrom. 2000, 15, 365.
13. Heumann, K.G.; Gallus, S.M.; Radlinger, G.; Vogl, J.; J. Anal.
At. Spectrom. 1998, 13, 1001.
14. Platzner, I.T.; Becker, J.S.; Dietze, H-J.; At. Spectrosc. 1999,
20, 6.
15. Becker, J.S.; Dietze, H-J.; Fresenius J. Anal. Chem. 2000, 368, 23.
16. Begley, I.S.; Sharp, B.L.; J. Anal. At. Spectrom. 1997, 12, 395. 17. Barbaste, M.; Halicz, L.; Galy, A.; Medina, B.; Emterborg, H.;
Adams, F. C.; Lobinski, R.; Talanta2001, 54, 307.
18. May, T.W.; Wiedmeyer, R.H.; Brown, L.D.; Casteel, S.W.; At. Spectrosc. 1999, 20, 199.
19. Kylander, M.E.; Weiss, D.J.; Jeffries, T.; Coles, B.J.; J. Anal. At. Spectrom. 2004, 19, 1275.
20. Barling, J.; Weis, D.; Demaiffe, D.; Chem. Geol. 2000, 165, 47.
21. Rhede, D.; Wendt, I.; Förster, H-J; Chem. Geol. 1996, 130, 247.
22. PERKIN-ELMER, Inductively Coupled Plasma Mass Spectrometer ELAN 6000, software guide; PERKIN-ELMER SCIEX Instruments: Canada, 1997.
23. Silva, L.C.; Ramos, A.J.L.A. In Sítios Geológicos e
Paleontológicos do Brasil; Schobbenhaus, C.; Campos, D.A.; Queiroz, E.T.; Winge, M.; Berbert-Born, M.L.C., eds.; DNPM/ CPRM, Comissão Brasileira de Sítios Geológicos e Paleobiológicos (SIGEP): Brasília, 2002, pp. 263-268, available at http://www.unb.br/ig/sigep/sitio067/sitio067.pdf. 24. Babinski, M.; van Schmus, W.R.; Chemale, F.; Chem. Geol.
1999, 160, 175.
25. Söllner, J.; Trouw, R.A.J.; J. S. Am. Earth Sci. 1997, 10, 21. 26. Leite, J.A.D.; Hartmann, L.A.; Fernandes, L.A.D.;
McNaughton, N.J.; Soliani Jr., E.; Koester, E.; Santos, J.O.S.; Vasconcellos, M.A.Z.; J. S. Am. Earth Sci. 2000, 13, 739. 27. Mohanty, A.K.; Das, S.K.; Vijayan, V.; Sengupta, D.; Saha,
S.K.; Nucl. Instrum. Methods Phys. Res., Sect. B2003, 211, 145.
28. van Emden, B.; Thornber, M.R.; Grahan, J.; Lincoln, F.J.; Can. Mineral. 1997, 35, 95.
29. Pimentel, M.M.; Spier, C.A.; Ferreira Filho, C.F.; Rev. Brasil. Geoc. 2002, 32, 1.
30. Horn, I.; Rudnick, R.L.; McDonough, W.F.; Chem. Geol. 2000,
164, 281.
31. Jeffries, T.E.; Fernandez-Suarez, J.; Corfu, F.; Alonso, G.G.; J. Anal. At. Spectrom.2003, 18, 847.
32. Jackson, S.E.; Pearson, N.J.; Griffin, W.L.; Belousova, E.A.;
Chem. Geol. 2004, 211, 47.
33. Anders, E.; Grevesse, N.; Geochim. Cosmochim. Acta1989,
53, 197.