Spatial Change of Cruciate Ligaments in Rat
Embryo Knee Joint by Three-Dimensional
Reconstruction
Xiangkai Zhang1, Tomoki Aoyama1*, Ryota Takaishi1, Shinya Higuchi1, Shigehito Yamada1,2, Hiroshi Kuroki1, Tetsuya Takakuwa1
1Human Health Science, Graduate School of Medicine, Kyoto University, Kyoto, Japan,2Congenital Anomaly Research Center, Graduate School of Medicine, Kyoto University, Kyoto, Japan
Abstract
This study aimed to analyze the spatial developmental changes of rat cruciate ligaments by three-dimensional (3D) reconstruction using episcopic fluorescence image capture (EFIC). Cruciate ligaments of Wister rat embryos between embryonic day (E) 16 and E20 were analyzed. Samples were sectioned and visualized using EFIC. 3D reconstructions were generated using Amira software. The length of the cruciate ligaments, distances between attachment points to femur and tibia, angles of the cruciate ligaments and the cross angle of the cruciate ligaments were measured. The shape of cruciate ligaments was clearly visible at E17. The lengths of the anterior cruciate ligament (ACL) and posterior cruciate ligament (PCL) increased gradually from E17 to E19 and drastically at E20. Distances between attachment points to the femur and tibia gradually increased. The ACL angle and PCL angle gradually decreased. The cross angle of the cruciate ligaments changed in three planes. The primordium of the 3D structure of rat cruciate ligaments was constructed from the early stage, with the completion of the development of the structures occurring just before birth.
Introduction
The cruciate ligaments of the knee joint are a pair of ligaments arranged in the shape of an X. [1] The cruciate ligaments consist of the anterior cruciate ligament (ACL) and the posterior cruciate ligament (PCL). The ACL lies anterolaterally, connecting the anterior part of the upper surface of the tibia to the inner aspect of the lateral condyle of the femur.[2] The PCL lies posteromedially and attaches the back of the upper surface of the tibia to the inner aspect of the medial condyle of the femur.[3] They are important for stabilizing the articulating bones (femur and tibia), especially during movement.[4] The ACL resists anterior instability and internal rotation of the tibia.[5] The PCL resists posterior instability.[3] Injury of the cruciate ligaments can lead to knee instability, meniscal damage, and osteoarthritis (OA). Because of the importance of cruciate ligament function, the ACL transection and reconstruction rat model has been widely used. Knowledge of the three dimensional (3D) anatomic structure and
OPEN ACCESS
Citation:Zhang X, Aoyama T, Takaishi R, Higuchi S, Yamada S, Kuroki H, et al. (2015) Spatial Change of Cruciate Ligaments in Rat Embryo Knee Joint by Three-Dimensional Reconstruction. PLoS ONE 10(6): e0131092. doi:10.1371/journal.pone.0131092
Editor:Luc Malaval, Université de Lyon—Université
Jean Monnet, FRANCE
Received:March 5, 2015
Accepted:May 28, 2015
Published:June 22, 2015
Copyright:© 2015 Zhang et al. This is an open access article distributed under the terms of the
Creative Commons Attribution License, which permits unrestricted use, distribution, and reproduction in any medium, provided the original author and source are credited.
Data Availability Statement:All relevant data are within the paper and its Supporting Information files.
Funding:This work was supported by Grants-in-Aid for Scientific Research from the Japan Society for the Promotion of Science (#26282154 & #25461642), url:
https://www.jsps.go.jp/english/.
biomechanics of the cruciate ligaments is important for understanding the biology and the clinical significance of the cruciate ligaments.
The development of the cruciate ligaments is indispensable to the formation of the knee joint. In the human embryo, the chondrification of the femur and tibia begins at Carnegie stage (CS) 18. At CS 21, the PCL is distinguishable. At CS 23, the ACL and PCL are clearly visible and joint cavity formation is recognized.[6] Although the development of the cruciate liga-ments has been investigated histologically, there are few reports about the anatomical develop-ment of the cruciate ligadevelop-ments in 3D. In our previous study reported by Takaishi,[7] we showed the 3D structural development of the rat knee joint using episcopic fluorescence image capture (EFIC). EFIC creates data on volumes and coordinates by imaging with tissue auto-fluorescence. After capturing the image, the continuous sections were used to create 3D com-puter models.[8] Using this technique,[9] it is possible to precisely analyze the spatial variation of the embryo during development. In Takaishi’s report, we analyzed the development of the joint cavity. We succeeded in describing the spatial changes involved in cavity formation. In the current study, the development of the cruciate ligaments of the rat knee joint was investi-gated in 3D using EFIC.
Materials and Methods
Animals
Eighteen right hindlimbs were removed from 18 white Wister rat embryos between E16 and E20 (E16, n = 2; E17, 18, 19, 20, n = 4 each). Wister rats were sourced from SHIMIZU Laboratory Supplies Co., Ltd (Kyoto, Japan).The mother rats were euthanized by pentobarbital sodium over-dose before caesarean section. The rat embryos were fixed whole immediately after removal from the uterus in 4% paraformaldehyde at 4°C overnight before dissecting the hindlimbs.
Preparation and workflow for EFIC
Preparation of samples for EFIC was performed as described in our previous study.[7] Briefly, for EFIC, the dehydrated samples were infiltrated and embedded in 70.4% paraffin wax containing 24.9% Vyber, 4.4% stearic acid, and 0.4% sudan IV.[10] The paraffin blocks were sectioned using a Leica SM2500 sliding microtome (Leica Microsystems, Bannockburn, UK) at 6–10μm.
Auto-fluorescence at the paraffin block face was visualized using epiAuto-fluorescence imaging with mercury illumination and a discosoma Redfilter. Fluorescent images were captured using a Hamamatsu ORCA-ER low-light CCD camera (HAMATSU Photonics K.K., Shizuoka, Japan). After captur-ing an image of the block face, a small slice of the block was removed uscaptur-ing the microtome blade. This slice permitted preservation of histologic sections for H&E staining. Then, a digital image of the freshly cut block surface was captured and the next slice of embedding block was removed. This procedure was repeated until the region of interest was sectioned and a stack of aligned digi-tal images showing subsequent block faces with tissues of the specimens was produced.
3D reconstruction and coordinate location
All coordinates of the 3D reconstruction model were generated automatically after 3D reconstruction was completed. The coordinates of the attachment points of the cruciate liga-ment were outlined manually and generated automatically using the barycentric coordinates of the contact area of bone and ligament. The coordinates of the cross point of the cruciate liga-ments were outlined manually and generated automatically using the barycentric coordinates of the cruciate ligament intersection area.
Analysis
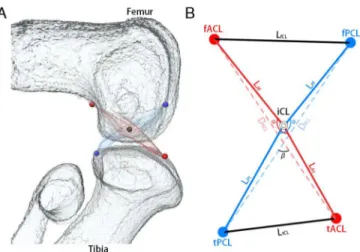
The cross point of the cruciate ligaments was designated as“Intersection of Cruciate Liga-ments”(iCL). The attachment points of the cruciate ligaments to the femur and tibia were des-ignated as“femoral attachment of ACL”(fACL),“femoral attachment of PCL”(fPCL),“tibial attachment of ACL”(tACL), and“tibial attachment of PCL”(tPCL) (Fig 1). These five coordi-nates were used to calculate lengths and angles.
The length of the ACL was calculated as the sum of the length of the ACL on the femoral side (LAf) and the length of the ACL on the tibial side (LAt). The length of the PCL was
calcu-lated as the sum of the length of the PCL on the femoral side (LPf) and the length of the PCL on
the tibial side (LPt). The distance between fACL and fPCL was defined as LfCL. The distance
between tPCL and tACL was defined as LtCL. The ACL angle (αACL) was measured at the
angle between fACL, iCL and tACL. The PCL angle (αPCL) was measured at the angle between fPCL, iCL and tPCL. The distance between the fACL and tACL was defined as DACL. The
dis-tance between the fPCL and tPCL was defined as DPCL. The cross angle (β) of the cruciate
liga-ments was measured at the angle between DACLand DPCLin the sagittal, frontal, and
horizontal planes [β(sagittal)/β(frontal)/β(horizontal)] (Fig 1B).
To learn more about the spatial change of cruciate ligament three dimensionally, the mean coordinates of attachment of the cruciate ligament at each stage were integrated into the same coordinate system. A standard position, which was required, was obtained as follows using
Fig 1. Imaging of measurement points.A: A 3D reconstruction of the knee joint was generated from 2D continuous sections with Amira software. Femur and tibia (white), ACL (red) and PCL (blue). Red points indicate the attachment of the ACL to the femur and tibia. Blue points indicate the attachment of the PCL to the femur and tibia. The black point indicates the cross point of both ligaments. B: Measurement points. fACL: femoral attachment of ACL. fPCL: femoral attachment of PCL. tACL: tibial attachment of ACL. tPCL: tibial attachment of PCL. The cross point of ACL and PCL was indicated as intersection of cruciate ligament (iCL). Length of ACL (LACL) was calculated by length of ACL on femoral side (LAf) plus length of ACL on tibial side
(LAt). Length of PCL (LPCL) was calculated by length of PCL on femoral side (LPf) plus length of PCL on tibial
side (LPt).
Matlab 2014a software (MathWorks, Natick, MA). (1) iCL was the original point. (2) the femo-ral condylar axis was pafemo-rallel to the X axis. (3) fACL and fPCL were above the X axis, while tACL and tPCL were below the X axis.
Statistical analysis
All data are shown as actual values. SPSS software (IBM, Armonk, NK) was used for statistical analysis. To examine differences between stages, one-way analysis of variance (ANOVA) fol-lowed by the Tukey-Kramer or Dunnett T3 test was used.
Ethics
All of the experiments with animals were approved by the Institutional Animal Research Com-mittee and performed according to the Guidelines for Animal Experiments of Kyoto University (Permit Number: 14038). Care of the animals was in accordance with the Kyoto University guidelines.
Results
Hematoxylin Eosin (HE) staining of cruciate ligaments
The knee joint was observed using histological sections with HE staining between E16 and E20 (Fig 2). A low-density area corresponding to chondrification was seen between the femur, tibia, and fibula in histological section at E16 (Fig 2A). A three-layered structure corresponding to the interzone was seen as an area of higher cell density between the femur and tibia. The bor-ders between the interzone and the bone primordia were not distinct. The ACL, PCL and cavity could not be observed at E16. The ACL and PCL were detected as a condensed group of spindle cells between the femur and tibia at E17 (Fig 2B). Loose mesenchymal cells with small capillar-ies containing erythrocytes and small cavitcapillar-ies with thin epithelial cell walls were present around the ligaments. The bone primordia become distinct as the border is lined with the single layered
Fig 2. Histological findings of cruciate ligaments.Histological images of sagittal sections of the knee joint by HE staining. a: Embryonic day (E) 16. The cross section of the knee showed no signs of the ACL and PCL in the interzone. b: E17. The cross section of knee clearly showed the ACL and PCL. c: E18. The cross section showed the PCL. d: E19. The cross section showed the ACL and PCL. e: E20. The border and bundle of the ACL were clearly visible. f: E20. The cross sections of the knee showed buckling of the ACL and PCL. Magnification x100. Bar = 100μm.
cells. The direction of fiber growth could be distinguished at E18 (Fig 2C), and a clear differ-ence in direction was observed at E19 (Fig 2D). The borders of the ligaments become sharp as the synovial cavity becomes large and close to the ligaments at E20 (Fig 2E and 2F). The liga-ments seemed not to run straight and to be irregular in diameter in 2D sections, because of the buckling of the cruciate ligaments. The attachments of the ligaments were broad in width.
Length of cruciate ligaments
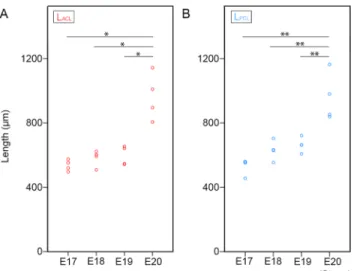
The lengths of the cruciate ligaments were measured as LACLand LPCL(Fig 1) at each stage.
Because the borders of the cruciate ligaments became clear at E17, the lengths of them were measured from E17 (Fig 2B). The mean LACLgradually increased, but not significantly, from
E17 to E19 (E17: 535.3 ± 39.3μm, E18: 566.0 ± 57.3μm, E19: 598.1 ± 55.3μm), however
drasti-cally increased with a significant difference at E20 (913.6 ± 299.9μm) (Fig 3A).
The mean LPCLgradually increased from E17 to E19 (E17: 506.1 ± 52.0μm, E18:
627.3 ± 75.0μm, E19: 663.4 ± 57.0μm), and drastically increased with a significant difference
at E20 (999.8 ± 162.1μm) (Fig 3B).
Distance between attachments of cruciate ligaments
The distances between the attachments of the cruciate ligaments at the femur and tibia were measured as LfCLand LtCLrespectively (Fig 1) at each stage. The mean LfCLgradually increased,
but not significantly, from E17 to E20 (E17: 420.7 ± 34.8μm, E18: 432.1 ± 40.1μm, E19:
444.6 ± 35.2μm, E20: 612.3 ± 205.9μm) (Fig 4A).
The mean LtCLgradually increased, but not significantly, from E17 to E20 (E17:
408.2 ± 46.5μm, E18: 473.2 ± 53.3μm, E19: 490.2 ± 68.0μm, E20: 691.7 ± 132.8μm) (Fig 4B).
Angle of cruciate ligaments
The cruciate ligaments are not completely straight, but slightly curved.[11] The curves of the ligaments were measured as ACL angle (αACL) and PCL angle (αPCL) (Fig 5). The mean
Fig 3. Length of cruciate ligaments.A: The length of the ACL at E17, E18, E19, and E20. The small red circles indicate the length of the ACL in each sample.*p<0.05 (Dunnett T3 test). B: The length of the PCL at E17, E18, E19, and E20. The small blue circles indicate the length of the PCL in each sample.**p<0.01
(Tukey-Kramer test).
αACL slowly decreased from E17 to E19 (E17: 174.1 ± 0.6°, E18: 164.0 ± 7.8°, E19: 162.6 ± 7.7°) and significantly decreased at E20 (156.7 ± 5.4°) (Fig 5A).
The meanαPCL slowly decreased from E17 to E19 (E17: 174.1 ± 2.0°, E18: 165.8 ± 5.3°, E19: 162.7 ± 5.2°) and significantly decreased at E20 (159.9 ± 7.0°) (Fig 5B).
Cross angle between cruciate ligaments
The cruciate ligaments cross each other in three dimensions. The cross angle of the cruciate lig-aments was measured in the sagittal, coronal, and horizontal planes [β(sagittal)/β(frontal)/β
(horizontal)]. The meanβ(sagittal) significantly increased at E19 (E17: 78.2 ± 0.6°, E18:
Fig 4. The distance between the attachment points of the cruciate ligaments on the femur and tibia.A: The length of the distance between the attachment points of the ACL and PCL on the femur (LfCL). The small
black circles indicate the distance in each sample.p<0.05 (Test of Homogeneity of Variances). B: The
length of the distance between the attachment points of the ACL and PCL on the tibia (LtCL). The small black
circles indicate the distance in each sample.p<0.05 (Test of Homogeneity of Variances).
doi:10.1371/journal.pone.0131092.g004
Fig 5. Angle of cruciate ligaments.A: The angle of ACL (αACL) at E17, E18, E19, and E20. The small red circles indicate the angle of ACL in each sample.**p<0.01 (Tukey-Kramer test). B: The angle of PCL (αPCL) at E17, E18, E19, and E20. The small blue circles indicate the angle of PCL in each sample.**
p<0.01(Tukey-Kramer test).
78.5 ± 1.4°, E19: 83.4 ± 0.6°) and further increased at E20 (E20: 90.3 ± 1.5°) (Fig 6A). The mean
β(frontal) significantly increased at E18 (E17: 15.4 ± 0.9°, E18: 21.0 ± 0.8°), then increased at E20 (E19: 21.3 ± 1.1°, E20: 25.5 ± 1.3°) (Fig 6B). The meanβ(horizontal) decreased at E18 (E17: 19.5 ± 1.1°, E18: 9.8 ± 1.1°) and did not change obviously subsequently (E19: 3.5 ± 1.3°, E20: 5.1 ± 1.7°) (Fig 6C).
Spatial change of attachment points of cruciate ligaments
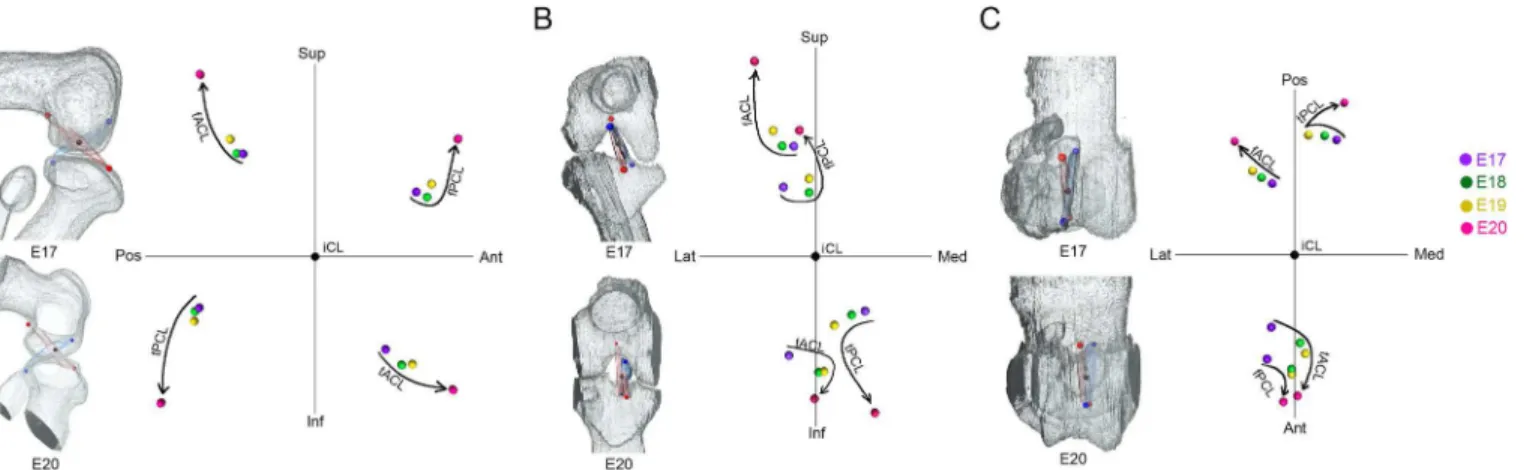
To understand the spatial changes of the cruciate ligaments, the mean coordinates of the four attachment points of the cruciate ligaments (fACL, fPCL, tACL, tPCL) were plotted at each stage in sagittal (Fig 7A), coronal (Fig 7B) and horizontal planes (Fig 7C).
In the sagittal plane, the four attachment points became separated in four directions (Fig 7A). The separation was gradual from E17 to E19, and drastic at E20 (Fig 7A).
In the frontal plane, the attachment points to the femur (fACL, fPCL) and tibia (tACL, tPCL) became separated in opposite directions in both cruciate ligaments (Fig 7B). The separa-tion was gradual from E17 to E19, and drastic at E20 (Fig 7B). Femoral attachments (fACL, fPCL) displaced laterally and tibial attachments (tACL, tPCL) medially (Fig 7B).
In the horizontal plane, the posterior attachments (fACL, tPCL) spread out in a fan-like form, but the anterior attachments (fPCL, tACL) converged (Fig 7C). In this plane, the changes in position were more gradual.
Discussion
In this study, the spatial changes of rat cruciate ligaments during development were analyzed using EFIC and 3D reconstruction. The cruciate ligaments were clearly observed at E17. The length of both ligaments increased, changing gradually from E17 to E19 and drastically at E20. The distance between the attachments of the ACL and PCL increased, changing gradually from E17 to E19 and drastically at E20. The meanαACL andαPCL gradually decreased. The change
Fig 6. Cross angle of cruciate ligaments in each dimension.A: Cross angle of cruciate ligaments in the sagittal plane [β(sagittal)]. Each small circle indicates the cross angle in each sample (purple; E17, green; E18, yellow; E19, red; E20).**p<0.01 (Tukey-Kramer test). B: Cross angle of cruciate ligaments in the coronal plane [β(frontal)]. Each small circle indicates the cross angle in each sample (purple; E17, green; E18, yellow; E19, red; E20).**
p<0.01 (Tukey-Kramer test). C: Cross angle of cruciate ligaments in the horizontal plane [β(horizontal)]. Each small circle indicates the cross angle in each
sample (purple; E17, green; E18, yellow; E19, red; E20).**p<0.01 (Tukey-Kramer test).
inβ(sagittal) was significant at E20. The change inβ(frontal) was gradual and the change inβ
(horizontal) was significant between E17 and E18.
These results suggest that in the development of the cruciate ligaments, distance changes are parallel, but angle changes are not typical. The elongation of the ligaments is in parallel with femoral and tibial bone development. The angle change is more complicated. The ACL lies in a front and lateral position, and PCL lies in a back and medial position. The three dimensional crossing structure of the cruciate ligaments is not just a simple cross, but also contains an ele-ment of torsion. The change of the cross angle is not parallel between the three planes (Fig 6). Current results may suggest that the torsional structure is constructed in a systematic manner.
The angle of the cruciate ligaments in humans is of great clinical significance. Both liga-ments are not completely straight, but the buckling of the PCL is increased when the ACL is ruptured.[12,13] The mean PCL angle is 123° in the normal human adult, but this decreases to 106° in the ACL-deficient knee.[14] The PCL angle itself changes with growth. The mean PCL angle in the child knee increases by a mean of 0.68° with each additional year of age.[11] The mean value of the PCL angle in open physes is 113.9° becoming 121.9° in closed physes.[11] These results suggest that the physiological buckling of the PCL changes according to growth. In the current study, the buckling of the cruciate ligaments was not significant in their forma-tion stage (Fig 2B and 2CandFig 5). The buckling of cruciate ligaments was gradually gener-ated in later stages (Fig 2E and 2FandFig 5). There is no information on the clinical
significance of the evaluation of the buckling of the cruciate ligaments in rats, but this informa-tion on the active mechanism that forms the structure may contribute to the understanding of the physiology of the cruciate ligaments.
There seems to remain one question about the difference in timing of when the cruciate lig-aments develop between human and rodents. The manner of the development of the knee joint itself is similar between the species.[15] The histological findings of the mesenchymal conden-sation, chondrification, the homogenous interzone, the separation of the femur, tibia and patella, ossification of the bones, and the cavitation of the joint are observed similarly in humans[16] and rats (Fig 2). The primordium of the cruciate ligaments are observed as cellular condensation at CS 19 in human [16,17] and E17 in rats (Fig 2B). The joint formation is com-pleted when the joint cavity is formed at CS 23 in humans[16] and E20 in rats.[7] Although the completion of cruciate ligaments’formation is just before birth in rats, the development of the
Fig 7. Spatial changes of the attachment points of the cruciate ligaments in each dimension.The average coordinates of the attachment points at each stage (purple; E17, green; E18, yellow; E19, red; E20) in the sagittal (A), frontal (B), and horizontal (C) planes. Femoral attachment of ACL (fACL). Femoral attachment of PCL (fPCL). Tibial attachment of ACL (tACL). Tibial attachment of PCL (tPCL). Superior (Sup), interior (Inf), anterior (Ant), posterior (Pos), medial (Med), lateral (Lat).
human embryo continues after the ligaments’formation. In human knee development, the lower limbs became internally rotated from CS 19 to CS 23.[18] In rats, there is little informa-tion about the limb posiinforma-tion in the fetal stage. A detailed analysis using 3 dimensional tech-niques in both species is needed to clear this issue, but the results from the current study will contribute to a better understanding of embryological features and functions of the cruciate ligaments.
Conclusions
3D models of the structure of the cruciate ligaments at different stages in their development were successfully formed. The 3D crossing structure of the cruciate ligaments and buckling of the PCL were actively formed. The formation of ligaments was completed at the end of embry-onic period. These findings will contribute to further understanding of cruciate ligaments function.
Supporting Information
S1 Video. 3D structure of knee and cruciate ligament of E17 rat.
(MPG)
Acknowledgments
The authors thank Rune Fujioka, Akira Ito, Junichi Tajino, Momoko Nagai, Shoki Yamaguchi, and Hirotaka Iijima for their skilled technical assistance and advice.
Author Contributions
Conceived and designed the experiments: XZ TA TT. Performed the experiments: XZ RT SH. Analyzed the data: XZ RT SH. Contributed reagents/materials/analysis tools: TA TT. Wrote the paper: XZ TA RT SH SY HK TT.
References
1. Cunningham DJ, Robinson A. Cunningham's Text-book of Anatomy, 5th ed. Wood W. ed. Oxford: Oxford University Press; 1918.
2. Duthon V, Barea C, Abrassart S, Fasel J, Fritschy D, Ménétrey J. Anatomy of the anterior cruciate liga-ment. Knee Surg Sports Traumatol Arthrosc. 2006; 14: 204–213. PMID:16235056
3. Amis A, Gupte C, Bull A, Edwards A. Anatomy of the posterior cruciate ligament and the meniscofe-moral ligaments. Knee Surg Sports Traumatol Arthrosc. 2006; 14: 257–263. PMID:16228178
4. Fu FH, Harner CD, Johnson DL, Miller MD, Woo SLY. Biomechanics of Knee Ligaments—Basic Con-cepts and Clinical-Application. Journal of Bone and Joint Surgery-American Volume. 1993; 75A: 1716– 1727.
5. Matsumoto H, Suda Y, Otani T, Niki Y, Seedhom BB, Fujikawa K. Roles of the anterior cruciate liga-ment and the medial collateral ligaliga-ment in preventing valgus instability. J Orthop Sci. 2001; 6: 28–32. PMID:11289582
6. MéridaVelasco JA, SánchezMontesinos I, EspínFerra J, MéridaVelasco JR, RodríguezVazquez JF, JiménezCollado J. Development of the human knee joint ligaments. Anat Rec. 1997; 248: 259–268. PMID:9185992
7. Takaishi R, Aoyama T, Zhang X, Higuchi S, Yamada S, Takakuwa T. Three-dimensional reconstruction of rat knee joint using episcopic fluorescence image capture. Osteoarthritis Cartilage. 2014; 22: 1401– 1409. doi:10.1016/j.joca.2014.06.016PMID:25278051
8. Weninger WJ, Geyer SH. Episcopic 3D imaging methods: Tools for researching gene function. Current genomics. 2008; 9: 282. doi:10.2174/138920208784533601PMID:19452045
10. Yamada S, Samtani RR, Lee ES, Lockett E, Uwabe C, Shiota K, et al. Developmental atlas of the early first trimester human embryo. Dev Dyn. 2010; 239: 1585–1595. doi:10.1002/dvdy.22316PMID: 20503356
11. Kim HK, Laor T, Shire NJ, Bean JA, Dardzinski BJ. Anterior and Posterior Cruciate Ligaments at Differ-ent PatiDiffer-ent Ages: MR Imaging Findings 1. Radiology. 2008; 247: 826–835. doi:10.1148/radiol. 2473071097PMID:18487537
12. Boeree NR, Ackroyd CE. Magnetic resonance imaging in the diagnosis and management of knee pathology. In: Aichroth PM, Cannon WD, editors. Knee surgery: Current Cractice. London: Martin Dunitz Ltd; 1992.
13. Zampeli F, Ntoulia A, Giotis D, Stavros R, Mitsionis G, Pappas E, et al. The PCL Index Is Correlated With the Control of Rotational Kinematics That Is Achieved After Anatomic Anterior Cruciate Ligament Reconstruction. The American journal of sports medicine. 2013; 43: 665–674.
14. Gentili A, Seeger LL, Yao L, Do HM. Anterior cruciate ligament tear: indirect signs at MR imaging. Radi-ology. 1994; 193: 835–840. PMID:7972834
15. Mitrovic D. Development of the diarthrodial joints in the rat embryo. The American journal of anatomy. 1978; 151: 475–485. PMID:645613
16. Gardner E, O'Rahilly R. The early development of the knee joint in staged human embryos. J Anat. 1968; 102: 289. PMID:5643844
17. Ratajczak W. Early development of the cruciate ligaments in staged human embryos. Folia Morphol (Praha). 2000; 59: 285–290.


![Fig 6. Cross angle of cruciate ligaments in each dimension. A: Cross angle of cruciate ligaments in the sagittal plane [β(sagittal)]](https://thumb-eu.123doks.com/thumbv2/123dok_br/18421648.360964/7.918.60.643.113.417/cross-cruciate-ligaments-dimension-cruciate-ligaments-sagittal-sagittal.webp)