Recording different geometries of 2D hexagonal
photonic crystals by choosing the phase between
two-beam interference exposures
J. W. Menezes and L. Cescato
Instituto de Física Gleb Wataghin,Universidade Estadual de Campinas,Cx.P. 6165, 13083-970 Campinas, SP, Brazil
[email protected], [email protected]
E. J. de Carvalho and E. S. Braga
Faculdade de Engenharia Elétrica e Computação, Universidade Estadual de Campinas, Cx.P. 6101, 13081-970 Campinas, SP, Brazil
[email protected], [email protected]
Abstract: 2D hexagonal patterns can be generated by the superimposition of two or three fringe patterns that have been formed by two-wave interference and that have rotations of 60o between them. Superimposing
three exposures solves the problem of asymmetry in the cross section of structures, which is caused by double exposure. The resulting structure, however, depends on the phase shift of the third fringe pattern in relation to the previous two. We propose a method for controlling the phase shift, and we demonstrate that three different lattice geometries of hexagonal photonic crystals can be recorded when the phase is chosen.
© 2006 Optical Society of America
OCIS codes: (090.0090) Holography; (260.3160) Interference; (220.4000) Microstructure fabrication; (220.0220) Optical design and fabrication
References and links
1. S. R. J. Brueck, “Optical and Interferometric Lithography Nanotechnology Enablers,” Proc. IEEE 93, 1704 (2005).
2. A. Fernandez, J. Y. Decker, S. M. Herman, D. W. Phillion, D. W. Sweeney and M. D. Perry, “Methods for fabricating arrays of holes using interference lithography,” J. Vac. Sci. Technol. B 15, 2439-2443 (1997). 3. L. Pang, W. Nakagawa and Y. Fainman, “Fabrication of two-dimensional photonic crystals with controlled
defects by use of multiple exposures and direct write,” Appl. Opt. 42, 5450-5456 (2003).
4. F. Quiñónez, J. W. Menezes, V. F. Rodriguez-Esquerre, H. Hernandez-Figueroa, R. D. Mansano and L. Cescato, “Band gap of hexagonal 2D photonic crystals with elliptical holes recorded by interference lithography,” Opt. Express 14, 4873-4879 (2006)
5. M. Campbel, D. N. Sharp, M. T. Harrison, R. G. Denning and A. J. Turberfield, “Fabrication of photonic crystals for the visible spectrum by holographic lithography,” Nature 404, 53-56 (2000).
6. D. N. Sharp, M. Campbell, E. R. Dedman, M. T. Harrison, R. G. Denning and A. J. Turberfield, “Photonic crystals for the visible spectrum by holographic lithography,” Opt. Quantum Electron. 34, 3-12 (2002). 7. N. D. Lai, W. P. Liang, J. H. Lin, C. C. Hsu and C. H. Lin, “Fabrication of two- and three-dimensional periodic structures by multi-exposure of two-beam interference technique,” Opt. Express 13, 9605-9611 (2005).
8. L. Cescato and J. Frejlich, Three-Dimensional Holographic Imaging (Wiley-Interscience Publication, 2002), Chap. 3.
9. A. A. Talin, K. A. Dean and J. E. Jaskie, “Field emission displays: a critical review,” Solid State Electron.
45, 963-976 (2001).
10. L. E. Gutierrez-Rivera, E. J. de Carvalho, M. A. Silva and L. Cescato, “Metallic submicrometer sieves fabricated by interferometric lithography and electroforming,” J. Micromech. Microeng. 15, 1932–1937 (2005).
12. N. D. Lai, W. P. Liang, J. H. Lin and C. C. Hsu, “Rapid fabrication of large-area periodic structures containing well-defined defects by combining holography and mask techniques,” Opt. Express 13, 5331-5337 (2005).
13. C. A. Mack, “Development of positive photoresists,” J. Electrochem. Soc. 134, 148–152 (1987). 14. B. A. Mello, I. F. Costa, C. R. A. Lima and L. Cescato, “Developed profile of holographically exposed
photoresist gratings,” Appl. Opt. 34, 597-601 (1995).
15. V. Berger, O. Gauthier-Lafaye and E. Costard, “Photonic band gaps and holography,” J. Appl. Phys. 82, 60-64 (1997).
16. M. Breide, S. Johansson, L. E. Nilsson and H. Ahlèn, “Blazed Holographic Gratings”, Opt. Acta 26, 1427-1441 (1979).
17. C. M. B. Cordeiro, A. A. Freschi, L. Li and L. Cescato, “Measurement of phase differences between the diffracted orders of deep relief gratings,” Opt. Letters 28, 683-685 (2003).
18. A. A. Freschi, F. J. dos Santos, E. L. Rigon and L. Cescato, “Phase-locking of superimposed diffractive gratings in photoresists,” Opt. Commun. 208, 41-49 (2002).
1. Introduction
The projection of interference patterns is an interesting technique for recording periodic structures because the interference pattern is three-dimensional. Thus, volumetric structures with dimensions of tenths of nanometers can be recorded, simultaneously in areas of several squared centimeters [1,2]. This technique can be associated with etching processes or molding in order to fabricate 2D [1,3,4] or 3D photonic crystals [5].
Although the direct interference of multiple beams has been largely employed to fabricate 3D [5,6] and 2D photonic crystals [2], in a recent paper [7] it was demonstrated that the multiple exposures of two-beam interference patterns is able to perform 3D photonic crystals, with remarkable advantages. High contrast patterns can be generated because the two interfering beams may have the same polarization [7] and the phase between the interfering beams can be controlled through a phase shift actuator placed in one of the interfering beams [4,8]. Besides this fact, homogeneous fringe patterns, with low distortion, can be obtained in large areas [1].
The double exposure of a sample to the same interference pattern, by rotating the sample by 90o between the exposures is a simple technique for generation of high contrast 2D
patterns. This technique has been successfully employed to record 2D cubic photonic crystals [2,4] as well as for arrays of silicon tips [9] or sieves [10]. Hexagonal lattices, however, are more appropriate for fabrication of photonic crystals because they present photonic band gaps (PBG) for a large range of filling factor and refractive indexes [4,11]. The recording of 2D hexagonal lattices is possible by superimposing two interference patterns rotated of 60o between them. Such process, however, generates asymmetric (elliptical) structures that reduce the range of filling factors that present photonic band gaps [4].
Such asymmetry can be solved by using the superimposition of three interference patterns, rotated of 60o among them [7]. The resulting 2D pattern, however, depends strongly on the relative phase between the third exposure and 2D pattern recorded by the former two exposures [12]. In this paper we present a method to control such phase and we demonstrate the recording of three different geometries of 2D hexagonal crystals using such phase control.
2. Simulated patterns
For multiple exposures of the same two-beam interference pattern, the resulting light dose in the photosensitive material is the sum of the light intensity IRi of the interference pattern multiplied by the time of each exposure (Δti).
(
)
1 n
R i Ri
i
E t I
=
=
∑
Δ (1)wave-fronts with equal irradiance I1=I2=I, and that the sample is rotated of an angle αi around the “z” axis, between the exposures, the resultant irradiance IRi of each interference pattern can be represented by:
( )
( )
(
)
2
2 1 cos cos sin
Ri i i i
i
I = I⎨⎪⎧ + ⎢⎡ π α x− α y +φ⎤⎥⎪⎬⎫
Λ
⎪ ⎣ ⎦⎪
⎩ ⎭ (2)
with Λi the fringe period of each exposure, αi is the rotation angle of each exposure in relation to the x axis and φi the relative phase of each fringe pattern.
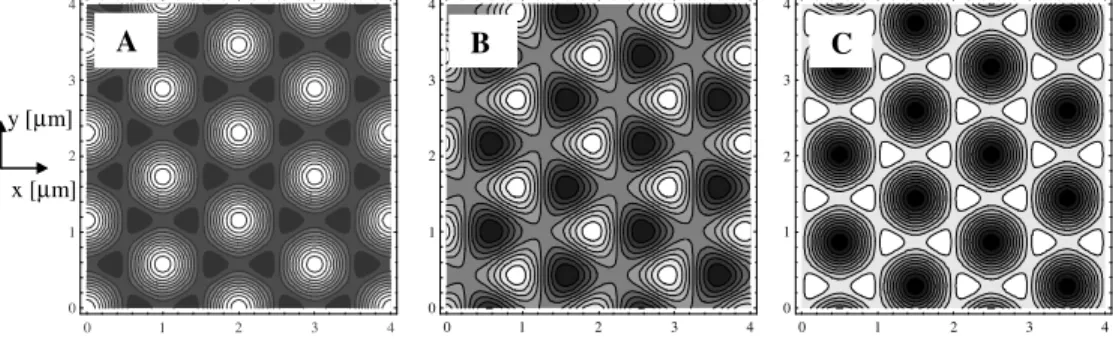
Figure 1 shows the simulated iso-dose light patterns resulting from the superimposition of two sinusoidal fringe patterns with de same period (n=2 and Λ1=Λ2=1µm), same time of exposure Δt1=Δt2, assuming α1=0o and α2=60o for the first and second exposure, respectively.
Fig. 1. Iso-dose light patterns resulting from the superimposition of two single interference fringe patterns rotated of 60o between them.
Note that the use of two exposures generates a hexagonal lattice, whose cross sections are rectangles that evolutes to ellipsis instead of the circles. In this case, any phase shift φ2 introduced in the second fringe pattern only shifts the whole pattern, but do not change the shape of the iso-dose curves. Thus, to this simulation we assumed φ1=φ2=0 in Eq. 2.
If we consider now the superimposition of three exposures (n=3), with the same fringe period (Λ1=Λ2=Λ3=1µm), with the same time of exposure Δt1=Δt2=Δt3 but rotated of 60o among them (α1=0o, α2=60o and α3=120o), the resulting light pattern for three different phase-shift values (φ3) of the third exposure in relation to former exposures (φ1=φ2=0) is shown in Fig. 2. In Fig. 2(a), φ3=0, while in Fig. 2(b), φ3=π/2 and in Fig. 2(c), φ3=π. For the case of φ3=-π/2 the resulting pattern is similar to that shown in Fig. 2(c), with a rotation of 60o
.
Fig. 2. Iso-dose light patterns resulting from the superimposition of three interference patterns rotated between them of 60o for a phase shift φ
3= 0 (a); φ3= π/2 (b) and φ3= π (c).
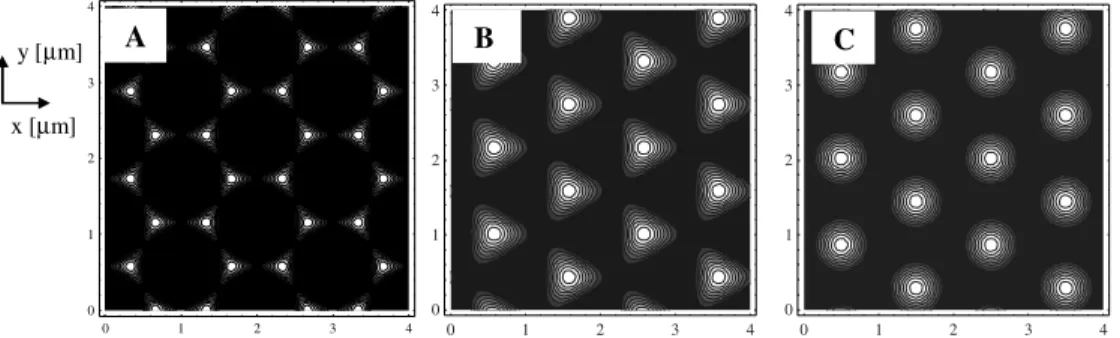
Using the resultant light dose it is possible to simulate the relief profile recorded in the photosensitive material taking into account its nonlinear response [13,14]. In the case of
0 1 2 3 4
0 1 2 3 4
x [µm] y [µm]
0 1 2 3 4
0 1 2 3 4
A
0 1 2 3 4
0 1 2 3 4
B
0 1 2 3 4
0 1 2 3 4
C
y [µm]
positive photoresists the nonlinearities alter substantially the relief profile of the gratings recorded by interference [14], however it does not change the top view geometry of the structures that are defined by the light pattern. Thus, assuming a simple linear development condition we can obtain the top view geometry of the structures recorded in photoresist that are shown in Fig. 3. Note the strong variation of the geometry with the phase shift φ3. For the case φ3=π (Fig. 3(c)) the photoresist structures are circles, while for φ3=π/2 (Fig. 3(b)) the photoresist structure presents a triangular base and for φ3=0 it appears a graphite like structure [15] (Fig. 3(a)). In the case of a triple exposure, obtained through a rotation of the sample around the same axis, the presence of a previous double exposure determines a reference point (at the maximum and minimum of both light pattern), thus, each phase shift of the third exposure results in a different superimposed pattern. In the case of three-dimensional patterns obtained by rotation of the sample around orthogonal axis [7], any phase shift φ3 introduced in the third fringe pattern only shifts the whole pattern, but do not change the resulting iso-dose curves.
Fig. 3. Top view of the simulated photoresist structures corresponding to the light patterns shown in Fig. 2(a); (b) and (c) respectively, for the same dose and development time. Each contour line corresponds to the same height of the photoresist structure.
3. Experimental procedure and Phase Control Method
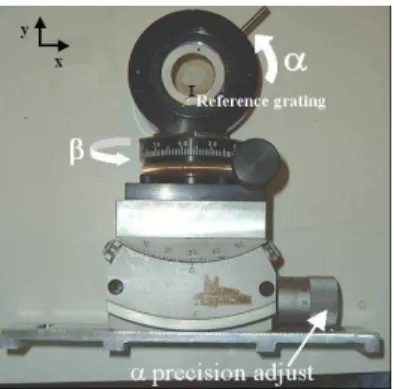
In order to record the hexagonal patterns and verify the phase shift dependence of the recorded geometry, films of the positive photoresist SC 1827 (from Rohn and Haas) were spin-coated on glass substrates forming a 400 nm thick film. The samples were pre-baked and then exposed in a holographic setup that employs the line λ = 457.9nm of an Ar laser. The normal to sample is aligned with the bisector angle between the two interfering beams. This setup is provided of a fringe locker system that warrants the high contrast of the interference fringe patterns [8]. The fringe period may be chosen with any value between 0.45µm and 2µm. In this experiment we have used a fringe period of 1µm and a dose of 200 mJ/cm2 in each exposure. After the first exposure the sample is rotated of 60o, and exposed again to the same light dose.
After the second exposure, an outside ring of the sample (as shown in Fig. 4) is developed in AZ 351 developer 1:3 for about 15 seconds, in order to obtain a two dimensional grating that will be used as a reference. The sample is then repositioned in the interference pattern at the same position of the first exposure (interference fringes aligned with the first recorded grating).
Figure 5 shows the transmitted diffracted orders when the entire sample is developed (not only the ring). Each incident beam generates a hexagonal diffraction pattern around the direction of each transmitted wave.
Due to the simultaneous incidence of two beams onto the sample, in each diffraction direction, there is interference between two diffracted beams, forming a “Moire-like” pattern [16, 17]. When the grating is perfectly aligned with the interference pattern, the “Moire-like” pattern period is maximal [16, 17]. The maximum “Moire-like” pattern period is also a
0 1 2 3 4
0 1 2 3 4
0 1 2 3 4
0 1 2 3 4
0 1 2 3 4
0 1 2 3 4
y [µm]
x [µm]
measurement of the distortion of the recorded grating in relation to the interference light fringes. In order to have phase control of the interference pattern, it is necessary to take care with the interference fringe distortion. A quality of the interfering wave fronts of λ/10 determines a maximum distortion of 1/10 of the fringes along the same area. Thus, the distortion of the fringe must be much smaller than the desired phase shift to warrant the right phase in the entire area. In our case we can warrant a wave-front quality better than λ/10 in the whole area of our sample (about one inch squared).
Fig. 4: Photograph of the sample holder showing the angle α and the outside reference ring.
Fig. 5: Photographs of the Moiré-like pattern formed at the diffracted orders. The sequence shows the alignment of the grating with the maximum Moiré-like period corresponding to the best repositioning of the sample. The small curvature of the fringes indicates a small wave front distortion and for the best positioning of the sample that the same phase difference occurs along the whole sample.
Due to the hexagonal symmetry of the recorded pattern in the photoresist, the “Moire-like” pattern occurs for three positions of the sample in relation to the light fringes: a) when the interference fringes are aligned with the first recorded grating, b) when the fringes are aligned with the second grating (rotated by 60o in relation to the first grating) and c) when the sample is rotated by 120o in relation to the first grating.
Any phase shift in the microscopic interference pattern produces the same phase shift in the “Moire-like” pattern [17]. Thus, by positioning a photodetector, in the “Moire-like” pattern, a signal proportional to light intensity of the interference of the diffracted waves can be measured. By using this signal in an analogical feedback system [8], it is possible both to compensate the fringe thermal perturbations during the third exposure and to choose the phase shift between the interfering beams among the values of 0, π or ±π/2 [17,18]. As such phase shift is the same of light fringe pattern in relation to the recorded grating, if we can control such phase we can choose the phase between the third grating and the former recorded hexagonal grating.
amplitude reference signal, in order to allow the use of synchronous detection techniques [8]. By using two lock-in amplifiers, the first or the second harmonic of the reference signal can be simultaneously measured [8]. If we use the first harmonic signal, as an error signal, to feedback the piezoelectric actuator, the phase between the interfering waves in the “Moire-like” will be ±π/2 [8], depending on the plus or minus signal of the first harmonic used to feedback. By the other side, if we use the second harmonic as an error signal to feedback the piezoelectric actuator, the phase between the interfering waves in the “Moire-like” will be 0 or π [8], depending also on the plus or minus signal of the second harmonic.
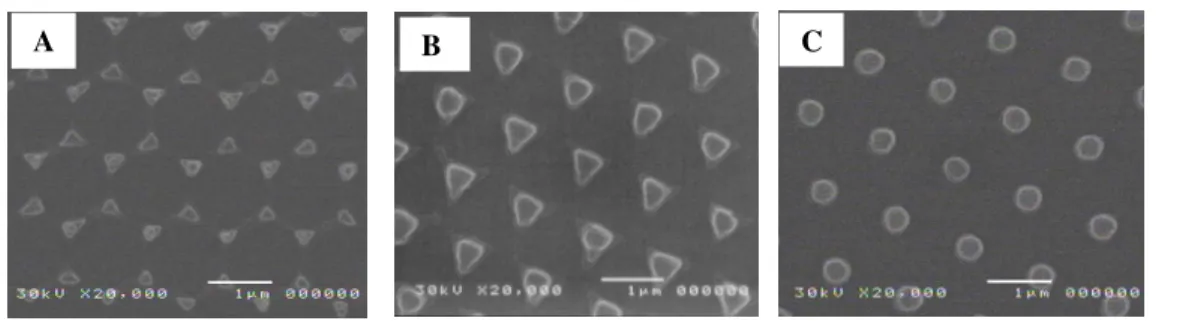
After the third exposure, using the desired condition, the samples were developed in AZ 351 diluted in deionized water 1:3 for about 25 seconds. After coating with a thin Au layer the top view of the center of the samples were photographed in a SEM.
4. Results
Figure 6 shows the top view of the photoresist structures, recorded for three different phase conditions: 0, +π/2 or π. Note the good agreement of the photoresist structures in comparison with the simulations shown in Fig. 3 (a), (b) and (c). The same geometry observed in Fig. 6 is obtained along the whole sample of 1 inch of side squared. This occurs due to both: the good quality of the wavefront and the good alignment of the recorded sample in relation to the interference fringes. Note also that in Fig. 6(c) the resulting photoresist structures present a circular cross section while the basis of the photoresist structures shown in Fig. 6(b) are triangles. Figure 6(a) exhibits the graphite lattice geometry as in the simulation shown in Fig. 3(a).
Fig. 6. Structures recorded in a positive photoresist on glass substrates using the superimposition of three exposures with rotations of 60o between them and phase-shifts of (a)
φ3=0, (b) φ3=π/2 and (c) φ3=π. 5. Conclusion
The superimposition of three interference patterns, generated by two beams, allows the recording of different geometries of 2D hexagonal photonic crystals. The first hexagonal lattice presents structures (“atoms”) with a circular cross section, while the second present a triangular cross section for the structures or atoms and the third geometry exhibits a graphite lattice. In particular the first two geometries may present new interesting photonic properties. The geometry of the structures is determined by the phase shift between the third exposure and the previous two-dimensional recorded pattern. The phase shift control uses the diffraction of the two incident beams in the grating recorded after the first two exposures, as a reference, and a synchronous detection feedback system. Such method can be used for fabrication of these geometries in large areas; the limitation is the quality of the wavefronts of the interfering waves.
Acknowledgments
We acknowledge the financial support of the FAPESP (Fundação de Amparo a Pesquisa do Estado de São Paulo) and of the CNPq (Conselho Nacional de Pesquisas).