American Journal of Applied Sciences 2 (12): 1595-1599, 2005 ISSN 1546-9239
© 2005 Science Publications
Corresponding Author: Farouk Rashwan, Chemistry Department, Faculty of Science, South Valley University, 82524 Sohag, Egypt
The Application of Electrochemical Impedance Techniques in Analyzing
the AC Response of Some Two-electron Transfer Dye Systems
Farouk Rashwan
Chemistry Department, Faculty of Science, South Valley University, 82524 Sohag, Egypt
Abstract: The Electrochemical Impedance Spectroscopic techniques (EIS) were used to investigate the behavior of some dye compounds (quinoid systems) characterized with 2e-transfer processes. For this purpose, Alizarin Red S (ARS), Alizarin Cyanine (AC), Alizarin Viridin (AV) and carminic acid were chosen for the measurements. The EIS experiments were performed using a small AC amplitude (10 mV p-p) in addition to a relatively wide frequency range (0.01 Hz ≤ f ≤ 105 Hz). The investigations were carried out at room temperature in aqueous media (HClO4, NaClO4 and KNO3) on the Hanging Mercury Drop Electrode (HMDE) and for comparison one experiment only was measured in aprotic solvent (DMF) on the Pt-disc electrode. The EIS diagrams of these systems were characterized in the complex plane by two fundamental observations, the first of which is a straight line crossing the real axis at an angle of 45o (or at least nearly so) and the second one is two semicircles beside each other corresponding to high-frequency and low-frequency regions, which are implying the presence of well-separated time constants. The EIS characteristic parameters for these dye systems were calculated and discussed.
Key words: Electrochemical impedance techniques, dye compounds, alizarin cyanine, alizarin viridin
INTRODUCTION
It has been recognized for a long time that AC techniques are valuable in which diagnostic conclusions can be drawn to elucidate an electrode reaction mechanism. Electrochemical impedance spectroscopy (EIS) has been very successfully applied to investigate a multitude of systems[1].
Electrochemical studies of redox systems involving two-charge transfer processes were frequently investigated[2-7]. In addition to the principal of the energy barrier characterizing each electron transfer, the kinetics of the electrode reactions becomes complicated when besides diffusion of the electroactive species coupled chemical reactions control their transport to the electrode.
Alizarin red S (ARS) has been widely used in the analysis of metal ions[8-12] because of its strong chelating abilities. It has been incorporated into polypyrrole-modified electrodes to the electrochemical analysis of Cu (I) and Cu (II)[13]. Recently, The behavior of alizarin red S adsorbed on electrochemically pretreated glassy carbon electrode, has been investigated by Shui et al[14]. Ju - Nan Li et al
studied the adsorption voltammetry of the mixpolynuclear complex of zirconium-calcium-alizarin red S at a carbon paste electrode[15]. In pharmaceutical formulations, alizarin red S was applied in the determination of some drugs[16]. Linear sweep voltammetric technique has been applied for the determination of protein using also alizarin red S[17].
Carminic acid has many applications, the acid has been used in the analysis of anthraquinoid and indigoid dyes used in ancient artistic works by thermal hydrolysis[18]. The acid has been also used in the simultaneous spectrophotometric determination of uranium and thorium ions as their complexes arsenate (III) spectrophotometrically by a multivariate calibration method in hydrochloric acid medium[19].
electrocapillary curves. Carminic acid, known as a natural colorant, along with seven different synthetic food colorants which are commonly used as food additives were analytically detected by capillary electrophoresis[26].
Absorption and fluorescence spectra, and emission quantum yields, have been used for studying carminic acid and carminic lake in solution and on painted surfaces (solid layer)[27, 28].
Recently, Almeide et al. investigated the adsorptive stripping of anthraquinone-based reactive dyes applaying the Square wave voltammetric technique[29]. They have concluded that the reduction of their anthraquinone moiety is a reversible process.
In all these treatments, little or no attention is given to the EIS study of the 2e transfer dye systems under investigation. The goal of this work was to use the electrochemical impedance spectroscopic techniques to investigate the responses characterizing the electrochemical behavior of these compounds.
Experimental: Reagent-grade N, N-
dimethylformamide was further purified and dried according to a previous recomended method[30].Tetrabutylammonium hexaflourophosphate (TBAPF6) obtained from FLUKA was recrystallised twice from pure ethanol and vacuum dried at 120 oC. Aqueous electrolytes have been prepared using also reagent-grade chemicals and were diluted to proper concentrations with bidistilled water.
For the purposes of carrying out electrochemical measurements in superdry media, a type of cell is frequently constructed and described elsewhere[31]. In this cell, three electrodes are used; the working is either a platinum disc (Pt) or a metrohm EA 290 hanging mercury drop electrode [HMDE]. A platinum wire is used as an auxiliary electrode. The reference electrode is an Ag/AgCl where its potential is calibrated after the experiment against the reversible oxidation peak of ferrocene. The saturated calomel electrode (SCE) was used as the reference electrode in aqueous media.
An EG&G Princeton Applied Research 5208 Two-Phase Lock-in analyzer is used in conjuntion with a computer controlled 273A Potentiostat/Galvanostat to perform the desired signals. A positive feedback, which is installed inside the 273A, is used in all the measurements to minimize the iR-drop effects.
RESULTS AND DISCUSSION
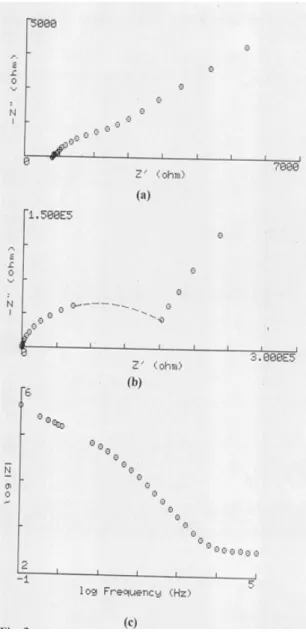
Figure 1a presents the Nyquist plot of 2.5 mM of alizarin red S in 0.3 M KNO3 at the cyclic voltammetric (CV) peak potential of the first charge transfer step (-0.54 V vs. SCE). The data reveal at low frequencies, a linear impedance locus with an angle of 45o to the real axis, with a partially resolved semicircle at high frequencies. The behavior can be attributed to the presence of relaxations occurring at the solution-
electrode interface which is indicative of a diffusion process at the electrolyte-electrode interface. The physical model appropriate to this case is the simple equivalent Randle ’s electrical circuit, which gives an evidence for the expected low-frequency Warburg response. Similar behavior for the reduction of ARS in KNO3 is obtained for 1.44 mM of (ARS) to the anion radical, is obtained in case of 0.3 M NaClO4. The unique difference, is that in the complex plane, in the case of NaClO4, the straight line resulting from the dominated Warburg impedance, crosses the real axis at an angle smaller than 45o.The complex plane of also 2.5 mM of ARS in HClO4 , which is presented in Fig. 1b, is found inherently different, the impedance locus takes the form of two semicircles and appears dominated by nondiffusional component, indicating that the kinetics of the first charge transfer in this case is even a slower process than in NaClO4 solution.
Fig. 1(a) & (b): Complex impedance plane plot of 2.5 mM of alizarin red S (ARS) at [HMDE] electrode at 25oC for the redox couple (ARS)/(ARS) in:
(a) 0.3 M KNO3. (b) 0.3 M HClO4
(c) The Bauerle equivalent circuit corresponds to the behavior in part b showing the two impedance elements associated with each semicircle
Fig. 2:
(a): The Bode plot for the same data in 1b.
(b): The Nyquist plot for 1.9 mM alizarin cyanine (AC) in 0.3 M KNO3 at [HMDE] electrode at 25oC for the redox couple (AC)/(AC)
-(c): The Nyquist plot for 2.0 mM alizarin cyanine (AC) in 0.3 M KNO3 at [HMDE] electrode at 25oC for the redox couple (AC)-/(AC)
2-Since, specific adsorption of such dye molecules at the electrode is very expected. The equivalent circuit proposed to fit these results (especially in HClO4 solution) is shown in Figure 1c and 1d. The high-frequency semicircle (the one on the left in Fig. 1b) was ascribed to bulk electrolyte behavior, while the low-frequency semicircle (on the right in Fig. 1b) corresponded to the electrode polarization[32]. The in parallel circuit of Fig. 1d is an alternative appropriate equivalent circuit for a well-separated time constants
where it is also expected that a parallel RC combination can rise from specific adsorption at an electrode, possibly associated with delayed reaction processes, as previousely concluded. The response arising from R∞ and C∞ in Fig. 1d is to remind one that it often occurs in too high ferquency region.
Figure 2a, shows an ideal Bode plot, which is a useful alternative to the Nyquist plot, for the same foregoing data (ARS in NaClO4 1b).
Fig. 3:
(a): Complex impedance plane plot for 1.6 mM of alizarin viridin (AV) in DMF/0.25 M TBAPF6 at the Pt-disc electrode at 25oC for the redox couple (AV)/(AV)
Table 1: Electrochemical impedance parameters calculated for some 2-charge transfer dye systems in aqueous mediaa and DM
Compound / EIS Parameter 0.3 M KNO3 0.3 M NaClO4 0.3 M HClO4 DMF
1-Alizarin Red S (ARS)
Cdl –Farad 1*10-5 1.1*10-5 1.34*10-6 b
RW -W 287 286 45.5b
Rct -W 454 202 1638b
2-Alizarin cyanine (CAN)
Cdl -Farad 1.5*10-8 b 2.5*10-6 b
RW -W 272b 181b
Rct -W 6362b 3728b
3-Alizarin viridin (AV)
Cdl -Farad 1.33*10-6 1.64*10-6 9.12*10-5
RW -W 658 439 692
Rct -W 1447 848
4- Carminic acid
Cdl – Farad 3.16*10-6 b 1.71*10-6 b
RW -W 368b 175b
Rct-W 2202b 4394b
a = Measurements carried out in DMF using Pt-disk electrode whereas those in aqueous solutions were carried out on the [HMDE]. b = Data obtained for 2e-trasfer wave.
The EIS behavior at the peak potential of the second process in KNO3, NaClO4 and in HCLO4 are similar to that expected for purely capacitive (dielectric) response. Figures 2b and 2c, depicts the complex plane (Nyquist plot) at the peak potentianl of the first step on the cyclic voltammogram of the behavior of 1.9 mM and 2.0 mM of alizarin cyanine (ACN) in 0.3 M in both KNO3 and NaClO4 repectively. For each response, also two semicircles are observed, a high-frequency semicircle (on the left), which is concluded to ascrib to bulk electrolyte properties and a low frequency one (on the right) which it is corresponded to the electrode polarization phenomena. Still Figures 1c and 1d, represent the equivalent circuits fit the responses shown in Figures 2b and 2c showing the two impedance elements associated with each semicircle[32].
The data shown in Figure 3a, represent the Nyquist plot of 1.6 mM of alizarin viridin (AV) in superdry N, N-dimethylformamide containing 0.25 M TBABF6 at the CV peak-potential of the 2e-transfer step (at -1.4 V vs. Ag/AgCl). The behavior is a straight line at sufficiently low frequencies where the impedance is predicted to intercept the real axis at 45o, with a typical partially resolved semicircle at high frequencies, indicative that diffusion of AV ions in the solution is the rate-determining step in the whole process.
Figure 3b, shows the complex plane impedance of 2.0 mM of the dye (AV) in 0.3 M NaClO4 also, at the CV peak-potential of the 2e-transfer step (at -0.875 V vs. SCE). The data is very similar to that obtained for ACN KNO3 (Fig. 2b) which reveals the presence of non-Warburg impedance element. Figure 3c is a Bode plot for the same foregoing data (3b). In the complex plane, the Nyquist diagram behavior of 2.5 mM of carminic acid in 0.3 M KNO3 at the CV peak-potential of the 2e transfer-step (-0.535 V vs. SCE) on the [HMDE] electrode, shows a capacitive semicircle response implaying that the kinetics of the charge transfer is slower than the carminic ion difusion
at the electrode-electrolyte interface. The Nyquist diagram of the acid in NaClO4 solution is very similar to that obtained for the EIS behavior of the acid in KNO3 and both responses resemple the behavior that observed for alizarin cyanine in the same solution (see Fig. 2b). The data, as concluded before, is characteristic for a purely capacitive (dielectric) response.
The typical Bode plots registered for all measurements enable the evaluation of the EIS parameters with good accuracy (Table 1).
REFERENCES
1. Zeller, R.L.III and R.F. Sovinell, 1986. Corros. Sci., 26: 591.
2. Smith, W.H. and A.J. Bard, 1976. J. Electroanal. Chem., 76: 19.
3. Phelps, J. and A.J. Bard, 1976. Electroanal. Chem., 68: 313.
4. Ryan, M.D. and D H. Evans, 1976. J. Electroanal., 67: 333.
5. Tulyathan, B. and Geiger, 1985. J. Am. Chem. Soc., 107: 5960.
6. Yildiz, A. and H. Baumgrtel, 1977. Bunsenges. Phys. Chem., 81: 1177.
7. Heinze, J., M. Dietrich, K. Hinkelmann, K. Meerholz and F. Rashwan, 1988.
Dechema-Monographien, Band 112-VCH
Verlagsgesellschaft.
8. Li, N.Q., L. Zhang and X.X. Gao, 1983. Acta Chim. Sinica, 41: 351.
9. Shiu, K.K. and D.J. Harrison, 1989. J. Electroanal. Chem., 262: 145.
10. Chimpalee, N., D. Chimpalee, B. Boonyanitchayakul and D. T. Burns, 1993. Anal. Chim. Acta, 282: 643.
11. Campana, A.M.G., F.A. Barrero, M.R. Ceba and A.F. Gutierrez, 1994. Analyst, 119: 1903.
13. Shiu, K.K. and O.Y. Chan, 1994. J. Electroanal. Chem., 388: 45.
14. Hong-Ping, D. and K.-K. Shiu, 1988. Electrochim. Acta, 43: 2709.
15. Li, J.-N., J. Zhang, P.-H. Deng and Y.-Q. Peng, 2001. Anal. Chim. Acta, 431: 81.
16. Alaa, S.A., 2002. J. Pharma. Biom. Anal., 29: 729. 17. Sun, W. and K. Jiao, 2002. Talanta, 56: 1073. 18. Fabbri, D., G. Chiavari and H. Ling, 2000. J. Anal.
Appl. Pyrolysis., 56: 2.
19. Lopez-de-alba, P., L. Lopez-Martinez, K. Wrobel and J. Amadorhernadez., 1997. J. Radioanal. Nucl. Chem., 220: 167.
20. Carvalho, P. and C. Collins, 1997. Chromatography, 45: 63.
21. Panadero, S., A. Gomezhens and D. Perezbendito, 1997. F. J. Anal. Chem., 357: 80.
22. Manzoori, J., M. Sorouraddin and M. Amjadi, 2000. Talanta, 53: 61.
23. Degenhardt, A. and P. Winterhalter, 2001. J. Liq. Chromtogr. Relat. Tchnol., 24: 1745.
24. Martinez, L., J. Guman-Mar and P. Lopez-de-Alba, 2001. J. Radioanal. Nucl. Chem., 247: 413.
25. Araiza, J., R. Mendoza, G. Jimenez and I. Martinez., Quim. Anal., 19: 159.
26. Huang, H., Y. Shih and Y. Chen, 2002. J. Chromatogr. A, 959: 317.
27. Favaro, G., C. Miliani, A. Romani and M. Vagnini, J. Chem. Soc. -Perkin Trans., 2: 192.
28. Miliani, C., A. Rormani and G. Favaro, 1998. Spectrochim. Acta Part A, 54: 581.
29. Almeida, P.J., J.A. Rodrigues, A.A. Barros and A. G. Fogg, Analytica Chimica Acta, 385: 287. 30. Coetzee, J.F., 1982. Recommended Methods for
Purification of Solvents. Pergamon, Oxford. 31. Rashwan, F., 1988. Doctoral Dissertation,
Freiburgi. Br. Universitt, West Germany.