www.earth-syst-sci-data.net/8/177/2016/ doi:10.5194/essd-8-177-2016
© Author(s) 2016. CC Attribution 3.0 License.
Ecological survey of the native pinewoods of
Scotland 1971
Claire M. Wood1and Robert G. H. Bunce2
1Centre for Ecology and Hydrology, Lancaster Environment Centre, Bailrigg, Lancaster LA1 4AP, UK 2Estonian University of Life Sciences, Kreuzwaldi 5, 51014 Tartu, Estonia
Correspondence to:Claire M. Wood ([email protected])
Received: 3 February 2016 – Published in Earth Syst. Sci. Data Discuss.: 10 February 2016 Revised: 8 April 2016 – Accepted: 20 April 2016 – Published: 10 May 2016
Abstract. In 1971, a comprehensive ecological survey of the native pinewoods of Scotland was carried out by the Institute of Terrestrial Ecology. The survey was initiated as a consequence of growing concern about the status of the pinewood resource. Since the twentieth century, this unique habitat is widely recognised, not only by ecologists for its inherent biodiversity but also by the general public for its cultural and amenity value. The survey, utilising demonstrably repeatable methods, collected information on ground flora, soils, forest structure and also general site information from the major 27 sites of the 35 sites identified as truly native pinewoods in Scotland. The results from the survey prompted the organisation of an international symposium in 1975, which set the conservation agenda for the old Caledonian pinewoods. The data collected during the 1971 survey are now publicly available via the following DOI: doi:10/7xb (“Habitat, vegetation, tree and soil data from Native Pinewoods in Scotland, 1971”). Although the data are now 44 years old, the repeatable methods will allow for a resurvey to take place, in order to assess changes in the vegetation, habitats and tree composition in a statistically robust manner.
1 Introduction
Scots pine (Pinus sylvestrisL.) is the most widely distributed conifer in the world (Steven and Carlisle, 1959). The only truly native and natural pinewoods in Britain are located in the Highlands of Scotland. Often referred to as the Caledo-nian Forest, the Scottish native pinewoods are of great inter-est, not only to the ecologist but also to the general public for cultural and amenity value. The native pinewoods of Scot-land have a high biodiversity value and contain their own distinctive plants (and taxa). The pines themselves are genet-ically distinct, being of a unique variety (Pinus sylvestrisvar. scotica), which has adapted to the wetter and windier condi-tions of Scotland (Bain, 2013).
Concern for the ecological state of the native pinewoods was initiated in the 1940s and 1950s, resulting in a histor-ical study undertaken by A. Carlisle in the late 1950s, and published asThe Native Pinewoods of Scotland(Steven and Carlisle, 1959). This covered their location, condition and history, served to highlight the state of the native woodland
resource and stimulated interest in the ecological value of the forests. Accordingly, a survey of the native pinewoods of Scotland was planned in 1970 to establish the range of variation within the pinewoods and to assess the state of the resource (Bunce, 1973). The survey was co-ordinated by the Institute of Terrestrial Ecology at Merlewood Research Station, Cumbria (now part of the Centre for Ecology and Hydrology), in conjunction with conservation colleagues in Scotland. The results of the survey were presented at an In-ternational Symposium held in Aviemore, Scotland, in 1975 (Bunce, 1977), and indicated a reduction in the area of the pinewoods since 1959. The survey and symposium served as an alert to stop taking the pinewoods for granted.
in-terference. Twenty-six of the 35 sites described by Steven and Carlisle were included in the 1971 survey (another site was surveyed in 1972 and the remaining eight mainly con-sisted of scattered trees). The methods followed those stan-dardised by Bunce and Shaw (1973), described below, and also used in many subsequent surveys, including a national survey of semi-natural woodlands, also undertaken in 1971 (Wood et al., 2015b).
2 The native pinewood habitat
The terms “ancient” and “natural” tend to be used to describe woods originating before 1750, without subsequent human planting (in practice, woods in Britain are rarely unmanaged in some form or other, and therefore the term semi-natural is perhaps more appropriate) (Peterken, 1996; Balfour, 1977). Within the pinewoods, individual trees can live as long as 600 years, but generally live to around 250 (Bain, 2013).
As with other forests and woodlands in Britain, the pinewoods have been exploited by man over the centuries. The native Scottish pinewoods are the remaining fragments of an original forest system, reaching a maximum extent in Britain around 7500–4000 BP, as demonstrated by pollen records and macrofossil evidence (Bennett, 1984). Even six-teenth century maps provide evidence of a much wider distri-bution of Scots pine in the past than currently exists (Smout, 2006; Bain, 2013). Many of the remaining remnants have survived because they are remote or exist on poor soils. The remaining woods are therefore generally small, isolated and dominated by the one species of tree, the Scots pine.
Prior to the twentieth century, the pinewoods were de-pleted due to a range of human factors. Particularly dur-ing the seventeenth century, the pinewoods were progres-sively exploited as deer hunting forests, for livestock grazing, and as a timber and fuel resource (Smout, 2006; Steven and Carlisle, 1959; Gimingham, 1977). There is documented ev-idence that at least a dozen former areas of native pinewood have been lost since that time, although it is difficult to de-termine the exact details of all of the lost areas of pinewood due to incomplete historic records (Smout, 2006).
Some of the decline might also be attributed to historic climatic factors. As highlighted by Smout (2006), many lost pinewoods were located in the west of Scotland. As regen-eration is known to occur more readily in the east, where it is much drier, it seems likely that wet and windy oceanic weather occurring in the sixteenth and seventeenth centuries would have had an adverse effect (Smout, 2006).
The consequences of these external influences on the pinewoods were threefold. Firstly, a reduction in area oc-curred, secondly a reduction in diversity occurred (Betula spp., Sorbus aucuparia and Juniperus spp. were all more abundant in the forests than now), and thirdly changes in the density and age structure of pure stands took place (Giming-ham, 1977).
It was only during the twentieth century that the pinewoods started to be appreciated for their biodiversity value. Pinewoods are now recognised as an Annex I Prior-ity Habitat under the EU Habitats Directive (JNCC, 2015; Romão, 2013) and are also listed on the Scottish Biodiver-sity List by the Scottish Government (Scottish Government, 2015). Nationally scarce plants may be found in the woods, such as twinflower (Linnaea borealis) and creeping lady’s tresses (Goodyera repens). In addition to a unique ground flora, several varieties of native fauna are associated with the pinewoods, such as red squirrels (Sciurus vulgaris), the Scot-tish wildcat (Felis silvestris) and the pine marten (Martes martes). Bilberry (Vaccinium myrtillus) pollination depends on a rare bumblebee (Bombus monticola) (Bain, 2013; Lowe, 1977). The bird fauna is characteristic, and around 70 species of birds are known to breed regularly in the pinewoods. Sev-eral species are found in the pinewoods which are scarce elsewhere in Britain, including the crested tit (Lophophanes cristatus), the Scottish crossbill (Loxia scotica) and the Ca-percaillie (Tetrao urogallus) (Newton and Moss, 1977).
Broadleaved species are often an important component of the pinewoods, particularly birch (Betulasp.), oak (Quercus sp.), rowan (Sorbus aucuparia) and juniper (Juniperussp.).
2.1 Survey sites
A set of 27 sites were chosen from 35 included as maps in the Steven and Carlisle book, as shown in Fig. 1 and Table 1. The chosen sites were the major areas of woodland, the remain-ing eight mainly consistremain-ing of scattered trees. The outlines of the forests were taken from this book, and 16 dispersed randomised points were marked and then located in the field by compass bearings and pacing from a recognised nearby landmark. Strict rules were imposed to ensure that there was no avoidable alteration to the predetermined position of the plots (Bunce, 1977).
2.2 Site descriptions
Steven and Carlisle (1959) divided the pinewoods into eight regional groups (as shown in Fig. 1). At least one site was surveyed from all of the groups mentioned.
The forests within the northern group are the isolated rem-nants of pinewood forests which would have grown through-out Sutherland. Overall, the pinewoods in this group are the smallest of the woods. Of these, only Amat was included in this survey. Records indicate that Amat would once have been part of extensive woodland that stretched across the val-ley, much of which was felled for shipbuilding in the eigh-teenth century (Steven and Carlisle, 1959).
Table 1.List of surveyed pinewoods.
Site number Name OS grid ref. Area of pure pine (ha)
(Steven and Carlisle, 1959)
1 Glen Tanar NO459941 863
2 Ballochbuie NO200897 860
3 Mar NO099892 415
4 Abernethy NH970183 827
5 Rothiemurchus NH925065 932
6 Glenmore NH981091 65
7 Glen Feshie NN841939 288
8 Rannoch NN582542 372
9 Meggernie NN553467 131
10 Glen Moriston NH313117 80
11 Glengarry NH226003 324
12 Barrisdale NG883071 183
13 Loch Arkaig and Glen Mallie NN085900 164
14 Ardgour NM986750 131
15 Glen Affric NH203225 710
16 Glen Cannich NH227315 302
17 Glen Strathfarrar NH238375 204
18 Guisachan and Cougie NH318241 255
19 Coulin NG997568 142
20 Achnashellach NH028483 130
21 Shieldaig NG825522 51
22 Amat NH454895 98
23 Loch Maree NG881727 160
24 Black Mount NN284441 55
25 Glen Orchy NN240330 55
26 Tyndrum NN328279 66
27 Dulnain NH831185 Not given
there has been relatively little felling of the forest since that time (Bain, 2013).
The Speyside group includes some of the most exten-sive remaining pinewoods: Abernethy and Rothiemurchus, as well as Glenmore, Glen Feshie and Dulnain. These wood-lands are now within the Cairngorms National Park, and are much visited, particularly the former three. Thanks to regeneration and restoration in these woods, they demon-strate good examples of Caledonian forest. In the nineteenth century, Rothiemurchus and Abernethy were hunting forests (Smout, 2006; Bain, 2013).
The Rannoch group, lying in the heart of Perthshire, in-cludes the Black Wood of Rannoch and the Old Wood of Meggernie. Birch is an important constituent of both of these woods.
The pinewoods in the Great Glen group are situated in the valleys of the glen, and include Glen Moriston, Glengarry, Barrisdale, Loch Arkaig and Glen Mallie, and Ardgour. The forests here form part of a landscape of open moors and mountains but have been much influenced by planting of ex-otic conifers.
In the Wester Ross group, at the western edge of the nat-ural Scots pine entire world range, is Shieldaig, near the
Atlantic coast beyond the isolated Torridon mountains. The group also includes Loch Maree, Coulin and Achnashel-lach. The region has a high rainfall (annual total in 2015: 2254 mm) relative to Britain as a whole (annual total in 2015: 1289 mm), and in comparison to the east of Scotland (an-nual total in 2015: 1368 mm) (Met Office, 2016). The sur-viving pinewoods are relatively small in area and generally surrounded by moorland.
The southern group consists of relatively small remnants east of Loch Linnhe and the Firth of Lorne including Black Mount Woods, Glen Orchy and Tyndrum.
The Strath Glass group, located in an area of the Highlands popular with visitors, includes Glen Affric, Glen Cannich, Glen Strathfarrar, and Guisachan and Cougie.
Figure 1.Map of survey site locations.
maps given in Steven and Carlisle (1959) and shown in Ta-ble 1. These figures could now be improved by interpreta-tion of modern aerial photography, with forest being at least 30 % cover (otherwise they should be considered as scat-tered trees) or a resurvey could perhaps provide improved area estimates based on a standard basal area per hectare. The largest of the pinewood sites are Glen Tanar, Abernethy, Rothiemurchus and Ballochbuie, all estimated as having over 800 ha of pure pine area. The smallest, with less than 60 ha of pure pine, are Glen Orchy, Black Mount and Shieldaig. The rest of the sites are estimated as having a range from between 65 and 710 ha of pure pine (although these fig-ures must be treated with caution). The overall area of na-tive pinewood as surveyed in the Nana-tive Woodland Survey of Scotland (NWSS) is 87 599 ha (Patterson et al., 2014). This figure is greatly in excess of the pinewoods described as historically certain to be of native origin by Steven and Carlisle (1959). Goodier and Bunce (1977) measured the woodland areas from the maps in Steven and Carlisle (1959) which gave an overall figure of 10 700 ha, although the area of relatively dense pine from the sample survey described in this paper was only 1600 ha. Whilst the larger figure will
con-tain sites comparable to the true old Caledonian pinewoods, they do not have the necessary criteria to be considered as old-growth forests and also do not satisfy the definition given in Annex I of the Habitats Directive (Romão, 2013).
2.3 Plot layout and descriptions
Following the methodology of Bunce and Shaw (1973), 16 plots were randomly positioned within each site and the lo-cation of each was marked on a 1 : 25 000 map. Each plot was 14.1×14.1 m (200 m2) (Fig. 2) and constructed as shown in Fig. 3, with one centre post and four corner posts, with a set of four strings tagged with markers at specified distances. The centre post had a right angled gauge affixed to the top, in order to orientate the plot at random. In the field, plots were located by pacing from the nearest relocatable feature. As described below, data were then collected on ground flora, tree and shrub layers and soils. Habitat characteristics were recorded for the both the individual plots and each wood as a whole.
The sampling intensity of 16 plots per site was used in a concurrent survey, the Woodland Survey of Great Britain in 1971 (Wood et al., 2015b), and was chosen on the basis of previous experiences in surveying a wide variety of sites in the north of England and Wales. It also coincided with the time and manpower available (Bunce and Shaw, 1973).
3 Data collected
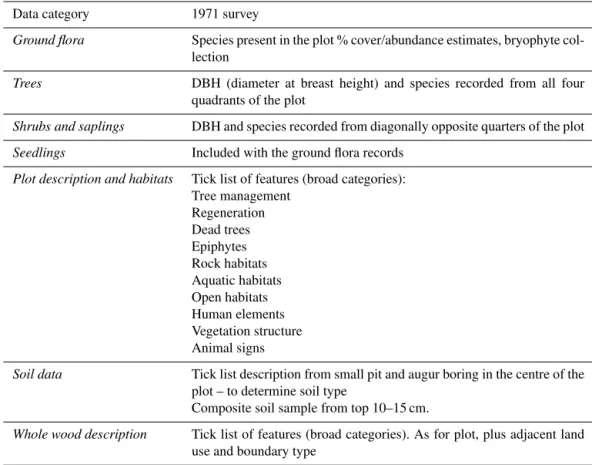
A range of data were collected within each of the surveyed pinewoods, as shown in Table 2, including ground flora records, tree information, shrubs and sapling information, seedling information, plot description and habitats, soil data and a whole wood description.
3.1 Site Information, plot locations and information, slope and aspect
Table 2.Summary of data collected.
Data category 1971 survey
Ground flora Species present in the plot % cover/abundance estimates, bryophyte
col-lection
Trees DBH (diameter at breast height) and species recorded from all four
quadrants of the plot
Shrubs and saplings DBH and species recorded from diagonally opposite quarters of the plot
Seedlings Included with the ground flora records
Plot description and habitats Tick list of features (broad categories):
Tree management Regeneration Dead trees Epiphytes Rock habitats Aquatic habitats Open habitats Human elements Vegetation structure Animal signs
Soil data Tick list description from small pit and augur boring in the centre of the
plot – to determine soil type
Composite soil sample from top 10–15 cm.
Whole wood description Tick list of features (broad categories). As for plot, plus adjacent land
use and boundary type
3.2 Vegetation data
Within the plot described in Fig. 2, the area within the first nest of the plot (2×2 m) was searched for the presence of all vascular plants (monocotyledons, dicotyledons and ferns), including tree species. This procedure was repeated for each nest of the quadrat, increasing the size each time as shown in Fig. 2. In the final nest (the whole 200 m2plot), the per-centage cover (to the nearest 5 %) of each species was es-timated. In addition, the total cover of bryophytes was esti-mated from the entire plot, as was an overall estimate for lit-ter, wood, rock, bare ground and standing water. Bryophytes and lichens were collected separately and specimens identi-fied later.
3.3 Soil data
Soil samples were taken from every accessible plot in every woodland. A single composite soil sample was taken from each plot, at the centre of the vegetation quadrat, using a trowel. Samples (weighing approximately 1 kg) were taken to a depth of 15 cm and placed in a labelled plastic bag. On return to the laboratory, all soil samples were stored at 4◦C
prior to processing and analyses. Soil samples were sieved using a 2 mm sieve. A pH reading was taken on a representa-tive fresh subsample from each soil sample before air-drying
Distance string position from centre - 1/2 diagonal: Q1 = 4m2 quadrat (2 x 2m) = 1.42m diagonal
Q2 = 25m2 (5.00 x 5.00m) = 3.54m
Q3 = 50m2 (7.07 x 7.07m) = 5.00m Q4 = 100m2 (10.00 x 10.00m) = 7.07m
Q5 = 200m2 (14.14 x 14.14m) = 10.00m
Not to scale Quarter No. 1 (NE)
Quarter No. 4 (NW)
Quarter No. 3 (SW)
Q2 Q3 Q4 Q5
Marker tags
Corner post
Quarter No. 2 (SE)
Centre post and right angle gauge
Q1
Figure 3.Plot construction.
at 20◦C. Unless otherwise stated, soil pH values in the data
set are from the soil samples prior to air-drying (“fresh”). All analyses were carried out under the supervision of the En-vironmental Chemistry Section at the Institute of Terrestrial Ecology, Merlewood, following standard methodologies and quality control procedures (Allen, 1989), including the anal-yses of certified standard reference samples within batches.
3.4 Tree diameter
Trees, saplings and shrubs were recorded in the 200 m2plot, as described above. Decisions as to whether individuals are in the plot or not were based on the rooted base being 50 % or more within the plot.
For trees (stems of more than 5 cm diameter at breast height (DBH) of any species normally capable of attaining a treelike habit in Britain), the species and DBH of all stems in the whole plot greater than 5 cm were measured. Trees with multiple stems had each stem recorded separately. Standing dead trees were also measured and identified as such.
Saplings (definition as for trees, but with a height of less than 130 cm and with a DBH less than 5 cm) were recorded only in quarters 1 and 3 of the plot (see Fig. 2). The same measurements as for trees were made. Shrubs, like saplings, were also only recorded in quarters 1 and 3, and again the same measurements were taken. Shrubs were defined as species including hazel and juniper.
3.5 Data quality
During the survey, all survey teams were initially accompa-nied by a supervisor and regular visits into the field were made by the project leader to ensure consistency and qual-ity in data recording according to criteria laid out in the field handbook (Shaw and Bunce, 1971).
The data sets were transferred from the original field sheets to spreadsheets in the 2000s. They were checked and corrected to produce a final validated copy. Standard val-idation checks included plot and site counts to ensure no duplicate numbering and hence double counting of plots; also, range checks were undertaken where possible for values falling within certain ranges, such as soil pH or slope values. In terms of the soil data, descriptive profile data were col-lected to the standards set out in the training and field hand-book, but they were not formally checked for quality aside from checks from supervisors during the survey. The soil pH was analysed using quality control measures as outlined in Allen (1989). These included the analyses of certified stan-dard reference samples within batches.
4 Summary of findings: vegetation and general habitats
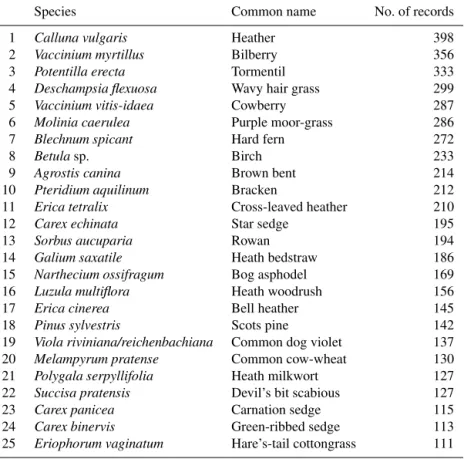
The ground flora vegetation gives a good indication of the state of the general environment, often more so than tree composition (Hill et al., 1975). In analysing the data, it is possible to focus on three levels: species level, plot level and site level. Overall, the dominant species found in the sur-vey, as shown in Table 3, are revealed to be heather ( Cal-luna vulgaris), bilberry (Vaccinium myrtillus), tormentil ( Po-tentilla erecta), wavy hair grass (Deschampsia flexuosa) and cowberry (Vaccinium vitis-idaea). Creeping lady’s tresses (Goodyera repens), a rare orchid only found in the Scottish pinewoods, was recorded 14 times.
The majority of the species recorded are not associated particularly with pinewoods. This indicates that the species composition, as expressed by the most frequent contribu-tors, reflects the open nature of the forests and the frequency of other habitats such as bog surfaces (Bunce, 1977). The species composition often relates to upland heath vegetation, which is mostly derived from former extensive forests. As the pinewoods have retreated, the heathlands have extended in the drier parts of Scotland. In the west, there is a similar re-lationship with peat-forming vegetation (Gimingham, 1977). The results can be compared to the results shown from the National Woodland Survey (Wood et al., 2015b; Kirby et al., 2005), as the same survey techniques were applied. Although virtually all the species recorded in the Native Pinewoods Survey were also found in the national survey, many were at low frequencies. However, many of the species in the national survey were absent from the pinewoods, reflecting the relatively limited range of variation within this habitat (Bunce, 1977).
Table 3.List of top 25 ground flora species recorded.
Species Common name No. of records
1 Calluna vulgaris Heather 398
2 Vaccinium myrtillus Bilberry 356
3 Potentilla erecta Tormentil 333
4 Deschampsia flexuosa Wavy hair grass 299
5 Vaccinium vitis-idaea Cowberry 287
6 Molinia caerulea Purple moor-grass 286
7 Blechnum spicant Hard fern 272
8 Betulasp. Birch 233
9 Agrostis canina Brown bent 214
10 Pteridium aquilinum Bracken 212
11 Erica tetralix Cross-leaved heather 210
12 Carex echinata Star sedge 195
13 Sorbus aucuparia Rowan 194
14 Galium saxatile Heath bedstraw 186
15 Narthecium ossifragum Bog asphodel 169
16 Luzula multiflora Heath woodrush 156
17 Erica cinerea Bell heather 145
18 Pinus sylvestris Scots pine 142
19 Viola riviniana/reichenbachiana Common dog violet 137
20 Melampyrum pratense Common cow-wheat 130
21 Polygala serpyllifolia Heath milkwort 127
22 Succisa pratensis Devil’s bit scabious 127
23 Carex panicea Carnation sedge 115
24 Carex binervis Green-ribbed sedge 113
25 Eriophorum vaginatum Hare’s-tail cottongrass 111
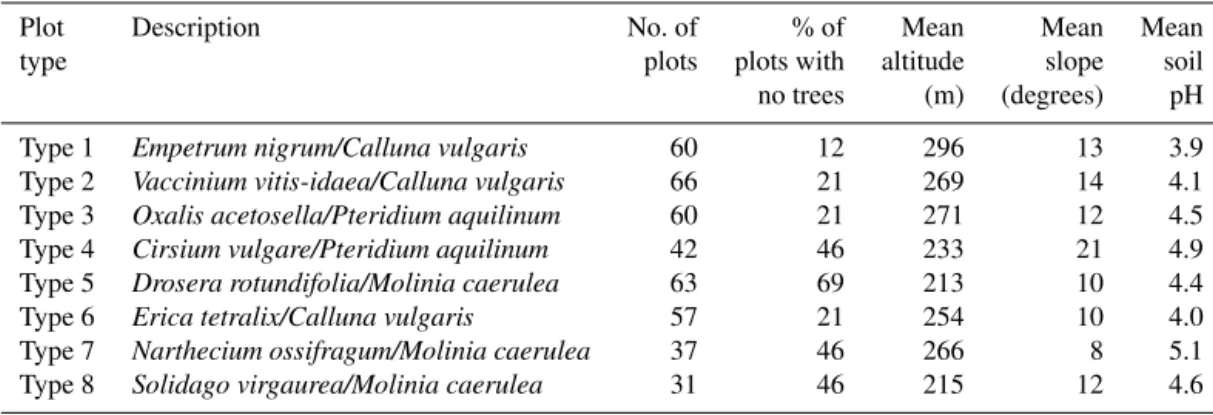
On a plot level, the design of the survey methods allows the vegetation to be classified into relatively homogenous groups. Using indicator species analysis (Hill et al., 1975), a key was able to be prepared, differentiating the major plot types. The full key may be viewed in Bunce (1977). In total, eight distinct plot types were differentiated (as summarised in Table 4). Each of the types shows variation in soil type and pH, slope and habitat types. In terms of comparison with previously recognised associations, plot type one is the least heterogeneous and can be recognised as approximately cor-responding with thePinetum Hylocomieto–Vaccinetum com-munity, identified by McVean and Ratcliffe (1962). This was described as characteristic of moderately dense pinewood throughout the Central and Northern Highlands. Tall shrubs are generally absent, and Goodyera repens is exclusive to this association. The total number of species is not high, with characteristic species includingPinus sylvestris,Calluna vul-garis,Vaccinium myrtillus,Vaccinium vitis-idaeaand Hylo-comium splendens.
The other seven identified plot types are harder to pare. McVean and Ratcliffe (1962) identified a second com-munity,Pinetum Vaccineto–Callunetum, characteristic of the more open forests, often with pine–birch mixtures and even pure birch woodland where this had colonised former pine ground. It differs from the first by being dominated by tall heather and Vaccinium myrtillus with deep sphagnum
tus-socks. This association encompasses a range of plot types, as identified in this 1971 survey.
A trend can be identified from the data in terms of en-vironmental correlations with the different plot types. The highest correlations were found to be with peat depth. Other significant correlations were with the depth of parent mate-rial, depth of podzolic horizon, slope and the depth of the mixed/mineral horizon. Other correlations are with soil pH and soil type.
As many practical conservation problems are found at a site scale, it is important to analyse the data at a site level. In analysing the site data overall, four distinct site types were identified, which correlate strongly with their geographi-cal distribution. These were classified as eastern, central, north western and south-western. Each type showed distinct ground flora composition, pine frequency, and age of trees (in terms of shrubs/sapling/trees) (Bunce, 1977).
Summary of findings: forest structure
oc-Table 4.Summary of plot types identified by indicator species analysis.
Plot Description No. of % of Mean Mean Mean
type plots plots with altitude slope soil
no trees (m) (degrees) pH
Type 1 Empetrum nigrum/Calluna vulgaris 60 12 296 13 3.9
Type 2 Vaccinium vitis-idaea/Calluna vulgaris 66 21 269 14 4.1
Type 3 Oxalis acetosella/Pteridium aquilinum 60 21 271 12 4.5
Type 4 Cirsium vulgare/Pteridium aquilinum 42 46 233 21 4.9
Type 5 Drosera rotundifolia/Molinia caerulea 63 69 213 10 4.4
Type 6 Erica tetralix/Calluna vulgaris 57 21 254 10 4.0
Type 7 Narthecium ossifragum/Molinia caerulea 37 46 266 8 5.1
Type 8 Solidago virgaurea/Molinia caerulea 31 46 215 12 4.6
cur largely as a consequence of the range of slopes and soil types on which the pines grow, ranging from freely drained thin podzol soils on steep rocky crags to wet peaty ground (Bain, 2013). Data from this survey provide information on the structure of the tree layer, including tree diameters at breast height and tree densities. Initial analysis of the forest structure data was undertaken by Goodier and Bunce (1977) and is summarised as follows.
The diameter distributions for trees in individual sites (Fig. 4) show that the forests consist of largely older trees with few younger specimens, as Steven and Carlisle (1959) indicated. Some forests, in particular Loch Maree and Aber-nethy have reasonable diameter distributions, whereas oth-ers, such as Ballochbuie and Mar, are skewed towards the older larger classes. Glen Moriston and Glengarry require particular comment. Much of the forest at these two sites has been planted withPicea sitchensisand the younger trees are regenerating in small gaps among the plantations, suggesting the effects of the removal of grazing.
The structure of the forests does not depend solely upon the diameter distribution of the trees but also on their height and on the other species present. The forests in the east tend to have taller and probably more vigorous trees, whereas those in the west contain more stunted trees because of the factors associated with the depth of peat on the sites. The proportion of birch also varies between sites, and this has a critical effect on the populations of birds and insects (Good-ier and Bunce, 1977).
5 The survey in context
The data from this survey are unique, as they provide a comprehensive, repeatable set of data giving information on many aspects of the pinewood ecosystem, and can be analysed in a statistically robust way. Information from sur-veys pertaining to the Scottish pinewoods predating this one tends to have been collected in a unrepeatable fashion or has not been as fully comprehensive in terms of the range of data collected (Smith, 1900; McVean and Ratcliffe, 1962; Steven and Carlisle, 1959). Subsequent surveys relating to
the pinewoods have been on a smaller, localised scale, fo-cused on specific sites (Mchaffie et al., 2002; Wilson and Puri, 2001; Vickers and Palmer, 2000) and are often focused on one particular aspect of the ecosystem, such as a par-ticular species (often not restricted to the pinewood habitat) (Wilkinson et al., 2002; Summers and Buckland, 2011), for-est structure (Mason et al., 2007; Summers et al., 1997) or regeneration (Scott et al., 2000; Baines et al., 1994; Palmer and Truscott, 2003). Some studies solely focus on areal ex-tent (Roberts et al., 1992; Cameron et al., 2000). Bain (1987) carried out a geographically comprehensive review of the ex-tent and condition of the native pinewoods, but this did not include information from vegetation or soil plots.
A major survey was carried out from 2006 to 2013 by the Forestry Commission Scotland, the Native Woodland Survey of Scotland (NWSS) (Patterson et al., 2014). Whilst this pro-vides a comprehensive view of the extent, structure and con-dition of the tree species, the survey did not include compre-hensive ground flora or soil assessments, limiting the assess-ment of the entire ecosystem. A repeat of the 1971 survey would enable assessment of changes within the woodlands to be made.
The results from this 1971 survey were presented at a sym-posium held in Aviemore, Scotland, in 1975, organised by the Institute of Terrestrial Ecology (Bunce and Jeffers, 1977). The conference raised awareness of the ecological value of the resource, and set the conservation agenda. By the end of the 1970s, 21 of the 35 Steven and Carlisle sites had been designated as sites of special scientific interest (Bain, 2013). In 1977, the Forestry Commission introduced a na-tive pinewood grant scheme, whereby landowners were given grants to restore native pinewoods. By the 1990s, over 80 % of the native pinewoods were within protected sites, putting an end to major losses from felling and non-native planting (Bain, 2013).
6 Methodology in context
Glentanar
Ballochbuie
Abernethy Mar
Glenmore Rothiemurchus
Glen Feshie
Black Wood of Rannoch
Glen Moriston
Glengarry
Barrisdale
Loch Arkaig and Glen Mallie
Ardgour
Glen Affric
Glen Strathfarrar Glen Cannich
Guisachan and Cougie
Achnashellach Coulin
Shieldaig
Loch Maree Amat
Black Mount
Glen Orchy
Tyndrum
Dulnan Old Wood of
Meggernie
Figure 4.Diameter distribution of trees within each pinewood site.
that stratified random samples were being used to obtain an integrated assessment of the response of vegetation to the environment across a defined population. The structure of the project provided the basis for the further development of strategic survey methods. The methods used in the sur-vey, originally described in Bunce and Shaw (1973), were intended to be comparable to the National Survey of Wood-lands, also taking place in 1971 (Kirby et al., 2005; Wood et
Variations of the method using the concept of a woodland site, and subsequently a 1 km square sampled at random, with random plots sampled within, have become a standard sam-pling strategy used very successfully in several other large ecological surveys in Britain, such as the Countryside Survey (Carey et al., 2008), and the Glastir Monitoring and Evalua-tion Programme (Emmett and GMEP team, 2014). Outwith Great Britain, methods adapted from the basic principles in this survey have been developed to roll out across the whole of Europe as part of the European Biodiversity Observation Network (EBONE) project (Bunce et al., 2008, 2011). The methods were widely tested across 12 European countries, and also Israel, Australia and South Africa. The methods were proven to be robust, reliable and repeatable at a con-tinental, landscape scale (Roche and Geijzendorffer, 2013).
A key aim of the sampling design was that the meth-ods chosen should be standardised, and therefore repeatable. For the purposes of sampling in woodland, a large quadrat is necessary, both in order to include a reasonable number of trees and, if the canopy is dense, to accommodate an adequate sample of the ground vegetation. The size of the plot was chosen with reference to continental phytosociol-ogists who at the time most widely used plots of between 100 and 200 m2(Bunce and Shaw, 1973). After preliminary field tests, it was found that the number of species recorded usually stabilised at this size. The area of 200 m2 was thus adopted for this survey. As the focus of the survey is on ground flora as well as tree and shrub information, the square plot with inner nests aids a systematic search of the vegeta-tion within the plot. It is also straightforward to layout in the field, and ensures a standard sized plot is laid out ev-ery time. For these reasons, the square plot was considered more advantageous than a circular plot. Plotless sampling was also dismissed, as it is not a suitable method for record-ing ground vegetation, only tree density. Random samplrecord-ing was preferred to systematic sampling in this case to avoid the possibility of resonance with environmental features, for ex-ample a map grid line following the course of a stream. Dis-persed random sampling also has practical advantages over systematic sampling, which requires continuous scale adjust-ment in order to obtain a constant sample from variable-sized areas (Bunce and Shaw, 1973). For the purposes of devising conservation policies, larger landscape units must be consid-ered. Accordingly, data from the 16 random plots may be used to assess the vegetation for whole sites.
In terms of the repeatability of the survey, statistical anal-yses of temporal vegetation change are clearly more power-ful when based on records from plots located in the same place rather than randomised to new locations for each sur-vey. Surveys using the Bunce and Shaw (1973) methodology have been proven to be effectively repeatable. The British Countryside Survey of 1990 aimed to repeat vegetation plots first recorded in 1978, using the same information as would be available for the pinewood plots (plot maps and descrip-tions). The locational accuracy of the plot locations in 1990 is
assessed in Prosser and Wallace (1992) and Barr et al. (1993). Overall, plots in this larger survey had a relocation rate of 87 %. Ideally, additional information such as plot photos and permanent plot markers would be introduced in a resurvey, as has been the case in the Countryside Survey to increase the repeatability.
Further analyses regarding plot repeatability were under-taken using data from the Woodland Survey of Great Britain, carried out in 1971 and again in 2001 and again using ex-actly the same Bunce and Shaw (1973) methodology as the Scottish Pinewoods Survey. In the repeat survey, the field surveyor relied only on the marked point on a map as the sole aid to relocating the 1971 plot location. It would be expected that, having made an effort to move near to the mapped point, the plot records from the repeat survey will, on average, be more similar to the respective 1971 plot record than if a completely new, random set of locations were cho-sen. Even if vegetation change occurs, species compositional data recorded from the same point at times 1 and 2 will tend to be more similar than data recorded from two random points at times 1 and 2. Whilst it is impossible to measure the amount of relocation error by exploiting a “true” set of temporal pairs (known to have been recorded in exactly the same position), it is possible to compare the average species compositional similarity between the ostensibly true tempo-ral pairs with the average similarity for a random pairing of the 1971 data with the 2001 data. If, on average, attempts to relocate the true 1971 position had been successful then the similarity between the true pairs should be greater than the random pairs. Overall, at 94 % of the woodland sites, mean similarity was greater between “relocated” plot pairs com-pared to random-pair comparison, and for 57 % of sites the difference was significantly greater. A full account of this is given in Appendix 3 of Kirby et al. (2005).
7 Conclusions
Data availability
The data sets (Bunce et al., 2015) have been assigned digital object identifiers and users of the data must reference the data as follows:
Bunce, R. G. H., Shaw, M. W., and Wood, C. M.: Habitat, vegetation, tree and soil data from Native Pinewoods in Scot-land, 1971, NERC Environmental Information Data Cen-tre, doi:10.5285/56a48373-771c-4d4a-8b5a-45ef496c6e55, 2015. (Bunce et al., 2015)
This can be downloaded from the CEH Environmental In-formation Platform (https://eip.ceh.ac.uk/) from the follow-ing link: doi:10/7xb.
The data are provided under the terms of the Open Government Licence (http://eidchub.ceh.ac.uk/ administration-folder/tools/ceh-standard-licence-texts/ ceh-open-government-licence/plain, http://www. nationalarchives.gov.uk/doc/open-government-licence/ version/3/).
The metadata are stored in the ISO 19115 (2003) schema (International Organization for Standardization, 2015) in the UK Gemini 2.1 profile (UK GEMINI, 2016).
Users of the data will find the following documents use-ful: Shaw and Bunce (1971) and Wood et al. (2015a) (both supplied as supporting documentation with the data sets).
Author contributions. Claire M. Wood prepared the manuscript with significant contributions from the co-author, and is the current database manager for the Land Use Research Group at CEH Lan-caster. Robert G. H. Bunce designed the experiment (along with M. W. Shaw) and managed the project in 1971.
Acknowledgements. The fieldwork for the survey was carried out by K. Wilson, M. J. Bottomly, R. H. Reid, K. H. Chorl-ton, M. E. Ball, M. W. Shaw and D. J. Taylor. C. Helliwell, J. Brocklebank, and C. Barr provided help in the laboratory. M. W. Shaw provided help with developing computing methods, and C. J. Hallam assisted with data entry. Thanks are due to the many owners who gave permission for the site visits and to Forestry Commission and Nature Conservancy staff who also provided helpful support during the survey in 1971. We thank the two referees, L. Iverson and B. Young, for their constructive comments which have improved the quality of the manuscript.
Edited by: F. Huettmann
References
Allen, S. E.: Chemical Analysis of Ecological Materials, 2nd Edn., Blackwell Scientific Publications, Oxford, 1989.
Bain, C.: Native Pinewoods in Scotland: A Review 1957–1987, Royal Society for the Protection of Birds, Edinburgh, 1987. Bain, C.: The Ancient Pinewoods of Scotland, Sandstone Press Ltd,
Dingwall, 2013.
Baines, D., Sage, R., and Baines, M.: The implications of red deer grazing to ground vegetation and invertebrate communi-ties of Scottish native pinewoods, J. Appl. Ecol., 31, 776–783, doi:10.2307/2404167, 1994.
Balfour, J.: Introduction to the symposium on Scottish native pinewoods, in: Native Pinewoods of Scotland, edited by: Bunce, R. G. H. and Jeffers, J. N. R., Institute of Terrestrial Ecology, Cambridge, 1977.
Barr, C. J., Bunce, R. G. H., Clarke, R. T., Fuller, R. M., Furse, M. T., Gillespie, M. K., Groom, G. B., Hallam, C. J., Hornung, M., Howard, D. C., and Ness, M. J.: Countryside Survey 1990: main report, Countryside 1990 Vol. 2, London: Department of the Environment, 1993.
Bennett, K.: The post-glacial history of Pinus sylvestris in the British Isles, Quaternary Sci. Rev., 3, 133–155, doi:10.1016/0277-3791(84)90016-7, 1984.
Bunce, R. G. H.: Native pinewood survey, in: Merlewood Research Station Report for 1970–72, The Nature Conservancy, Grange-over-Sands, 1973.
Bunce, R. G. H.: The range of variation within the pinewoods, in: Native pinewoods of Scotland, edited by: Bunce, R. G. H. and Jeffers, J. N. R., Institute of Terrestrial Ecology, Cambridge, 10– 25, 1977.
Bunce, R. G. H. and Jeffers, J. N. R.: Native pinewoods of Scotland, Institute of Terrestrial Ecology, Cambridge, 1977.
Bunce, R. G. H. and Shaw, M. W.: A standardised method for eco-logical survey, J. Environ. Manage., 1, 239–258, 1973.
Bunce, R. G. H. and Smith, R. S.: An ecological survey of Cumbria, Structure Plan Working Paper, 4, Cumbria County Council and Lake District Special Planning Board, Kendal, 1978.
Bunce, R. G. H., Metzger, M. J., Jongman, R. H. G., Brandt, J., de Blust, G., Elena-Rossello, R., Groom, G. B., Halada, L., Hofer, G., Howard, D. C., Kováˇr, P., Mücher, C. A., Padoa-Schioppa, E., Paelinx, D., Palo, A., Perez-Soba, M., Ramos, I. L., Roche, P., Skånes, H., and Wrbka, T.: A standardized procedure for surveil-lance and monitoring European habitats and provision of spatial data, Landsc. Ecol., 23, 11–25, doi:10.1007/s10980-007-9173-8, 2008.
Bunce, R. G. H., Bogers, M., and Roche, P.: Manual for habitat and vegetation surveillance and monitoring: temperate, mediter-ranean and desert biomes, Alterra, Wageningen, 2011.
Bunce, R. G. H., Shaw, M. W., and Wood, C. M.: Habitat, veg-etation, tree and soil data from Native Pinewoods in Scot-land, 1971, NERC Environmental Information Data Centre, doi:10.5285/56a48373-771c-4d4a-8b5a-45ef496c6e55, 2015. Cameron, A., Miller, D., Ramsay, F., Nikolaou, I., and Clarke, G.:
Temporal measurement of the loss of native pinewood in Scot-land through the analysis of orthorectified aerial photographs, J. Environ. Manage., 58, 33–43, doi:10.1006/jema.1999.0306, 2000.
Carey, P. D., Wallis, S., Chamberlain, P. M., Cooper, A., Em-mett, B. A., Maskell, L. C., McCann, T., Murphy, J., Norton, L. R., Reynolds, B., Scott, W. A., Simpson, I. C., Smart, S. M., and Ullyett, J. M.: Countryside Survey: UK Results from 2007, NERC/Centre for Ecology & Hydrology, Lancaster, 2008. Emmett, B. E. and GMEP team: Glastir Monitoring &
Gimingham, C.: The status of pinewoods in British ecosystems, Native Pinewoods of Scotland, Institute of Terrestrial Ecology, Cambridge, UK, 1–4, 1977.
Goodier, R. and Bunce, R. G. H.: The native pinewoods of Scot-land: the current state of the resource, in: Native pinewoods of Scotland, edited by: Bunce, R. G. H. and Jeffers, J. N. R., Insti-tute of Terrestrial Ecology, Cambridge, 78–87, 1977.
Hill, M. O., Bunce, R. G. H., and Shaw, M. W.: Indicator species analysis, a divisive polythetic method of classification, and its application to a survey of native pinewoods in Scotland, J. Ecol., 63, 597–613, doi:10.2307/2258738, 1975.
ISO 19115 (International Organization for Standardization): avail-able at: http://www.iso.org/iso/catalogue_detail.htm?csnumber= 26020 (last access: 12 October 2015), 2003.
JNCC: 91C0 Caledonian forest, available at: http://jncc.defra.gov. uk/ProtectedSites/SACselection/habitat.asp?FeatureIntCode= H91C0, last access: 2 November 2015.
Kirby, K. J., Smart, S. M., Black, H. I. J., Bunce, R. G. H., Cor-ney, P. M., and Smithers, R. J.: Long term ecological change in British woodland (1971–2001). A re-survey and analysis of change based on the 103 sites in the Nature Conservancy ‘Bunce 1971’ woodland survey. Final report, Peterborough: En-glish Nature (EnEn-glish Nature Research Reports Number 653),
139+appendices, 2005.
Lowe, V. P. W.: Pinewoods as habitats for mammals, in: Native Pinewoods of Scotland, Proceedings of Aviemore Symposium, Insititute of Terrestrial Ecology, Cambridge, 103–111, 1977. Mason, W., Connolly, T., Pommerening, A., and Edwards, C.:
Spa-tial structure of semi-natural and plantation stands of Scots pine
(Pinus sylvestrisL.) in northern Scotland, Forestry, 80, 567–586,
doi:10.1093/forestry/cpm038, 2007.
McHaffie, H., Legg, C. J., Worrell, R., Cowie, N., and Amphlett, A.: Scots pine growing on forested mires in Abernethy Forest, Strathspey, Scotland, Transactions and Proceedings of the Botan-ical Society of Edinburgh and BotanBotan-ical Society of Edinburgh Transactions, 54, 209–219, doi:10.1080/03746600208685038, 2002.
McVean, D. N. and Ratcliffe, D. A.: Plant communities of the Scot-tish Highlands. A study of ScotScot-tish mountain, moorland and for-est vegetation, Monographs of the Nature Conservancy, HMSO, London, 445 pp., 1962.
Met Office: available at: http://www.metoffice.gov.uk/, last access: 8 April 2016.
Milner, C.: Shetland project monitoring report Nature Conservancy Council, Grange over Sands, Contract Report to the Nature Con-servancy Council, Nature ConCon-servancy Council, Grange over Sands, 1975.
Newton, I. and Moss, D.: Breeding birds of Scottish pinewoods, in: Native pinewoods of Scotland, Institute of Terrestrial Ecology, Cambridge, 26–34, 1977.
Palmer, S. C. F. and Truscott, A.-M.: Browsing by deer on naturally regenerating Scots pine (Pinus sylvestrisL.) and its effects on sapling growth, Forest Ecology and Management, 182, 31–47, doi:10.1016/S0378-1127(03)00026-4, 2003.
Patterson, G., Nelson, D., Robertson, P., and Tullis, J.: Scotland’s Native Woodlands: Results from the Native Woodland Survey of Scotland, Forestry Commission, Edinburgh, 2014.
Peterken, G. F.: Natural woodland: ecology and conservation in northern temperate regions, Cambridge University Press, Cam-bridge, 1996.
Prosser, M. and Wallace, H.: Countryside Survey 1990 Quality As-surance Exercise. Report to Institute of Terrestrial Ecology, Mer-lewood Research Station, Canon Pyon, Herefordshire, 1992. Roberts, A., Russell, C., Walker, G., and Kirby, K.: Regional
varia-tion in the origin, extent and composivaria-tion of Scottish woodland, Transactions and Proceedings of the Botanical Society of Edin-burgh and Botanical Society of EdinEdin-burgh Transactions, 46, 167– 189, doi:10.1080/03746600508684786, 1992.
Roche, P. and Geijzendorffer, I.: EBONE: integrated figures of habi-tat and biodiversity indicators: quantifying indicators of an inte-grated biodiversity observation system, Alterra, Wageningen UR, 2013.
Romão, C.: Interpretation manual of European Union habitats, version EUR 28, available at: http://ec.europa.eu/environment/ nature/legislation/habitatsdirective/docs/Int_Manual_EU28.pdf (last access: 3 May 2016), 2013.
Scott, D., Welch, D., Thurlow, M., and Elston, D. A.: Regeneration of Pinus sylvestris in a natural pinewood in NE Scotland follow-ing reduction in grazfollow-ing by Cervus elaphus, Forest Ecol. Man-age., 130, 199–211, doi:10.1016/S0378-1127(99)00191-7, 2000. Scottish Government: Scottish Biodiversity List, available at:
http://www.gov.scot/Topics/Environment/Wildlife-Habitats/ 16118/Biodiversitylist/SBL, last access: 2 November 2015. Shaw, M. W. and Bunce, R. G. H.: National Woodlands
Classifi-cation 1971 Handbook of Field Methods, Merlewood Research Station, The Nature Conservancy, Grange-over-Sands, 1971. Smith, R.: Botanical survey of Scotland. II. North Perthshire
district, The Scottish Geographical Magazine, 16, 441–467, doi:10.1080/00369220008733178, 1900.
Smout, T. C.: The Pinewoods and human use, 1600–1900, Forestry, 79, 341–349, doi:10.1093/forestry/cpl021, 2006.
Steven, H. M. and Carlisle, A.: The native pinewoods of Scotland, Oliver & Boyd, Edinburgh, 1959.
Summers, R. W. and Buckland, S. T.: A first survey of the global population size and distribution of the Scottish Cross-bill Loxia scotica, Bird Conservation International, 21, 186–198, doi:10.1017/S0959270909990323, 2011.
Summers, R. W., Proctor, R., Raistrick, P., and Taylor, S.: The structure of Abernethy Forest, Strathspey, Scotland, Transac-tions and Proceedings of the Botanical Society of Edinburgh and Botanical Society of Edinburgh Transactions, 49, 39–55, doi:10.1080/03746609708684851, 1997.
UK GEMINI: available at: http://www.agi.org.uk/agi-group/ standards-committee/uk-gemini, last access: 3 May 2016. Vickers, A. and Palmer, S.: The influence of canopy cover and
other factors upon the regeneration of Scots pine and its asso-ciated ground flora within Glen Tanar National Nature Reserve, Forestry, 73, 37–49, doi:10.1093/forestry/73.1.37, 2000. Wilkinson, N. I., Langston, R. H., Gregory, R. D., Gibbons,
D. W., and Marquiss, M.: Capercaillie Tetrao urogallus abun-dance and habitat use in Scotland, in winter 1998–99: A second full survey in which we estimate the population at 1073 birds (95 % CL 549–2041), Bird Study, 49, 177–185, doi:10.1080/00063650209461263, 2002.
Global Ecol. Biogeogr., 10, 291–303, doi:10.1046/j.1466-822X.2001.00226.x, 2001.
Wood, C. M., Caffrey, D., and Bunce, R. G. H.: Dataset documen-tation – Scottish Pinewoods Survey 1971 (Native Pinewood Sur-vey), Centre for Ecology and Hydrology, Lancaster, 2015a.