A Work Project, presented as part of the requirements for the Award of a Master’s degree in
Finance from the NOVA – School of Business and Economics
SOUTHWEST AIRLINES CO.:
CONSISTENCY FOR THE FUTURE
DIOGO VALÉRIO MARTINS VALBOM 33891
RENATO SILVA DIAS
34085
A Project carried out under the supervision of:
Rosário André
Abstract
This Work Project consists of an Equity Research report of Southwest Airlines Co., forecasting
the future company’s performance. Currently, the company is one of the market leaders and has
a higher operating margin than the industry. However, the arising of low-cost and
ultra-low-cost airlines will increase the industry’s price pressure. Moreover, the company will face
operating costs management challenges in the future, mainly related to labor and fuel, which
will affect its operating margin, enhancing the company’s concerns regarding increasing
operational measures. Hence, it was issued a “Hold” recommendation, estimating a price target
of $58.76, as of December 2020.
Keywords: Operating Margin, ASM, Fuel, Labor
This work used infrastructure and resources funded by Fundação para a Ciência e a Tecnologia
(UID/ECO/00124/2013, UID/ECO/00124/2019 and Social Sciences DataLab, Project 22209),
POR Lisboa (LISBOA-01-0145-FEDER-007722 and Social Sciences DataLab, Project 22209)
and POR Norte (Social Sciences DataLab, Project 22209).
MASTER IN FINANCE
THIS REPORT WAS PREPARED EXCLUSIVELY FOR ACADEMIC PURPOSES BY DIOGO VALBOM AND RENATO DIAS,MASTER IN FINANCE STUDENTS OF THE NOVA SCHOOL OF BUSINESS AND ECONOMICS.THE REPORT WAS SUPERVISED BY A NOVA SBE FACULTY MEMBER, ACTING IN A MERE ACADEMIC CAPACITY, WHO REVIEWED THE VALUATION METHODOLOGY AND THE FINANCIAL MODEL. ▪ The price target FY20 is $58.76. With the dividends
distribution and shares repurchases, the expected total shareholder return, during 2020, will be nearly 7.14%. Therefore, the recommendation for Southwest Airlines Co. is HOLD.
▪ Southwest Airlines Co. has been carried by the momentum created by the consumption pattern of the airline industry. Low-cost carriers have been gaining more and more customers, increasing their market share from 16% in 2006 to 31% in 2018. ▪ Southwest Airlines Co.'s operating performance relies on a business model based on effective cost management, logistic efficiency and organizational culture, which allows the company to achieve higher operating margins than its peers.
▪ In the future, it is expected that the company’s revenues will continue to increase due to its steady expansion in Latin America and the cementing of its current U.S. market position. ▪ The arising of low-cost and ultra-low-cost carriers, the increasing competition through price, the rising fuel prices and the transformation of the labor market are the main challenges that will affect the company's ability to maintain high margins.
Company description
Founded in 1967, Southwest Airlines Co. is headquartered in Dallas, Texas and is considered one of the world's largest low-cost carriers.
The company has scheduled flights for 41 states in the United States of America and 10 other countries, operating over 4,000 flights per day.
S
OUTHWEST
A
IRLINES
C
O
.
C
OMPANY
R
EPORT
I
NDUSTRIALS
-
A
IRLINES
6
J
ANUARY2020
S
TUDENT
:
D
IOGO
V
ALBOM
–
R
ENATO
D
IAS
[email protected]
Consistency for the Future
The challenge of rising costs and competition
Recommendation: HOLD
Vs Previous Recommendation n.a.
Price Target FY20: 58.76 $
Vs Previous Price Target n.a.
Price (as of 2-Jan-2020) 54.84 $
Reuters: LUV.N
52-week range ($) 44.61-58.77 Market Cap (billions of $) 28.6 Outstanding Shares (millions) 526.27 Source: Bloomberg (02/01/2020)
(in millions of dollars, except share amount) 2018 2019E 2020F Revenues 21,965 22,679 23,418 EBITDA 4,407 4,094 4,003 EBITDA margin 20.06% 18.05% 17.09% Net Income 2,465 1,894 1,830 Net Margin 11.22% 8.35% 7.81% Operating ROIC 33.73% 29.67% 27.75% ROE 25.57% 19.22% 17.46% Source: Annual report and analysts’ estimates
Figure: 5-year cumulative weekly returns as of December 2019 (LUV and S&P500)
SOUTHWEST AIRLINES CO. COMPANY REPORT
Table of Contents
EXECUTIVE SUMMARY ... 3
COMPANY OVERVIEW ... 4
COMPANY DESCRIPTION ... 4 STOCK PERFORMANCE ... 4 SHAREHOLDER STRUCTURE ... 5Shares buybacks and dividends ... 6
OPERATING PERFORMANCE ... 6
MACROECONOMIC OUTLOOK ... 7
INDUSTRY OVERVIEW ... 7
THREAT OF NEW ENTRANTS ... 8
BARGAINING POWER OF BUYERS ... 8
THREAT OF SUBSTITUTE PRODUCTS OR SERVICES ... 9
BARGAINING POWER OF SUPPLIERS ... 9
COMPETITIVE RIVALRY ... 10
COMPETITIVE ANALYSIS ...10
LOW-COST VERSUS LEGACY CARRIERS ...12
BUSINESS RISKS ...15
FORECAST AND VALUATION ASSUMPTIONS ...16
KEY VALUE DRIVERS FORECAST ... 16
OVERALL FORECASTS ... 19
ROIC,RONIC,RR AND OTHER PERFORMANCE RATIOS ... 23
COST OF CAPITAL ... 24
VALUATION OUTPUTS ...25
MULTIPLES VALUATION ...26
SENSITIVITY AND SCENARIO ANALYSIS ...27
APPENDIXES ...28
SOUTHWEST AIRLINES CO. COMPANY REPORT
Executive summary
The airline industry is intrinsically affected by external shocks in terms of economic activity and fuel price. Nowadays, the good economic situation of the U.S. and the low regulatory constraints of the airline industry have led to increased competitiveness and the change of consumer consumption patterns, using more frequently airplanes to travel.
Although over 100 new airlines have entered this sector in the last 40 years and consumer switching costs are low, the industry is going through a consolidation period driven by M&A activity which has reduced market players and allowed it to be dominated by four major players (Southwest Airlines Co., American Airlines, Delta Air Lines and United Airlines). However, in the last few years, the rise of low-cost and ultra-low-cost airlines, such as JetBlue Airways or Spirit Airlines, has conquered consumers through low fares, increasing the price and margins pressure in the industry.
Southwest Airlines Co. positions itself as the only low-cost airline capable of competing directly with the three largest legacy carriers in the market, in terms of market share. Through its business model, which is based on effective cost management, logistics efficiency and organizational culture, Southwest Airlines Co.'s achieved one of the lowest CASMs in the industry, being the company with the highest operating margin in the industry (EBITDA margin of 20.06% in 2018, compared to a peer’s average of 13.20%).
Despite being expected that, in the future, the company's revenues will continue to increase due to its steady expansion in Latin America and the cementing of the U.S.'s market position, the competitive pressure will jeopardize Southwest Airlines Co.'s performance. The arising of low-cost and ultra-low-cost carriers, the competition through price, the rising fuel prices and the transformation of the labor market will cause Southwest Airlines Co.’s operating margin to converge to the average of the industry's largest airlines in the U.S., in the long-term.
It is estimated that the total shareholder's gains, which include dividends of $0.72 per share and gains of $3.61 per share due to share repurchases, will be $3.92 (7.14%) during 2020. This gain is computed comparing the share price yielded by the DCF valuation method and a price per share of $54.84 as of 2nd January
SOUTHWEST AIRLINES CO. COMPANY REPORT
Company overview
Company description
Initially called Air Southwest Co., Southwest Airlines Co. was founded on March 15, 1967, by Herb Kelleher and Rollin King and was headquartered in Dallas, Texas. After the lawsuits filed by three other airlines were revolved, the company started operating regularly in 1971 as an intrastate carrier in Texas, having scheduled flights between Dallas Love Field, Houston and San Antonio. The intent of these legal actions constituted by these Airlines was to "try to prevent the company from its planned strategy of undercutting their prices by flying only within Texas and thus being exempt from various regulations" 1.
Since its early days, the founders of the company had a clearly outlined vision and aimed at differentiating Southwest Airlines Co. from its competitors: "If you get your passengers to their destinations when they want to get there, on time, at the lowest possible fares, and make darn sure they have a good time doing it, people will fly your airline"2. Hence, during the '70s, the company's management
team always sought to fulfill the vision of its founders by executing operational measures that would increase cost optimization and, consequently, lower fares. The company presented pioneering measures such as a lower night fare, every-hour service or the establishment of permanent lower fares (e.g. $13 fare becomes permanent fare between DAL-SAT).
Based on a cost leadership strategy, Southwest Airlines Co. was able to increase the number of flights per day and shorten the turnaround time (i.e. the time required to prepare the flight). In 1975, the company expanded to more cities within Texas, in 1979 it expanded to other states in the Southern U.S. and in the '90s expanded to the rest of the country, especially to the East and Southeast. Currently, Southwest Airlines Co. has approximately 58,800 active full-time equivalent employees and operates about 4,000 flights per day during the busy season. The company has scheduled flights for 41 U.S. states and ten other countries (Aruba, Bahamas, Belize, Cayman Islands, Costa Rica, Cuba, Dominican Republic, Jamaica, Mexico and Turks and Caicos Islands), being the airline that carries the greatest number of passengers within the U.S.3.
Stock performance
According to Southwest Airlines Co.’s website, the company launched its Initial 1 Source: PopularTimelines, 2019 (https://populartimelines.com/timeline/Southwest-Airlines)
2 Source: Southwest Airlines Co., 2019 (https://www.southwest.com/html/about-southwest/index.html) 3 Source: Southwest Airlines, 2018 (Southwest Airlines Co’s Annual Report of 2018).
SOUTHWEST AIRLINES CO. COMPANY REPORT
Public Offering (IPO) in June 1971, for 650,000 stocks at nearly $11. As of November 17th, Southwest Airlines Co. has a stock price high record of $58.77 and a low of $44.61 over the last 52 weeks4. LUV is the stock ticker used in the
NYSE (New York Stock Exchange).
Southwest Airlines Co.’s share price has steadily increased over the last five years. As of September 2014, the share price was $29.26 risen to $52.14 five years later. During this period, the biggest drops in the share price were mainly due to changes in the fuel price (October 20185) or when the company reports
that it expects to have revenue drops (March 20186).
Shareholder structure
Currently, Southwest Airlines Co. is going through a stage of executive stability. Since 2008, Gary C. Kelly has served as Chairman of the Board of Directors and President of Southwest Airlines Co., replacing Herb Kelleher and Colleen Barrett, respectively.
As of December 2019, 84.06% of the 526,276,126 shares issued by Southwest Airlines Co. belong to institutional investors, with the remaining 15.94% belonging to, for instance, other mutual funds, insider ownership or the general public (Figure 1). Within the institutional investors (Figure 2), the greater equity participation belongs to Primecap Management Co. (13.87%), followed by Berkshire Hathaway Inc. (10.19%), State Street Corp. (7.54%), Vanguard Group In. (6.79%) and BlackRock Inc. (4.85%)7. The remaining 56.76% of shares
belong to other institutional investors with smaller stakes. According to the Fidelity website, Gary C. Kelly, Thomas M. Nealon (the president) and Tammy Romo share the portion of equity held by insider ownership8, which totals 0.4%.
Institutional ownership can improve corporate governance and performance by being stricter with management. However, there is a fundamental conflict between short-term gains and long-term sustainability as objectives for institutional investment. The short-term incentives can lead to underinvestment and exacerbate managerial myopia9. Moreover, institutional ownership can also
lead to higher stock volatility. Short-term trades performed by institutional investors can create signaling effects, as institutional investors are perceived has
4 Source: NYSE, 2019 (https://www.reuters.com/companies/LUV.N)
5 Source: TheMotleyFool, 2018 (https://www.fool.com/investing/2018/11/11/why-did-shares-of-southwest-airlines-co-drop-21-in.aspx) 6 Source: Financial Times, 2018 (https://www.ft.com/content/60fb1fac-68d5-11e8-b6eb-4acfcfb08c11)
7Source: NASDAQ, 2019 (https://www.nasdaq.com/symbol/luv/ownership-summary) 8Source: Fidelity, 2019
(https://eresearch.fidelity.com/eresearch/evaluate/fundamentals/ownership.jhtml?stockspage=ownership&symbols=luv)
9Source: Samuel, Cherian. 1996. The governance role of the Market
(http://documents.worldbank.org/curated/en/956491468739148596/110510322_20041117175524/additional/multi0page.pdf) Figure 2: Southwest Airlines Co. Shareholders
Structure (within Institutional Investors) Source: NASDAQ
Figure 1: Southwest Airlines Co. Shareholders Structure Source: NASDAQ
SOUTHWEST AIRLINES CO. COMPANY REPORT
well-informed investors10.
Shares buybacks and dividends
Lately, Southwest Airlines Co. has been doing a great endeavor to reward its investors mostly in two ways: dividends and share buybacks, amounting to $11 billion from 2010 to 2018, combined.
In 2018, due to the corporate tax reform, which decreased the corporate tax rate from 35% to 21%, Southwest Airlines Co. increased its cash holdings. The company’s CEO used this circumstance to increase dividends per share to $0.72 annually (which translates to an average 1.4% dividend yield) compared to $0.16 annualized five years ago. Also, the company’s executive board approved a new share buyback plan worth two billion dollars.
Share buybacks present themselves as a preferable option versus dividends regarding rewarding shareholders in the short term for three main reasons: it is not subject to the signaling effects of the reduction or interruption of dividend payment11, share buybacks are more flexible (the company can slow down or
even cancel the plan at any time) and are a better alternative to dividends in terms of tax policies since dividends are taxed twice. The first tax occurs on the income since dividends are paid out of the net income, then the government imposes a tax called “dividend distribution tax” which occurs at the distribution. Share buybacks are taxed only on the actual sale of shares, not having the investor to pay additional taxes. However, probably the shares will be negotiated at a premium12, as companies use these methods to incentivize the investors to
take part in the process and push the price upward.
Due to the new corporate tax reform and the impact of signaling effects in the market, it is expected that Southwest Airlines Co. will continue to return gains to its shareholders, using dividends as a way of doing so and not decreasing the optimal level of dividends.
Operating performance
Southwest Airlines Co. has increased its operating capacity in the last few years. Since 2012, Southwest Airlines Co. has increased its ASM (Available Seat Miles) by about 25% (Figure 3), which translated into 160 billion in 2018. This increase was partly supported by the capacity increase of the fleet. From 2012 until 2018, the company increased its average seat per trip from 135 to 150 seats (Figure 4).
10 Source: Gharbi et al.2015. Can Institutional investors typology influence firm’s risk (
https://www.cairn.info/revue-gestion-2000-2014-1-page-199.html)
11 Source: Bula, Laarni. 2010. To cut or not to cut a Dividend (http://people.brandeis.edu/~lbulan/divcuts.pdf)
12 Source: CFI, 2019. (https://corporatefinanceinstitute.com/resources/knowledge/finance/dividend-vs-share-buyback-repurchase/)
Figure 3: Southwest Airlines Co. – ASM (in billions)
Source: Annual Reports
Figure 4: Southwest Airlines Co. – Average seats per trip
SOUTHWEST AIRLINES CO. COMPANY REPORT
Moreover, Southwest Airlines Co. was able to maintain its load factor over 80% during this period, while its passenger revenue yield by RPM (Revenue Passenger Mile) decreased slightly (Figure 5).
Currently, Southwest Airlines Co. operates in two main business segments: Passenger and Cargo, which represented 93.1% and 0.8% of revenues at the end of 2018, respectively. While the first one is associated with the transportation of passengers, the second one is related to the transportation of air cargo. The company operates in the domestic market (U.S.) and Latin America in both segments. According to the company’s annual report, Southwest Airlines Co. also has another segment called Other Revenues, which comprises 6.1% of revenues in 2018. This segment concentrates revenues related to "marketing royalties associated with the Company's co-branded Chase® Visa credit card but also includes commissions and advertising associated with Southwest.com®"3. Southwest Airlines Co. provides a no-frills service. Also, unlike other low-cost airlines, the company does not provide on-board meals or other ancillary services, reinforcing the company's low-cost strategy. Hence, the company's ancillary revenues are almost entirely comprised of revenues from EarlyBird Check-In® and Upgraded Boarding (seat reservation).
Macroeconomic outlook
The Airline Deregulation Act (1978) removed the federal government control over areas such as fares, routes and the entrance of new competitors in this industry. This resulted in an increase of players in the airline sector, lower fares and more flights. The number of passengers increased from 207.5 million in 1978 to 1,011.5 million in 201813. Since 1978, the U.S.’s airline industry has been characterized by boom-to-bust cycles (Figure 6). This is assumed to be related to the capital intensive but cash poor, typical of the airline industry.
There is a great dependence between aviation metrics such as ASM, RPM and economic indicators like the GDP growth, as it will be addressed in the “Business risks” topic. Therefore, aviation demand is mainly affected by the state of the economy. The airline industry growth, regarding ASM and enplanements, over the next 20 years is expected to average 1.8% per year (Figure 7), driven by the U.S. economic growth.
Industry overview
13 Source: Bureau of transportation statistics, 2018 (
https://www.bts.dot.gov/newsroom/2018-traffic-data-us-airlines-and-foreign-airlines-us-flights)
Figure 5: Southwest Airlines Co. – Passenger revenue yield per RPM (in cents)
Source: Annual Reports
Figure 6: Pre-tax Profit Margin (%) Source: Bureau of economic analysis
Figure 7: Metrics Forecast
SOUTHWEST AIRLINES CO. COMPANY REPORT
Threat of new entrants
Potential new entrants to the marketplace represent a moderate threat in this industry. After the Airline Deregulation Act in 1978, many airlines entered the marketplace, with over 100 airlines being founded since then14. However, as can
be seen in Figure 8, the number of airlines has been decreasing steadily, via M&A, since 2008.
Due to its capital-intensive nature, the initial investments (fixed costs) are significant and barriers to entry and exit are high. Nonetheless, this impact is mitigated due to the availability of leasing options and financing from banks, investors and aircraft manufacturers15. For instance, Silver Airways, a recent
regional airline that was founded in 2011, was financed by Versa Capital Management, a private equity fund16, to start operations.
Another issue is the right to use airport slots which IATA distributes between airlines. Airlines that want to enter a new market are forced either to lease or buy slots from airlines. This represents a significant operational cost, varying according to the localization of the airport. For instance, American Airlines bought a pair of slots from Scandinavian Airlines for $60 million in 201517.
Bargaining power of buyers
Buyers have moderate power in the industry. As price is an important factor in this industry, low-cost airlines have a competitive advantage since a lot of airlines (regional and mainline) offer the same product. Hence, there is no differentiation and a low possibility for added value. Customers can switch from airline to airline without any cost and will more likely get better deals. Airlines try to avoid losing customers by creating loyalty programs, such as Rapid Rewards in the case of Southwest Airlines Co. or SkyMiles in the case of Delta Air Lines.
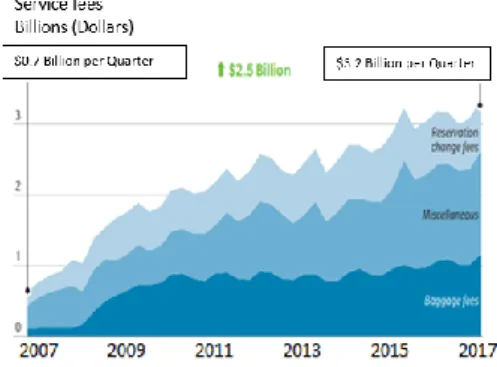
Due to websites that enable price comparison between airlines (such as Expedia, Kayak or Priceline), nowadays the customer has access to price transparency and can make more informed decisions. To cope with this, airlines introduced the concept of ancillary services. These are products and services that are sold to the passenger beyond the core transportation and can include bags, seats, priority boarding or insurance. Ancillary revenues have clear advantages to airlines and costumers. Firstly, airlines can give these products and services to their loyal customers for free, creating customer loyalty. Secondly, it is a good
14 Source: Wikipedia, 2019 (https://en.wikipedia.org/wiki/List_of_airlines_of_the_United_States)
15 Source: Marketrealist, 2014 (https://articles2.marketrealist.com/2014/12/low-entry-barriers-intensify-competition-airline-industry/) 16 Source: Silver Airways, 2019 (https://www.silverairways.com/about-silver/company-information)
17 Source: Simpleflying, 2019 (https://simpleflying.com/inside-airportslots/)
Figure 8: Number of air carriers in the US (2004 to 2019)
SOUTHWEST AIRLINES CO. COMPANY REPORT
way to get a higher yield per passenger without increasing ticket prices. Thirdly, these ancillary fares are not taken into consideration on websites that enable price comparison. Consequently, this type of revenue has been increasing as can be seen in Figure 9 and is expected to continue to be a trend in this industry.
Threat of substitute products or services
Substitute services are traveling options other than using airlines, such as by car, train or boats. Even though some of these methods of traveling have their benefits (such as comfort, convenience, and price), when it comes to traveling long distances, which tends to happen in the U.S., these options are lackluster. The U.S. does not have high-speed rails, such as countries like Japan (Shinkansen) and France (TGV-Train à Grande Vitesse), which tend to be a good alternative to air travel. There are talks about the possible construction of high-speed rails18, but it is not expected to be established in the foreseeable future.
Therefore, it does not represent a threat. In terms of security, airlines present themselves as the safest option. From 2014 to 2017 there were no fatalities in flights of the main U.S. air carriers19, boosting consumer trust.
Between 2003 and 2018, the number of passengers carried increased by about 33%20, demonstrating that Americans progressively choose more air
transportation as a long-haul mode of transport. Hence, the threat of substitute services to air travel seems to be low and unlikely.
Bargaining power of suppliers
The bargaining power of suppliers is relevant to the airline industry, mostly due to two important supplies: fuel and aircraft.
Regarding aircraft, Boeing and Airbus SE own 43% and 45%, respectively, of the global commercial airline industry by revenue21, demonstrating that the industry
of aircraft manufacturers is highly concentrated. All main airlines in the U.S. are supplied by one or both suppliers, being dependent on the aircraft that they build and provide. However, the relation between the manufacturer of commercial aircraft and airliners is one of co-dependency. Boeing and Airbus SE depend on long term contracts with the main airlines to be able to sustain the high investment and the continuous production of aircraft.
Regarding fuel and oil expenses, it remains one of the major operating costs. In
18 Source: Cnet, 2019 (https://www.cnet.com/news/is-high-speed-rail-in-the-us-ever-going-to-happen/) 19 Source: Bureau of Transportation Statistics, 2019 (https://www.bts.gov/content/transportation-fatalities-mode) 20 Source: Bureau of Transportation Statistics, 2019 (https://www.transtats.bts.gov/Data_Elements.aspx?Data=4) 21 Source: Forbes, 2019 (
https://www.forbes.com/sites/greatspeculations/2019/02/21/how-will-boeing-gain-market-share/#4ae598ed1e9b)
Figure 9: Ancillary revenues
Source: Airline economic analysis (2017 – 2018) - Oliver Wyman
SOUTHWEST AIRLINES CO. COMPANY REPORT
2017 this cost represented 18.8% and 21.5% of the total operating costs for legacy and low-cost airlines, respectively22. Airlines are continually improving
their efficiency through fleet modernization and other fuel initiatives. This resulted in an average increase in fuel efficiency of 1.5% per year, from 2009 to 201923.
Adding to the uncertainty concerning fuel prices, environmental laws regarding cargo ships usage of fuel with lower sulfur content – which is the same used by airlines - are being approved, which can push the demand and increase prices22.
Competitive rivalry
Competition within the airline industry is intense. There are no independent routes when it comes to the main airlines. Hence, every airline competes on every route with every other competitor. This means that revenues follow unit costs closely and revenue premiums are quickly competed away24 (Figure 10).
After the recession in 2009, airlines became cost driven. This led to improved margins by removing unprofitable routes and grounding older and less efficient aircraft (Figure 11). During this period, the U.S. airline industry went through a consolidation phase with three major mergers in five years. The new cost-driven mentality and the consolidation of the market resulted in 10 years of profitability for the U.S. airline industry. However, due to intensification in competition, margins have been lowering since 2015 (Figure 11).
Even though switching prices are low, competition is predominately done by companies that have been in the industry for decades. The four major airlines flew 80% of all domestic passengers as of 2018. Hence, it is likely that this oligopoly creates collusion among the largest airlines. The four companies previously mentioned were accused of setting prices, even though the demand for air travel was stagnant and operating costs, such as fuel, were declining25.
However, since 2014 yields have been decreasing as can be seen in Figure 12.
Competitive analysis
According to Statista (Figure 13), from October 2018 to September 2019 American Airlines, Delta Air Lines, Southwest Airlines Co. and United Airlines shared the leadership of this market, with 17.6%, 17.4%, 17.1% and 15% of market share, respectively. Alaska Air Group and the low-cost carriers JetBlue
22 Source: Oliver Wyman-Economic Report, 2018-2019 (
https://www.oliverwyman.com/content/dam/oliver-wyman/v2/publications/2019/apr/APRIL262019_Airline_Economic_Analysis_2018-2019vFweb.pdf)
23 Source: ICCT, 2019 (https://theicct.org/blog/staff/us-airlines-track-meet-one-carbon-goal-even-without-government-leadership) 24 Source: Mckinsey, (https://www.mckinsey.com/industries/travel-transport-and-logistics/our-insights/a-better-approach-to-airline-costs) 25 Source: Pro Market, 2018 (
https://promarket.org/colluding-plain-sight-study-finds-airlines-use-earnings-calls-coordinate-capacity-reductions/)
Figure 11: Capacity, GDP and Margin Source: Bureau of economics
Figure 10: RASK vs CASK Source: IATA
Figure 13: Market Share in Airlines Industry – North America (Oct 2018 to Sep 2019) Source: Statista
Figure 12: Passenger yield trend, domestic in cents 2012 -2018
Source: Airline Economy Analysis 2018-2019 (Oliver Wyman)
SOUTHWEST AIRLINES CO. COMPANY REPORT
Airways and Spirit Airlines have also registered a sales volume that allows them to position themselves as some of the largest airlines in North America, reaching market shares between 6.5% and 4%. Except for Spirit Airlines and JetBlue Airways, all these competitors also offer cargo services. Despite the different geographic positions of these key market players within the U.S., since Southwest Airlines Co. has many routes across the country it ends up facing intense competition from these airlines in those routes. Therefore, these airlines can be viewed as the main competitive peers of the company.
Regarding the operating activity of U.S. main airlines (Figure 14), it is noticeable that the three largest legacy carriers (Delta Air Lines, American Airlines Group and United Airlines) have significantly higher ASM and RPM than the competition. Southwest Airlines Co. was the most active low-cost carrier in 2018, with significantly higher ASM and RPM than Spirit Airlines or JetBlue Airways. Simultaneously, the operations' size of each of these peers is intrinsically linked to their market capitalization. As of December 2019, Southwest Airlines Co. and the U.S.'s three largest legacy carriers had market capitalizations between $12 billion and $38 billion (Figure 15).
Among the low-cost segment, it is noteworthy that Southwest Airlines Co., when compared to other ultra-low-cost and low-cost airlines such as Spirit Airlines or JetBlue Airways, has a bigger market share. In an industry highly concentrated among the major airlines, the emergence of low-cost carriers has allowed intensifying price and cost pressure. According to Statista (Figure 16), low-cost carriers have been gaining more and more customers, increasing their market share from 16% in 2006 to 31% in 2018. The competitive advantage that supports the flourishing market share that low-cost airlines have in this industry is the fact that these airlines practice a no-frills service, ending up charging an extra for other commodities such as seat selection and onboard meals. This evolution presents a favorable future context for Southwest Airlines Co. and may indicate that the company will continue to capture customers of legacy carriers.
Regarding load factor, Southwest Airlines Co. is within the industry average (83.5%) in 2018, recording a value of 83.4%. All the company's main competitors have load factors over 80%, with Delta Air Lines having a load factor of over 85% (Figure 17).
Concerning passenger revenue yield per RPM, Southwest Airlines Co. has registered an amount of 15.34 cents per RPM. This figure represents the company's pricing policies, since this value is higher than the two ultra-low-cost airlines (Spirit Airlines and JetBlue Airways) and lower than the three major legacy carriers (Delta Air Lines, American Airlines and United Airlines), being
Figure 16: Market share of low-cost carriers Source: Statista
Figure 17: Load factor by company Source: Annual Reports
Figure 14: Operating activity by ASM and RPM (in billions in 2018)
Source: Annual Reports
Figure 15: Market Capitalization (in millions $) Source: Bloomberg (December 2019)
SOUTHWEST AIRLINES CO. COMPANY REPORT
Alaska Air Group the outlier as it is not a low-cost airline (Figure 18).
For the past three years, Southwest Airlines Co. has kept its cost structure stable (Figure 19). Similar to other airlines in the sector, the company's main costs are related to salaries, wages, and benefits, and fuel and oil, which together account for about 70% of the company's operating costs in 2018. Contrary to other costs (such as landing fees or maintenance costs) that can be controlled by the company's operating efficiency, fuel and salaries are operating costs that are invariably affected by the state of the economy. Hence, these costs are the main challenge to the company's cost management due to its size and unpredictability. Compared to its peers, the company has one of the smallest CASMs in the market (Figure 20). In 2018, the company spent about 11.74 cents on operating expenses per ASM, only surpassed by Alaska Air Group (8.5 cents) and Spirit Airlines (8.14 cents), highlighting its main competitive advantage which allows the company to adopt a low-cost pricing policy. Consequently, Southwest Airlines Co. achieves a higher operating margin than its competitive peers (Figure 21). In 2018, the company achieved an EBITDA margin of 20.06%, which is higher than its peers' average by 7%, and a net margin of 11.22%.
Based on Southwest Airlines Co.'s competitive context, there can be identified some long-term industry trends. During the report, the impact of these trends in the company's key value drivers and costs forecast are quantified and it is assessed how they affect the company's valuation. These are:
1) Arising of low and ultra-low-cost carriers that can capture Southwest Airlines Co.’s customers and jeopardize the company's ability to capture revenues. 2) Passenger Yields evolving at a slower pace than inflation, putting pressure
on Southwest Airlines Co. operating margins.
3) Airlines seek to improve operational (e.g. load factors and average seats per trip) and activity (e.g. RPM and ASM) measures, increasing revenues mostly by quantity rather than price.
4) Growing pressures on operating costs that are affected by exogenous measures, such as labor and fuel costs, which are the biggest drivers of airlines' operating margin decrease in the last few years26.
Low-cost versus legacy carriers
The U.S.'s airline industry is composed of two different groups of airlines: low-cost and ultra-low-low-cost carriers (LCCs and ULCCs) and legacy carriers. While the
26Source: Reuters, 2019 (
https://www.reuters.com/article/us-airlines-wages-inflation-analysis/higher-wages-fuel-prices-turn-up-cost-pressure-on-airlines-idUSKCN1FY292)
Figure 19: Cost structure by year – Southwest Airlines Co.
Source: Annual Reports
Figure 21: LUV’s operating margins compared to the industry (2018) Source: Annual Reports
Figure 18: Passenger revenue yield per RPM by company (in cents)
Source: Annual Reports
Figure 20: CASM by company (in cents) Source: Annual Reports
SOUTHWEST AIRLINES CO. COMPANY REPORT
first group is characterized by having low fares, the second one usually provides a more premium service compared to the first one. To analyze the differences between both group's performances, two samples of four airlines are selected, which can be seen in Figure 22.
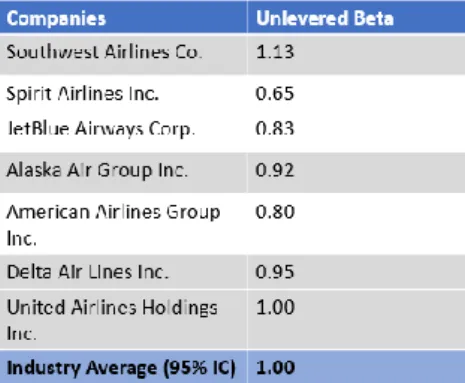
Regarding market volatility, it can be observed that both groups have similar levered betas (Figure 23). Moreover, the difference between the average betas of both groups (0.19) is due to the higher levered beta of American Airlines (1.61) as a result of its high level of indebtedness (241% of Net Debt / Market Cap as of January 2020). The median of both sample's betas reveals that the difference is about 0.1, concluding that there are no significant differences between samples. In terms of revenue growth, there is a clear winner. The LCCs and ULCCs have been able to grow in the last few years at a faster pace, increasing 8.76% from 2015 to 2018, compared to 5.65% of legacy carriers, leading to a significant increase in market share for the LCCs and ULCCs. It is also observable that, among LCCs and ULCCs, some smaller players such as Spirit Airlines (15.77%) and Allegiant Travel Company (9.72%) registered higher revenue growth, confirming the arising of these emerging market players. Both groups also register a difference between the average ROIC since the LCCs and ULCCs group had a higher ROIC in 2018 when compared to the legacy carriers (Figure 23). However, this difference was justified by the ROIC of Southwest Co. (28.7%), which is confirmed by a similar median between both samples (nearly 9%), showing that there is not a significant difference between both groups. Concerning operational margins, LCCs and ULCCs group present a higher EBITDA margin compared to legacy carriers (Figure 23). However, within the first group sample, there is a great discrepancy between constituents (e.g. Southwest Airlines Co. has 20.06% and JetBlue Airways has 10.17% of EBITDA margin), being arguable that the low-cost pricing strategy is not directly correlated with operational efficiency. Since 2015, both groups are decreasing their EBITDA margin, with LCCs and ULCCs airlines decreasing 11.63% and legacy carriers decreasing 9.23%, confirming the increasing cost pressure in this industry. The operational efficiency between groups can be related to the fleet age, as the LCCs and ULCCs present, on average, a younger fleet (Figure 23).
Hence, it is observable that, although both groups are quite similar, there are better and worse performers independently of the pricing strategy, showing that being low-cost is not a guarantee of success. Moreover, there are examples of low-cost airlines that went bankrupt, such as WOW Air or Primera Air. Hence, it is plausible to assume that, despite Southwest Airlines Co.'s pricing strategy being a pillar in its success, it is sustained by the company’s business model. In
Figure 22: Sample of Low-cost and ultra-low-cost carriers, and legacy carriers
Source: Equity Research Report
Figure 23: Comparison between Low-cost and ultra-low-cost carriers, and legacy carriers Source: Equity Research Report
SOUTHWEST AIRLINES CO. COMPANY REPORT
addition to the company's low-cost strategy, the business model that drives this operational efficiency hinges in three pillars:
1) Effective cost management: As aforementioned in the "Competitive analysis” topic, Southwest Airlines Co. is one of the most cost-efficient airlines in the U.S., having a lower CASM than the industry's average and the highest EBITDA margin among competitors. To operationalize cost efficiency, the company has been modernizing and using a single fleet type to obtain fuel efficiency, getting additional capacity per airplane and reducing costs with pilots training (decreasing the costs per ASM). Compared to its competitors, the company has one of the youngest fleets (11.8 years) comparing to legacy carriers (12.75 years of sample's average), only being surpassed by Spirit Airlines (6.6 years), JetBlue Airways (9.2 years) and Alaska Air Group (8.9 years). The company's cost efficiency is also leveraged by the usage of secondary airports, with landing fees and airport rentals decreasing from 7.9% of total operating costs in 2016, to 7.7% in 2018.
2) Logistics efficiency: Southwest Airlines Co. uses a point-to-point system (where it transports directly to a destination avoiding traffic, rather than going through a central hub) instead of a hub and spoke system (where the transport goes to a central hub where passengers change modes of transport to reach their destination). This strategy allowed the company to save cash on expensive hangar spots at mega hubs as well as, reducing delays and turnaround times, having short-haul flights in a profitable way. According to FlightStats27, in November 2019 the company registered an on-time arrival
ratio of 85.18% (84.32% of industry's average). Also, the company registered an average delay of 41 minutes, being the fourth-best placed airline in the U.S. behind Spirit Airlines, Delta Air Lines and Hawaiian Airlines. The company can also obtain a turnaround time significantly lower than one of its main competitors such as American Airlines (30 minutes and 45 to 90 minutes, respectively28).
3) Organizational culture: The company is committed to cultivating an engaging organizational culture among employees. On average, Southwest Airlines Co.’s registered an employee tenure period of 11.5 years29 which is higher
than the leisure and hospitality segment (2.5 years) and transportation segment (3 years)30. The company's large tenure period helps in saving
costs related to training. Also, nearly 87% of the company's employees
27 Source: FlightStats, 2019 (https://www.flightstats.com/v2)
28 Source: Azcentral, 2019 (
https://eu.azcentral.com/story/travel/airlines/2019/05/14/how-long-it-takes-to-get-a-plane-ready-between-flights-airplane-turnaround-time/1123694001/)
29 Source: Brunswick, 2019 (https://www.brunswickgroup.com/southwest-airlines-i6401) 30 Source: BLS, 2018 (https://www.bls.gov/news.release/pdf/tenure.pdf)
SOUTHWEST AIRLINES CO. COMPANY REPORT
belong to a Union31, contributing to the employee's satisfaction.
The Texas-based airline has established itself as the world pioneer in the low-cost airline industry, having a business model that competitors will try to replicate. Currently, there are LCCs and ULCCs, such as Spirit Airlines or JetBlue Airways, trying to implement a similar business model based on lower operating costs and high operational efficiency. Moreover, there are legacy carriers introducing fares classes below the economy (e.g. American Airlines), increasing the price pressure on the industry. However, due to having a larger and more expensive route network, higher debt commitments due to their size, and wanting to preserve their premium image, it is not expected that legacy carriers will be able to replicate this model. Also, legacy carriers have more overhead costs associated with their fleet (such as reclining seats or the space between seats), which makes it difficult to get a competitive cost per seat when compared to Southwest Airlines Co. (and others LCCs and ULCCs32). Instead of directly
competing with LCCs and ULCCs, some legacy carriers have tried to implement low-cost subsidiaries but most of them have failed33.
Even though the current operating performance place Southwest Airlines Co. in a comfortable position, LCCs and ULCCs and the rising cost of labor and fuel will harm the company's competitive performance, dismantling the established oligopoly and testing the sustainability of Southwest Airlines Co.'s competitive advantages. Later in this report, some of the company's revenues drivers and costs will be forecasted and tested through sensitivity analyses to understand the evolution of its operating margins.
Business risks
Such as any other company in any industry, Southwest Airlines Co. is subject to macroeconomic shocks that may affect its turnover and cost management, as well as jeopardize its current competitive position in this market.
One of the key determinants of airline industry performance is the state of the economy. According to IATA (International Air Transport Association)34, the
airline industry is particularly sensitive to changes in economic conditions, which requires them to often adapt their competitive strategies to the state of the economy. Although the equity betas associated with the major market players in this industry do not show high volatility, as it will be shown in "Cost of capital"
31 Source: Wired, 2019 (https://www.wired.com/2008/07/southwest-airlines-seven-secrets-for-success/)
32 Source: Aerotime, 2018 (https://www.aerotime.aero/rytis.beresnevicius/23006-5-reasons-low-cost-carriers-make-money)
33 Source: CAPA, 2009 (
https://centreforaviation.com/analysis/reports/how-the-legacy-full-service-airlines-have-responded-to-rising-lcc-competition-14504)
SOUTHWEST AIRLINES CO. COMPANY REPORT
topic, IATA has identified, over the past 20 years, a high degree of correlation between miles flown and economic growth (Figure 24). Moreover, Southwest Airlines Co. also highlights, in its annual report, the U.S.'s economic conditions as the main determinant for the company’s performance.
The second determinant identified by Southwest Airlines Co. as one of the biggest risk factors for the company's performance is fuel price. In fact, according to IATA, the correlation between economic growth and miles flown is only impaired when there is a large fluctuation in fuel price. At the end of 2018, fuel expenses represented about 25.7% of the company's operating costs, which represents a risk that could materially affect the company's operating result. To offset the effect of price fluctuations of this commodity on the company's financial performance, Southwest Airlines Co. uses fuel derivative instruments to hedge the short-term price volatility. However, this practice may not be able to offset large and long-term price fluctuations.
Labor relations can also be a key determinant of the financial performance of the company. The fact that Southwest Airlines Co. is part of a labor-intensive industry and that approximately 87% of its employees are represented by a labor union induces the company to be more careful when managing costs associated with its employees.
Later in this report, the influence of these three business risks is assessed and their impact on Southwest Airlines Co.’s share price is quantified through scenario and sensitivity analyses.
Forecast and valuation assumptions
Key value drivers forecast
Similarly, to other airlines in North America, Southwest Airlines Co. operates in different geographies and segments. To forecast the revenues of the company, they are split according to the operating segment (Passenger and Cargo) and geography (Latin America and Domestic). In 2018, the Passenger segment in North America was responsible for about 91% of revenues. To understand the evolution of the revenues of each operating segment of the company, the revenues are broken down by key value drivers that aim to demonstrate the link between the company's profitability and its key performance indicators.
Regarding the Passenger segment, revenues can be broken down into (Equation 1):
Figure 24: GDP growth vs RPK growth Source: IATA
SOUTHWEST AIRLINES CO. COMPANY REPORT
In the case of Cargo segment, the following equation is used to calculate its revenues (Equation 2):
It is expected of total miles flown to be a key value driver of Cargo segment revenues as Southwest Airlines Co. uses the commercial aircraft to deliver freight35.
The forecast of these key value drivers reflects the company's strategic positioning in the explicit horizon analyzed (from 2019 to 2024). Hence, the most important value drivers for forecasting the future profitability of the company are average seats per trip, miles flown, load factor, revenue passenger yield per RPM and cargo revenue yield per mile.
Regarding average seats per trip, Southwest Airlines Co. has the strategic goal of replacing the Boeing 737-700 (143 passengers) with the Boeing 737 MAX 8 (175 passengers) in the next few years. The Boeing 737 MAX 8 crisis led to an implementation delay throughout the year of 2019. However, the Boeing Max is expected to receive flying clearance by the FAA within the first quarter of 202036.
Hence, it is assumed that the trend of increasing average seats per trip will continue to be observable across the company's major competitors, as they all are already modernizing their fleets at a good pace. Therefore, it is assumed a 0.36% CAGR that reflects the FAA's (Federal Administration Aviation) forecast for the increase of seats per trip in the U.S. airline industry, during the explicit horizon37. As the company does not have flights between foreign destinations, it
is used the same forecast for Latin America, assuming that the fleet will be the same as the one used in the domestic market.
In a concentrated market such as the U.S.’s airline industry and having a matured position in the market, it is not expected that Southwest Airlines Co. will be able to increase its flown miles per year exponentially. Moreover, the company already has routes throughout all the North American territory, only inaugurating new destinations sporadically. Hence, it is expected that Southwest Airlines Co. will increase its miles flown, as a result of changing consumer consumption patterns, that is, at the pace of the industry itself. As such, a CAGR of 1.47% is used which is based on the FAA's forecast37 industry’s growth rate (in terms of miles flown), assuming Southwest Airlines Co.'s activity will continue to grow at the industry’s pace.
35 Source: SupplyChainDive, 2018 (
https://www.supplychaindive.com/news/southwest-airlines-cargo-expands-international-Mexico/528057/)
36 Source: Southwest Airlines Co., 2020 (https://www.southwest.com/html/air/737-MAX-8.html?clk=737MAX8_190408)
37 Source: Federal Aviation Administration, 2019 (
https://www.faa.gov/data_research/aviation/aerospace_forecasts/media/FY2019-39_FAA_Aerospace_Forecast.pdf?fbclid=IwAR37QVsmjVeS0extOEnzjtJc9KW7UixlkhJM9QyT1mYANLWWzKnKrJLq6ck)
SOUTHWEST AIRLINES CO. COMPANY REPORT
Although the company has already performed M&A activities (e.g. acquisition of AirTran in 2011), Southwest Airlines Co. focuses more on organically growing its operations. The company will likely continue its international expansion steadily, adding more international routes on an ongoing basis. Hence, it was computed a CAGR of 1.85% regarding the growth in miles flown in Latin America. This CAGR is based on the FAA’s forecasted growth rate for this region37, adding up the expected increase in miles flown due to the opening of new destinations which is expected to be consistent with the one planned between 2016 and 2020 in this region (average of 0.8 new destinations openings per year).
Regarding load factor, Southwest Airlines Co. has recorded a progressive increase in its load factor (80.3% in 2012 to 83.4% in 2018). Moreover, Southwest Airlines Co. has always recorded a ratio of over 80%, in line with the industry average, but not standing out in this measure of efficiency. The company has consistently evolved at the pace of the market, underlining the trend of maximizing efficiency measures in this industry. Hence, it is expected that, in the future, Southwest Airlines Co. will continue to evolve at the pace of the industry, being implausible an exponential growth of the load factor. To cope with it, the industry’s average load factor, provided by the FAA37, was used as a proxy for
the load factor growth of Southwest Airlines Co., computing a CAGR of 0.1% in the explicit horizon. In Latin America, the company has been experiencing many fluctuations in its load factor, registering successive increases and decreases. With more penetration in this market, Southwest Airlines Co.'s load factor is expected to stabilize and be consistent with the market where the company is inserted. Hence, it was computed a CAGR of -0.09% in the explicit horizon, which accounts for the convergence of Southwest Airlines Co.'s load factor in Latin America with the industry's average (provided by the FAA).
Despite having a low-cost pricing strategy, Southwest Airlines Co. recorded increases in its passenger revenue yield per RPM between 2012 and 2014 (15.64 cents to 16.34 cents) and between 2016 and 2018 (15.28 cents to 15.34 cents), reporting a decrease between 2015 and 2016 which was justified by the change in accounting methodology. However, according to FAA forecasts, although passenger revenue yield per RPM increases in nominal terms, it will decrease in real terms in the explicit horizon. Also, it is expected that the company will not radically change its pricing policy, registering a nominal increase in its yield in the explicit horizon, in line with what happened in the historical period. Therefore, a revenue passenger yield per RPM CAGR of 1.16% and 1.17% in the explicit horizon, for the domestic and international markets, respectively, are computed based on the FAA's yield real growth forecast37
SOUTHWEST AIRLINES CO. COMPANY REPORT
adjusted for inflation to convert it to nominal terms. According to a study named World Air Cargo Forecast by Boeing38, the real freight yields are also expected to
decrease as more efficient airplanes enter the market and competition increases. Therefore, it is predicted that the cargo revenue yield per mile CAGR will be a proportion of U.S. inflation (1.6% for both regions), due to the lack of recent forecasts for the explicit horizon in this segment.
It should be noted that the key-value driver's CAGRs mentioned earlier are relative to the normal state of the economy. Estimates regarding other scenarios will be addressed in the individual analyses.
Other Revenues segment is mainly related to website visits and the increase of flights booked over the internet. As both elements are intrinsically related to passenger revenues, it is expectable that this revenue segment will continue to grow according to the Passenger segment.
It is expected that in 2024 (the end of the explicit horizon) the revenues of the company will reach the $26.6 billion level, from which 93.1% are in the Passenger segment, 0.8% in the Cargo segment and the remaining 6.1% respectful to Other Revenues segment. After the explicit horizon, the revenues' growth rate will behave according to the U.S. and Latin America economy’s growth. It is noticeable that passenger revenues' in North America will continue to be quite prominent in the company's revenues.
Overall forecasts
Currently, Southwest Airlines Co. has higher operating margins than its competitors. However, it is expectable that, due to high competition in this industry, the company’s margin will decrease and converge to its peers’ margin. Hence, the overall forecasts of the major BS (Balance Sheet) and IS (Income Statement) captions reflect the deterioration of profitability margins.
Regarding the salaries, wages, and benefits costs, the contractual wage rate has been increasing, leading to higher salaries expenses in 2018. The airline industry is going through a pilot shortage. Hence, pilots have seen their salaries and premiums increase39. Therefore, it is foreseeable for an increase in the average
wages and salaries of flight-related personnel in the future, which should be higher than the historically verified, leading to a CAGR of 3.61% in the explicit horizon. This growth rate is aligned with recent wage increases in some of the
38 Source: Boeing, 2018 (https://www.boeing.com/commercial/market/cargo-forecast/)
39 Source: Forbes, 2018 (
SOUTHWEST AIRLINES CO. COMPANY REPORT
largest players in the industry such as Delta Air Lines (4%40) and Southwest
Airlines Co. itself (3%41). The salaries expenses of non-flight related employees
are foreseen to grow but to a slower pace (1.7%), being this growth consistent with the historically verified. Southwest Airlines Co. was able to reduce the number of flight-related employees per ASM in the last few years, increasing it in 2017 and 2018. However, it is expected that Southwest Airlines Co. will increase this number, converging with the industry’s average of employees per ASM in the long-term. Consequently, the estimated flight-related employees are 61,456 as of 2031. The weight of flight-related to non-flight related has been kept stable since 2013. Therefore, it is assumed to remain stable, leading to 12,594 non-flight related employees as of 2031.
Regarding fuel costs, it was directly computed the post-hedge cost, assuming that fuel hedging expenses in the future will have a similar weight to the historically verified - close to 5% - in relation to pre-hedge fuel expenses. Hence, post-hedge fuel costs are calculated according to the fuel prices and consumption forecast. FAA expects the price of fuel and oil to increase steadily in the foreseeable future, at a CAGR of 1.89% and 3.57% in the explicit horizon (2019–2024) and in the second stage (2025-2029), respectively37. The fuel
consumption is dependent on the miles flown and the gallons consumed per mile. Nowadays aircraft are being gradually optimized to reduce this consumption. However, in the historical period, Southwest Airlines Co. presented a very fluctuating consumption per thousand miles (Figure 25). Therefore, it is assumed an average of the historical period. It is important to note that maintaining fuel consumption per thousand miles constant while increasing the number of available seats results in an increase in the available seat miles per fuel of gallon consumed. This increase in efficiency per seat is in line with the previously observed increase in Southwest Airlines Co. (ASM per fuel gallon consumed of 72.8 in 2014 and 76.3 in 20183).
Concerning maintenance costs, Southwest Airlines Co. had increased costs in the first two quarters of 2019 due to the recent groundings of the Boeing Max. However, it is forecasted that, in perpetuity, these costs will converge with the peers’ costs due to the perspective of switching strategies from only having one type of aircraft and the modernization of aircraft, a trend that is common to the industry. Hence, it is assumed that the cost per ASM of Southwest Airlines Co. will converge with its peers in the long-term (0.78 cents per ASM), leading to a
40 Source: The Business Journals, 2019 (https://www.bizjournals.com/atlanta/news/2019/09/04/delta-to-give-4-raise-to-employees.html) 41 Source: Travel Pulse, 2019 (
https://www.travelpulse.com/news/airlines/southwest-airlines-to-offer-mechanics-20-percent-pay-increase.html)
Figure 25: Gallons consumed per thousand miles – Southwest Airlines Co.
SOUTHWEST AIRLINES CO. COMPANY REPORT
CAGR of -1.08% in the explicit horizon.
The costs associated with landing fees and airport rentals are intrinsically associated with the company's operations. In the historical period (2012 to 2018) these costs remained very constant per ASM, oscillating between 0.81 and 0.85 cents per ASM. As the company will maintain a short-haul flight strategy and will continue to operate at secondary airports, it is not expected that the cost per ASM to change significantly. Hence, it is used the average cost per ASM observed in the historical period (0.84 cents per ASM) as a cost driver for the forecasted period.
Such as the procedure elaborated concerning fuel costs, it was also directly computed the post-hedge interest costs. Interest expense is assumed to be a percentage of the previous year’s debt. The cost of debt used was the one computed in the WACC calculation (2.86%), which will be addressed in the "Cost of capital" topic.
Regarding employee contribution plans expenses, Southwest Airlines Co. states in its annual report that contribution plans are primarily based on employee compensation and on the company's performance. Therefore, “Salaries, Wages and Benefits” caption is used as a cost-driver to associate this caption with increases in employee expenses arising from the course of the operations. This caption comprises almost all non-operating expenses.
PP&E (Property, plant, and equipment) represents most of the operating invested capital, being the key factor in the activity and success of the company. The PP&E contains flight equipment owned, ground property and equipment, assets constructed for others and deposits on flight equipment purchase contracts. These captions are calculated separately for the explicit horizon, during which, there is information available regarding the future Capex commitments provided by the company in its annual report.
Concerning deposits on flight equipment purchase contracts, future Capex commitments in Flight Equipment owned are used as a cost driver. This cost driver was chosen since Southwest Airlines Co. has kept the deposits on flight equipment stable, in relation to the Capex of flight equipment, throughout the past. This trend is observed within a period of five years, being aligned with the fact that Southwest Airlines Co. provides the future Capex commitments until 2024 and the period from order date to the delivery date of Boeing Co. is on average four to five years. After 2024 is assumed a constant percentage of PP&E net, due to lack of information regarding future orders.
After the explicit horizon, the PP&E caption (which comprises flight equipment, ground property and equipment, assets constructed for others, and deposits on
SOUTHWEST AIRLINES CO. COMPANY REPORT
flight equipment) is projected based on the calculation of the annual Capex, net of depreciation. For this calculation, it is observed the annual historical investment of Southwest Airlines Co. in PP&E, which was, on average, 6.44% of previous year PP&E, net. To compute the perpetuity, the PP&E was calculated as a percentage of revenues after 2029.
Southwest Airlines Co. leases a part of its fleet. Airlines resort to this option to avoid the financial burden of buying airplanes. Both operational and financial leases net amounts are forecasted based on the future Capex commitments presented in the annual report of Southwest Airlines Co., during the explicit horizon. Also, airlines choose to lease aircraft to increase capacity temporarily. Therefore, after the explicit horizon, is assumed that the level of the net values will reflect the level of revenues. In this sense, revenues are used as a proxy for the level of activity, assuming that, if the level of activity increases, the number of airplanes leased will also increase as the company will need quickly adapt its capacity to demand. Concerning leases accounting recording, Southwest Airlines Co. must present these values in the balance sheet, both in assets and liabilities wise, according to the recent IFRS 1642. This change can impact the valuation in
the sense that assets and financial liabilities will increase. Moreover, the EBITDA will also increase, as the costs associated with leases under IFRS 16 are interest costs and depreciation, while before were operating leases expenses. This is expected to increase the Operating Free Cash Flow and, consequently, the valuation. Also, this change in financial policy will increase Net Debt to Equity, increasing the target capital structure ratio of the company (and the industry) and lowering WACC. Hence, it is arguable that these two effects can lead to a higher EV (Enterprise Value). However, this increase can be offset by the increase in the net present value of Net Debt, which can lead to a similar Equity Value, varying on case by case basis.
Regarding the goodwill, it is forecasted that it will remain constant since it is not expected for Southwest Airlines Co. to rely on M&A activities to expand. Concerning the remaining intangible assets, such as domestic slots or gate leasehold rights, this is computed based on the estimated amortization values provided by Southwest Airlines Co. in its annual report, until 2024. After 2024, a turnover ratio is used to associate intangible assets with revenues. This approach is considered suitable because, in this industry, intangible assets are directly related to the operating activity and the turnover ratio of the company was quite stable in the historical period (between 2012 and 2018 this ratio oscillated between nearly 14 and 16). Hence, it is forecasted that this ratio will converge to
SOUTHWEST AIRLINES CO. COMPANY REPORT
the average of the largest U.S. carriers (14.49), in the long-term.
Concerning the profit-sharing and saving plans, Southwest Airlines Co. states in its annual report that it contributes a percentage of its eligible pre-tax profits on an annual basis to profit-sharing plans. Therefore, is assumed that the pre-tax result is a good proxy for the evolution of this caption since this is a performance-based benefit plan.
Regarding short and long-term investments, it is expected Southwest Airlines Co. to maintain this financial buffer, generating a return and lowering the net cost of debt. From 2014 to 2018, this caption has been kept stable, fluctuating from 9.9% to 8.2% as a percentage of revenues throughout the period. Hence, it is expected that Southwest Airlines Co. will maintain this caption stable with revenues since it is expected that the company will invest more if it can generate more money through its operations.
ROIC, RONIC, RR and other performance ratios
Cost structures and operating margins change over time. Hence, the strategy used by Southwest Airlines Co. in the past to achieve this high operating margin may not be fruitful in the future. In a competitive industry, it is not feasible to maintain higher margins than its peers. In 2031 it is expected the EBITDA margin to be nearly 12%, compared to 20.06% in 2018. This is aligned with the biggest airlines in this industry, such as American Airlines and United Airlines which, in 2018, registered the lowest operating margins among the analyzed peers (10% and 13.4% of EBITDA margin, respectively) and also with the average of the analyzed peers (EBITDA margin of 13.2% in 2018). In contrast, other airlines were able to achieve a significantly higher EBITDA margin, such as Delta Air Lines (17.1%) or Spirit Airlines (15.9%). Regarding the Net Debt to Book Equity Ratio (excluding operating leases), it is forecasted a change in its capital structure from -6% in 2018 to 18% in 2031. This change in capital structure is convergent with the industry, although they still have a low level of indebtedness (Figure 26).Concerning the profitability of investment ratios, Southwest Airlines Co.’s presented high levels of operating ROIC (Return on Invest Capital) during the past period. In an industry that is competitive and without regulatory restraints, this high return level will entice competition via new entrants and reduction of margins by existing players. This will result in lower levels of RONIC (Return on New Invested Capital) over time, resulting in an overall lower ROIC. In the case of Southwest Airlines Co., it is observable that the operating ROIC is gradually converging to the WACC (Weight Average Cost of Capital), decreasing from 30% to 13% from 2019 to 2031. It is expected that, in the long-term, these values will
Figure 26: Net Debt/Equity ratio (exc. Leasings) as of December of 2018