THIS REPORT WAS PREPARED BY CATARINA CASTRO, A MASTERS IN FINANCE STUDENT OF THE NOVA SCHOOL OF BUSINESS AND
ECONOMICS, EXCLUSIVELY FOR ACADEMIC PURPOSES.THIS REPORT WAS SUPERVISED BY ROSÁRIO ANDRÉ WHO REVIEWED THE VALUATION METHODOLOGY AND THE FINANCIAL MODEL. (SEE DISCLOSURES AND DISCLAIMERS AT END OF DOCUMENT)
See more information at WWW.NOVASBE.PT Page 1/31
M
ASTERS IN
F
INANCE
E
QUITY
R
ESEARCH
With legacy carriers dominating the airlines industry, low-cost carriers have become important players within the market, getting from the top 20 in terms of market share based on RPM in the U.S. to the top 10 under the same metric during the past 10 years, due to both more cost-conscious customers and major inefficiencies of flag carriers, characterized by rigid high-cost structures, working practices imposed by staff unions and high turnaround times. Cost reductions, mainly through the decline of energy prices, an industry consolidation that created a market dominated by few companies and the highlight on ancillary revenues have been enabling low-cost carriers to sustain profit margins.
Being a pioneer in the low-cost segment, and boosted by the recent deregulation of the industry and the consequent flexibility to freely travel across the U.S., Southwest Airlines Co. has been able to establish itself as a key competitor in the industry, standing up as the largest american carrier regarding the number of emplaned domestic passengers and operating the largest fleet of Boeing aircraft in the entire world.
With operations starting in 1971, Southwest Airlines Co. had in 2015 its 43rd consecutive year of profitability, flying to 97
destinations across 40 states as well as to 11 destinations across 7 near-international countries, operating 704 Boeing 737 aircraft and carrying a total of 118 million passengers. The company plans to strengthen its fleet to 868 aircraft by 2025, increasing capacity and modernizing the airplanes in order to meet the average 2% forecasted increase in demand.
S
OUTHWEST
A
IRLINES
C
O
.
C
OMPANY
R
EPORT
A
IRLINES
I
NDUSTRY
5
JANUARY
2017
S
TUDENT
:
C
ATARINA
C
ASTRO
[email protected]
Low-Cost Carriers – A Case of
Success
Southwest Airlines Co.
Recommendation: BUY
Vs Previous Recommendation -
Price Target FY17: $ 62.83
Vs Previous Price Target -
Price (as of 6-Jan-17) $ 51.23
52-week range ($) 33.96 - 51.31
Market Cap ($M) 31,534
Outstanding Shares (M) 615,6
Source: Thomson Reuters (as of 5-Jan-2017)
Source: Thomson Reuters
(Values in € millions) FY 2016 F
FY 2017 F
FY 2018 F
Revenues 19,028 20,245 21,541
EBITDA 3,123 3,183 3,346
EBITDA Margin (%) 16.4% 15.7% 15.5%
Net Income 1,342 1,366 1,353
EPS ($) 2.2 2.1 2.1
Net Debt 6,304 6,826 7,184
Net Debt/EBITDA 2.0x 2.2x 2.2x
P/E 29.0x 29.3x 31.2x
ROE 17.4% 15.4% 14.5%
ROA 6.3% 5.9% 5.4%
Source: Individual Analysis
23% 112%
51%
dez-13 jun-14 dez-14 jun-15 dez-15 jun-16 dez-16
3-year cumulative monthly returns: LUV US, S&P 500 and NYSE ARCA Airlines
SOUTHWEST AIRLINES CO. COMPANY REPORT
PAGE 2/31
Table of Contents
EXECUTIVE SUMMARY ... 3
AIRLINES INDUSTRY: PAST, PRESENT AND FUTURE ... 4
(DE) REGULATION ... 4
MACROECONOMIC ENVIRONMENT ... 5
TRENDS ... 6
SOUTHWEST AIRLINES CO.: AN OVERVIEW ... 8
SHAREHOLDER STRUCTURE ... 9
STRATEGIC POSITIONING ... 9
RISKS AND CONTINGENCIES ... 13
SOUTHWEST AIRLINES CO.: KEY VALUE DRIVERS ...15
DEMAND: AIR TRAFFIC ... 15
SUPPLY: CAPACITY AND CAPITAL EXPENDITURES ... 16
VALUATION ...17
OVERALL FORECASTS ... 17
CAPITAL STRUCTURE ... 21
COST OF CAPITAL ... 23
TERMINAL VALUE ... 25
EQUITY VALUE ... 26
SENSITIVITY ANALYSIS ... 27
FINANCIALS AND KEY PERFORMANCE INDICATORS ...29
SOUTHWEST AIRLINES CO. COMPANY REPORT
PAGE 3/31
Executive Summary
The aviation industry changed from a highly regulated and restricted sector to a free market in which companies are able to determine operating strategies. Highly influenced by macroeconomic factors, the sector is currently facing a time of growth in demand led by favourable economic conditions.
Through several mergers and acquisitions in the last years, the industry is highly consolidated, constituting an oligopolistic market dominated by only four companies, including Southwest Airlines Co.. The trend is for profitability to keep growing, with increased forecasted demand and capacity.
With a market share of about 18% as of December 2015, Southwest Airlines Co. is the only leading U.S. airline with a low-cost business model. Its
point-to-point service and cost structure are what better differentiates it from
competitors, being able to take advantage of reduced turnarounds and passenger travel times and more frequent flights.
The company is completely modernizing its fleet, with a total of 293 airplanes predicted to be bought until 2025, acting to increase the fleet by 164 new and more efficient equipment.
With lower CASM, both pre and after fuel expenses, than its main competitors, it is able to provide very similar services at considerably lower fares, accomplishing its primary goal of filling in the airplanes as much as possible, even if charging lower ticket prices.
The company’s overall activity is expected to expand due to an increased demand and accompanying supply. With a capital structure characterized by a high percentage of operating leases, Southwest Airlines Co. is expected to maintain very low net debt to EBITDA ratios, highlighting its capacity to face future financial obligations.
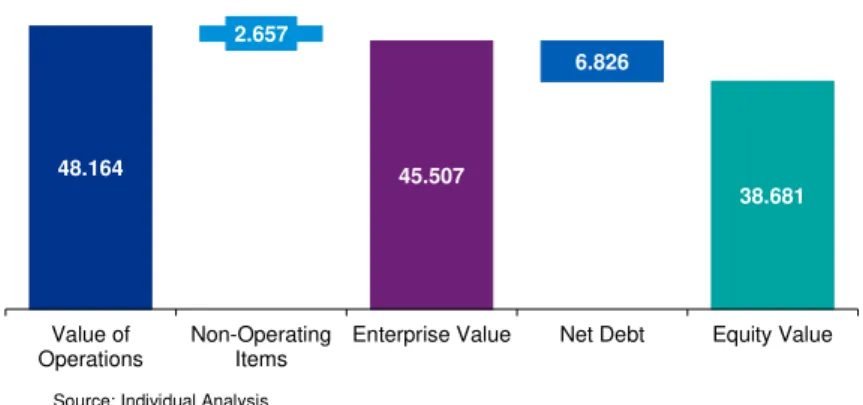
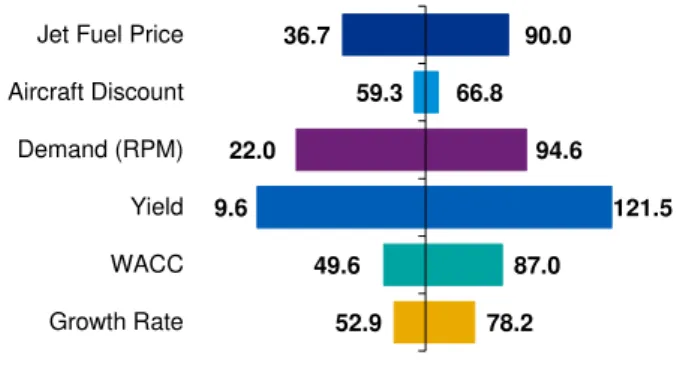
With a heavy weight of equity on the company’s total capital, the WACC is estimated at 6.6%, which considering a 2% growth rate in perpetuity driven by the predicted future inflation rate, leads to a fair value of equity as of December 2017 of $38.7 billion, implying a stock price of $62.83 per share and a correspondent 1-year capital gain, including cash-ins for shareholders, of 24%. As expected, sensitivity analysis shows that the share price is significantly influenced by future fuel prices, future demand and average passenger yield. However, no major changes in the forecasted values are expected under normal conditions.
Demand is expected to increase at an average of 2% per year in the future, with supply forecasted to rise as well in order to match it. Profitability is forecasted to increase, with net income rising up from $2,181 million in 2015 to about $3,148 million in 2027.
Historically, there has been a tight relation between industry demand and economic
conditions. Between 2003 and 2015, RPM growth and GDP growth showed a correlation above 85%. As of Jan-2016, a sector beta of about 1.3 highlights a more volatile industry than the overall market.
Despite the primary goal of promoting competition within the sector, the deregulation ended up creating a market with power concentrated within very few companies.
Southwest Airlines Co. ended 2015 with a total CASM of 11.2 cents, with American Airlines, United Airlines and Delta Air Lines showing up a total CASM of, respectively, 12.9 cents, 13.1 cents and 13.3 cents, during the same period.
SOUTHWEST AIRLINES CO. COMPANY REPORT
PAGE 4/31
Airlines Industry: Past, Present and
Future
(De) Regulation
The 1978 Airline Deregulation Act and the consequent dissolution of the Civil Aeronautics Board (CAB), the regulator of the U.S. aviation industry, completely changed the airlines market. By the time of the Airline Deregulation Act, Southwest Airlines Co. was a simple regional airline, not able to fly outside of Texas due to the restricted CAB rules. Nowadays, it is the largest U.S. domestic carrier and a case of huge success.
If before the deregulation airlines were treated as public entities, with austere restrictions regarding routes, fares and the entry of new companies in the sector, after 1978 the market turned out to be free and interstate routes became available for any airline without the need of regulatory permission. Since companies could only compete on service quality and flight regularity, the industry was characterized by high prices and frequency but poor load factors and efficiency. With deregulation leading to a huge increase in the number of flights, passengers and distance travelled, along with a significant drop on fares, acting to enhance load factors, the paradigm changed dramatically, enabling low-cost carriers to come up as true players in the market.
However, this was not that simple for Southwest Airlines Co.. Due to the Wright Amendment, the company could only fly to four states1 contiguous to Texas
from the Love Field Airport, in which it was based. This was highly supported by its main competitors at the time, keen to make it move its operations to the Dallas-Fort Worth International Airport, much farther from downtown Dallas. Despite the possibility of manipulating the system through the purchase of multiple tickets2, customers departing from Texas were forced to fly through
one of the four mentioned states in which the company was able to operate, and then changing airplane to travel to their end destinations. This was particularly significant to Southwest Airlines Co., in the sense that Texas constituted its main source of passengers - additional states were only allowed in 1997 and 2005, and the law was fully abolished recently in 2014.
The deregulation of the market started by favouring the hub-and-spoke model, enabling legacy airlines to better achieve economies of scale through the
1 It was only possible to perform unrestricted flights from Texas to Arkansas, Louisiana, New Mexico and Oklahoma.
2 Customers flying from Texas would have to buy a ticket to one of the four mentioned states in which the company was able to operate,
and another one from that state to their final destination.
The deregulation acted to decrease prices, with a drop of about 9% in the yield during the 5 years following the Airline Deregulation Act and an average decrease of 60%, in inflation-adjusted terms, in RPM between 1974 and 2010. Also, it acted to increase passenger miles flown, with the number of passengers rising from about 208 million to 1,000 million between 1974 and 2015.
High barriers to entry for new airlines, slow government responses to existing ones and common monopolistic practices of legacy airlines that acted to inflate fares, as well as the specific economic environment at the time, with the 1973 oil crisis and
stagflation and technological advances, figured as major concerns regarding the industry, leading to the need of deregulation.
SOUTHWEST AIRLINES CO. COMPANY REPORT
PAGE 5/31 considerable reduction of overheads in large hubs and to drive out competition from the airports in which they are mainly based. With the upsurge of low-cost carriers, however, the trend was for the point-to-point system to get back into the industry, avoiding the difficulty of efficiently connect passengers across a
hub-and-spoke network and considerably reducing the costs associated with
primary and busier airports, namely landing fees and service rentals, as well as making airlines better able to perform faster turnarounds, leading to a maximized performance.
Despite having the main goal of promoting competition within the sector by reducing the barriers to enter in the market and the pressure over prices, and even though the aviation industry is still a heavily regulated sector, the overall transference of control from the CAB to the market ended up concentrating a huge influence in the largest carriers within the sector, especially when considering the recent industry consolidation and the resulting informal oligopoly structure of the business. Overall, and despite of (de)regulation, the old monopolies somehow still exist. If in the past airlines used to use their political connections and influence to keep competition away, nowadays they do not let other companies to enter in the business by promoting price wars that new entrants cannot hold or by merely buying these new and weaker firms.
Macroeconomic Environment
The U.S. airlines industry has been facing “boom-to-bust” cycles since the referred deregulation of 1978. Both demand and supply, measured respectively by RPM and ASM, and the sector operating revenue have been showing up a very similar behaviour to the overall economic activity, measured by GDP. This correlation has been proved to hold in the past decades, with the referred indicators presenting a more volatile behaviour than the economic activity, both in good and bad times. Between 2003 and 2015, the growth of operating revenues, RPM and ASM presented a correlation of about 79%, 87% and 83%, respectively, with the GDP growth3.
This volatility was considered to be normal in a sector characterized by intense capital requirements but poor levels of cash. With capital expenditures amounting to more than $17,400 million in 2015, above the $10,500 million average of all industries, ranking the sector in the top 15 regarding the metric, and a cash returned to net income ratio of about 49% in the same period, way below the 135% average of all industries, ranking it in the top 30 of sectors with
3 Based on data from the World Bank and the U.S. Bureau of Transportation Statistics. The entire aviation industry is considered.
Despite promoting the
entrance of new companies in the market, from the Airline Deregulation Act until 2001, 9 major carriers and more than 100 smaller ones filled for bankruptcy or were liquidated. It was the case of Eastern Air Lines or Midway Airlines. Southwest Airlines Co., instead of creating a hub, bets on having about 8 to 10 independent and non-stop routes originated from each airport that it serves, which stands up as key to gather local demand.
The point-to-point model enables Southwest Airlines Co. to enjoy lower costs while still providing high-yielding routes.
When considering for
comparison, for instance, the electronics, automotive retail or building materials sectors, it can be concluded that they present considerably lower capital expenditures - $4,300 million, $3,100 million and $1,700 million, respectively - and higher cash returned to net income ratios - 62%, 90% and 87%, respectively.
Figure 1. Growth Rate of GDP and Industru RPM, ASM and Operating Revenue
-17% -12% -7% -2% 3% 8% 13%
2003 2005 2007 2009 2011 2013 2015
GDP % growth RPM % growth
ASM % growth Op. Revenue % growth
SOUTHWEST AIRLINES CO. COMPANY REPORT
PAGE 6/31 the lowest cash earned per income generated, the air transport industry proves to be capital intensive and cash poor even when considering other sectors4.
Since the 2008 recession, however, overall airlines have been making a huge effort to maximize their business models efficiency, not only by lowering operating costs, eliminating unprofitable routes and betting in more fuel efficient aircraft, but also by trying to enhance revenues with the separate charge of services that used to be included in the price of tickets, as is the case of on-board meals, or that were not previously available, such as on-boarding priority and internet access.
Overall, positive trends in macroeconomic factors have been acting to drive up air travel demand. Following the severe crisis that affected the industry after the 9/11 and the 2008 financial crisis, taking years for it to recover from consecutive periods of losses, the U.S. economy is currently said to be in a good time. With a positive economic growth leading to an increase on employment rates and consequently higher disposable income, customer spending on leisure travel tends to considerably rise as well. On the other hand, through the experienced business and industrial growth, spending on business travel and freight transportation is also likely to increase.
Overall, the aviation industry is highly competitive, which creates strong barriers not only to enter in the market but also, and mostly, to become and remain an important player within a sector that is not only capital intensive but also labour and technology intensive, heavily regulated and taxed, and particularly sensitive to harmful events such as terrorism attacks or natural disasters.
Trends
52015 was a particularly profitable year, justified by a moderate economic growth and hence stable demand, and falling costs. Passenger yields were also lower on average, driven by the huge expansion of ultra-low-cost carriers such as Spirit Airlines and Allegiant Air and the necessarily lower airfares, but compensated through the drop in oil prices.
Despite the current time of recovery from one of the historical most serious recessions, the aviation industry is expected to continue growing over the long run. This will be mainly driven by a growth in demand through the country’s
4
Based on the Damodaran research, considering a total of 95 different sectors.
5 Data according with the Federal Administration Aerospace (FAA)
Forecast – Fiscal Years 2015-2035 and the International Air Transport Association (IATA).
Not only Southwest Airlines Co., but also Delta Air Lines, American Airlines and United Airlines, as well as the overall sector, are planning to
modernize their respective fleets, at a higher or lower extent, in the next few years, through the substitution of older aircraft by the new and more efficient Boeing and Airbus models.
Spirit Airlines and Allegiant Air, for instance, had in 2015 an average of 40% of ancillary revenues as a share of the total revenue generated.
The U.S. experienced a GDP growth of 2.6% in 2015, along with a constant decrease of the unemployment rate since 2010, standing at 6.2% as of the end of 2014.
Events such as the 9/11 or the recent airplane crashes pose a major risk to airlines.
SOUTHWEST AIRLINES CO. COMPANY REPORT
PAGE 7/31 solid consumer spending and steady job growth, with a passenger growth of about 2% per year over the next 20 years.
Currently low oil prices are stimulating a market that is highly dependent on energy costs, but due to the growing demand and higher costs of extraction, the trend will be for prices to rise up from about 43$ per barrel in 2016 to more than 100$ per barrel in 2023, and about 150$ per barrel by 2036, following the forecasted U.S. economic growth. With an eye on oil prices, and as the economy fully recovers, acting to strengthen demand mainly on large and medium hub airports, U.S. airlines overall profitability is expected to remain steady or increase.
Reflecting the total distance travelled by the total number of revenue passengers emplaned, Revenue Passenger Miles (RPM), the industry measure of demand, is forecasted to domestically grow at about 2% per year in the next 20 years. On the other hand, and reflecting the total distance travelled by the total number of seats available, Available Seat Miles (ASM), the supply side of the business, is expected to keep up the path of demand. For this will contribute not only the increases on the aircraft of the fleet, but also the higher number of seats per airplane of more modern aircraft.
Mainly after the 9/11 and the consequent turmoil in the aviation sector, causing major airlines to be restructured through bankruptcy and Chapter 11, there has been a huge consolidation within the market, with a series of mergers and acquisitions. Following the 9/11 and the economic conditions during the financial crisis, these mergers were mainly driven by the urgent need of cutting overheads, strengthening presence in core markets and extending routes and overall capacity, in many cases highlighted by the eminent bankruptcy. If in 2005 there were 12 major airlines, with the recent merger between American Airlines and US Airways, creating the world’s largest airline, the market was left with only 4 major airlines that control more than 65% of it – Southwest Airlines Co. being one of them, currently with the highest percentage of market share. It is therefore highly unlikely that any further consolidation attempts are approved by the U.S. Government and the antitrust regulators.
Both due to the referred consolidation and restructuring process of the market and to the stronger presence of low-cost carriers in the last years, overall airlines have been implementing a strong capacity discipline in their businesses, increasing the emplaned passengers at a higher rate than the increase in the fleet, acting to enhance load factors, a strategy that is expected to be kept in the future.
Fuel costs have a considerable impact on airlines profitability,
constituting on average 30% of their total operating costs, between 2004 and 2015.
Major mergers and acquisitions included: US Airways and American West Airlines (2005), Delta Air Lines and Northwest Airlines (2008), United Airlines and
Continental Airlines (2010), Southwest Airlines and AirTran Holdings (2011) and American Airlines and US Airways (2013).
Filling in the airplanes as much as possible to enhance load factors and efficiency is no longer exclusive of low-cost carriers.
SOUTHWEST AIRLINES CO. COMPANY REPORT
PAGE 8/31
Southwest Airlines Co.: An Overview
Founded by Rollin King and Herb Kelleher in 1967, and initially created as an intrastate carrier due to the strict regulation at the time, Southwest Airlines Co. was shaped to take advantage of the lack of capacity of major airlines within Texas biggest cities.
With insufficient seats and subsequent high fares practiced in that specific market, and taking advantage of Boeing’s overproduction and hence more competitive aircraft prices at the time, the company implemented a strategy of costs that were low enough to enable it to set lower prices than the cost of driving over the same route. Also, turnaround times were highly minimized in order to perform the desired number of flights per day with the few airplanes available within the fleet, requiring that employees did whatever necessary to prepare the airplane for the next flight in the shortest period of time possible. Currently with more than 52,000 employees and operating on average more than 3,400 departures per day, Southwest Airlines Co. was the pioneer of the aviation low-cost model. It not only implemented a no-frills service, since the low fares practiced could not support extra services such as on-board meals, but was also the first company worrying about a more efficient fleet utilization, applying the strategy of using a single type of aircraft and minimizing turnaround times. Actually, it has been a major inspiration to other low-cost carriers, with its business model replicated by many other companies across the world, as is the case of european EasyJet and Ryanair.
Several legacy carriers in the U.S. tried to launch a low-cost service based on Southwest Airlines Co. business model, opening low-cost subsidiaries, but all of them failed. While removing extra services and amenities and using a single type of aircraft was something relatively easy for them to implement, they could not deal with employees in the same way as Southwest Airlines Co., turning out to be impossible for them to achieve the same labour productivity and aircraft turnaround efficiency. Even ultra low-cost carriers, which have been able to establish in the market with a relative success, are much smaller and end up operating in niches that do not directly compete with Southwest Airlines Co.. Southwest Airlines Co. stock price ranged between $33.96 and $51.42 during the last 52 weeks, with an average of $42.40 per share. Actually, the last years have been particularly favourable to the company, with the value of its stock increasing considerably since the beginning of 2014, rising from $18.84 as of December 2013 to $49.84 as of December 2016. For this contributed both the
A culture of promoting the employees well-being was implemented from the beginning, paying them industry competitive wages and developing a strong team effort, with pilots often
helping on the cleaning of the aircraft and on the
transference of luggage during turnarounds, for instance.
SOUTHWEST AIRLINES CO. COMPANY REPORT
PAGE 9/31 deregulation of the market, with the abolishment of the Write Amendment, and the mentioned overall expansion and profitability of the industry in recent years. The company performed not only better than the market, represented by the S&P 500, with a cumulative return in the last three years6 of 112% against the
51% of the S&P 500, but also considerably better than the overall aviation industry, with the NYSE ARCA Airlines Index7 presenting a cumulative return of
only 23% in the same period.
Shareholder Structure
With 616 million shares outstanding as of December 2016, Southwest Airlines Co. shareholder structure is mainly composed by institutional investors holding an ownership of approximately 76%, with Primecap Management Co., Vanguard Group Inc. and Fidelity Management & Research Co. being the largest participants. Within the referred institutional investors, the largest part corresponds to investment firms, followed by hedge funds, pension funds and banks, the latter at a much lower scale.
The company granted restricted stock units to part of its employees through several share based compensation plans, with a total of 60 million shares reserved for issuance under the employee equity plans as of December 2015, having around 822 thousand stock options outstanding with a weighted average exercise price of $13.448.
Listed in the New York Stock Exchange, Southwest Airlines Co. has been returning large amounts of value to its shareholders – since 2010, and both through share repurchases and dividend payments, the company returned about $4.3 billion to investors.
Strategic Positioning
With the mentioned consolidation of the market, almost all airports are now dominated by just a few players, acting to highly reduce competition across companies. However, and mainly due to the huge focus of carriers on costs, as well as to the recently improved economic conditions and profitability, the airline
6 Monthly returns from December 2013 onwards are used. 7
The NYSE ARCA Airlines Index is an “equal-dollar weighted index designed to measure the performance of highly capitalized and liquid international airline companies”, constituting a proxy for the U.S. aviation market.
8 According to the Black Scholes fair value of the company’s common stock, as of Southwest Airlines Co. Annual Report - 2015.
12%
6%
6% 4%
3%
69%
Primecap Management
The Vanguard Group
Fidelity Management & Research
BlackRock
State Street Global Advisors Others
Figure 3. Southwest Airlines Co. Shareholder Structure – Institutional Investors
Source: Thomson Reuters (as of 5-Jan-2017)
62% 6%
4% 2%
26%
Investment Firms Hdge Funds Pension Funds Banks Others
Figure 4. Southwest Airlines Co. Shareholder Structure – Institutional Investors by Type
Source: Thomson Reuters (as of 5-Jan-2017)
76% 24%
Institutional
Others
Figure 2. Southwest Airlines Co. - Shareholder Structure
SOUTHWEST AIRLINES CO. COMPANY REPORT
PAGE 10/31 industry is still characterized by high levels of competition, and Southwest Airlines Co. faces threats from other airlines on almost all of its routes, being American Airlines, Delta Air Lines and United Airlines, the other largest U.S. airlines, its key competitors.
Regarding dimension, Southwest Airlines Co. is only below Delta Air Lines with respect to market capitalization, with $31,500 million against $37,200 million as of January 2017. Regarding ASM and RPM, it shows up in the top 4, but below the three legacy carriers considered. Furthermore, there is a great discrepancy between the four major companies and the others, with the latter presenting a market capitalization between $2,800 million and $10,800 million and much lower ASM and RPM under the same periods.
In terms of market share, Southwest Airlines Co. dominated more than 18% of the market in 2015, closely followed by its referred main competitors - together, the four main airlines had a market share of more than 65%. Ultra-low-cost carriers, on the other hand, jointly shared a much lower portion of the industry in the same period, with Alaska Air and Spirit Airlines jointly dominating only about 7% of the market.
Despite playing an important role within the market, acting to increase competition and promoting lower fares, ultra low-cost carriers only dominate a small part of the sector and are not able to directly compete with the main players of the market, not only due to their lower scale, but also to their target passengers. As they have a completely different business model than legacy carriers, it turns out to be difficult for them to capture customers from flag airlines, which usually look for a more premium service. At a lower extent, and despite applying a low-cost strategy as well, Southwest Airlines Co. also offers a different service, with some of the amenities of legacy carriers but lower prices - again, making it difficult for these ultra low-cost carriers to become real threats to the four main companies constituting the oligopolistic sector. Even when considering the expected future increase in the number of passengers carried, it is not likely that ultra low-cost carriers significantly increase their share of the sector, since the market leaders, with their established and well-defined business modes, can easily and aggressively counteract to any attempt of further decreasing prices.
Instead of the hub-and-spoke service provided by many carriers in the U.S., under which companies have one or more hubs from which their flights have to go through before leaving for smaller selected destinations, Southwest Airlines Co. mainly provides a point-to-point service. This allows for more direct nonstop routing, avoiding the high level of costs associated with the maintenance of 17%
18%
17% 15%
5% 5%
3%
21%
Delta
Southwest
American
United
Alaska
Jet Blue
Spirit
Others
Figure 6. U.S. Aviation Industry – Market Share (as of Dec-2015)
Source: Statista
Figure 5. U.S. Aviation Industry – ASM, RPM and Market Capitalization (in billions and $ billions, respectively)
Source: Thomson Reuters (as of 5-Jan-2017)
247210 141117 269223 184184 40 34 18 14 49 42 11 9 21 18
37,2 31,5
23,8 22,5
10,8
3,0 7,3 2,8 4,0
0, 5, 10 15 20 25 30 35 40
Delta Southwest American United Alaska Hawaiian JetBlue Allegiant Spirit
SOUTHWEST AIRLINES CO. COMPANY REPORT
PAGE 11/31 such a complex interconnected system, and decreasing passenger travel times and the probability of delays. Besides, the company becomes better able to perform more frequent flights at lower fares, as well as to minimize the time that the aircraft is on the ground in less congested airports, decreasing turnarounds, all leading to a higher level of asset utilization, productivity, efficiency and customer satisfaction.
Also, it has been participating on airport improvement projects, consisting on the construction of new facilities and on the modernization of existing ones. Despite entering into funding agreements both to, on one hand, finance the projects, and to, on the other hand, be reimbursed by the effective owners of the facilities, the company does not expect to have significant impacts on its resources and financial position. In that sense, Southwest Airlines Co. is able to create better conditions within the infrastructures in which it runs its business without major capital obligations.
The modernization of the fleet through the incorporation of the Boeing 737-800 and the consequent increase in the number of seats has enabled the company to serve long-haul routes at a lower cost, facing higher levels of demand on gate-restricted airports without having to increase the number of flights performed. Also, with these new airplanes, the company is able to reduce both the maintenance costs related to aircraft and the fuel expenses.
Southwest Airlines Co. revenues are, as in almost every airline in the world, characterized by a degree of seasonality, with demand for air travel and hence revenues and load factors being generally higher during the summer months of the second and third quarter of the year.
In a market in which legacy carriers usually rely mostly on the sale of tickets to generate profits while low-cost carriers tend to bet on ancillary revenues to complement its business model, Southwest Airlines Co. differentiates itself from competitors by including many services on its low price tickets. By not charging extra fees on items such as seat selection and snacks, it ends up gaining a competitive advantage over other companies.
Actually, it presents a percentage of ancillary revenues, based on total operating revenues generated, similar to those of its main competitors, which are legacy carriers, but a lower average passenger yield, characterizing the lower ticket prices it charges. On the other hand, it presents a higher average yield but a considerably lower dependence on ancillary revenues than the ultra-low-cost carriers of the market. This fits in the company’s primary goal of maximizing load factors by transporting the maximum possible number of passengers in each flight, even if it comes at the expense of a lower fare.
Southwest Airlines Co. is currently participating in four airport improvement projects: it is rebuilding the facilities of the Dallas Love Field Airport and modernizing terminals in the Fort
Lauderdale-Hollywood International Airport, Houston William P. Hobby Airport and Los Angeles International Airport, with new gates and upgrades to existing security
checkpoints and ticketing areas. 0% 20% 40% 60% 80% 0 2.000 4.000 6.000 Q2-14Q3-14Q4-14Q1-15Q2-15Q3-15Q4-15Q1-16Q2-16Q3-16 Total Revenue Load Factor Figure 7. Seasonality of Revenues – Total Revenues ($ million) and Load Factor (%)
Source: Southwest Airlines Co. Annual Reports
9% 11% 12% 16% 20%
38% 43%
16,6 15,6 15,9 15,7
14,3 14,3 11,9 -1 6 1 1
Delta Southwest American United Alaska Allegiant Spirit % Ancillary Revenues Passenger Yield per RPM
Figure 8. Ancillary Revenues (% of Total Revenue) and Passenger Yield per RPM, as of Dec-2015
Source: Statista and Companies Annual Reports
SOUTHWEST AIRLINES CO. COMPANY REPORT
PAGE 12/31 Southwest Airlines Co. has two major components of operating costs, namely salaries and fuel expenses, jointly responsible for 65% of the company’s total costs in 2015. Maintenance expenses and landing fees, on the other hand, tend to have a lower impact on its overall costs, both due to the use of a single model of aircraft in the first case, and to the fast turnarounds performed at airports in the latter.
Having on average lower unit costs than its three main competitors, the cost structure of the company is what better differentiates it and enables it to profitably charge low fares. Actually, total costs per Available Seat Mile (CASM) are the lowest among the U.S. largest carriers, both including and excluding fuel costs, with only ultra-low-cost carriers being able to surpass the company’s low average expenses.
This constitutes a major challenge for Southwest Airlines Co., in the sense that it must have the ability to efficiently manage and control its costs to remain profitable, which turns out to be especially hard regarding its two major cost responsibilities, salaries and fuel. Due to the high level of uncertainty and lack of absolute control over these costs, the company is faced with the need of having a higher degree of flexibility over the other types of expenses, so that it is able to counteract to abrupt and unexpected changes, for instance, in oil prices.
By entering into over-the-counter fuel derivative contracts and continually controlling and adjusting its fuel hedge portfolio, the company is better able to manage the risk associated with significant changes in energy prices. This is not, however, as straightforward as it may seem at a first glance due to the lack of a reliable forward market for jet fuel beyond two years, forcing the company to correctly estimate the future prices of the commodity and to adjust the hedging portfolio so that it better fits its needs9. By 2015, with about 15% of its
fuel consumption covered by these contracts, and around 20% in 2016, depending on where market prices settle, the company is known for hedging more of its fuel consumption than its peers.
The hedging strategy of overall carriers10, however, is rapidly changing due to
the currently weak oil prices. Airlines came to a point in which the risks associated with hedging end up not compensating its potential benefits, especially when considering that the short-term forecast predicts stable and
9 Under its hedging strategy, Southwest Airlines Co. uses WTI crude oil, Brent crude oil and refined products such as heating oil and
unleaded gasoline.
10
Asian and european airlines tend to rely more heavily on hedging, since they usually have to spend U.S. dollars to buy fuel but collect their revenues in other, and recently weaker, currencies. Even saying so, and due to the large losses they had in the last few years, even these carriers are nowadays spending less in hedging strategies for future fuel consumption.
39%
26% 6% 9%
6% 14%
Salaries, Wages and Benefits
Fuel and Oil
Maintenance Materials and Repairs Landing Fees and Rentals Depreciation and Amortization Other Operating Expenses
Figure 9. Operating Expenses by Type (% of total), as of Dec-2015
Source: Southwest Airlines Co. Annual Report
9,2 8,6 9,8 9,8 8,3 8,3 7,8
5,8 5,5 4,1
2,6
3,1 3,3
2,5 2,4 2,7
2,6 2,2
13,3 11,2
12,9 13,1
10,8 10,7 10,6 8,5
7,7
Delta Southwest American United Alaska Hawaiian JetBlue Allegiant Spirit CASM (excluding fuel) Fuel Cost per ASM CASM (including fuel) Figure 10. Total Costs per ASM (excluding and including fuel costs), as of Dec-2015
Source: Companies Annual Reports
SOUTHWEST AIRLINES CO. COMPANY REPORT
PAGE 13/31 relatively low fuel prices. Also, and this stands up as extremely important on Southwest Airlines Co. strategy, aircraft is being replaced by much more fuel efficient equipment, which combined with the overall industry profitability of the last years makes airlines less vulnerable to possible changes in fuel prices. At a lower extent, the company also enters in interest rate swap agreements, so that it locks in a fixed interest rate for its floating interest rate loan agreements, reducing the natural volatility associated with its net interest expenses.
Despite the launch of its international service in 2014, and the great opportunities that foreign markets can present to the company, almost the entire volume of Southwest Airlines Co. s is attributable to domestic operations, a fact that is expected to be maintained in the future, with a steady international growth.
Primarily based on an organic growth strategy, Southwest Airlines Co. performed few acquisitions through its history. However, both the 1993 acquisition of Morris Air and, more recently, the 2011 acquisition of AirTran Holdings Inc., enabled the company to take advantage of complementary routes and opportunities to geographically expand into other regions. AirTran acquisition, which is currently completely integrated, was particularly important to the company, leading to an accelerating expansion into the U.S. and entry into international markets, as well as to the establishment of the largest domestic airline based on the number of passengers flown by eliminating one of its leading rivals within the low-cost segment11.
Risks and Contingencies
Risks regarding potential competition from european low-cost carriers arise, in the sense that many of these companies are considering the idea of starting operations in the attractive transatlantic routes. This has been thought for many years, with several failed attempts, but it could end up constituting a threat for american airlines. Southwest Airlines Co., however, is not expected to be affected by this possible future reality, both since it only operates domestically, with almost negligible foreign revenues and no plans to aggressively expand internationally, especially into transatlantic markets, and because it would be extremely hard or even impossible for outsiders to directly compete with a
11
More specifically, the acquisition of AirTran Holdings enabled Southwest Airlines Co. to guarantee a strong presence in Atlanta, a large city at which the company did not operate and that constituted AirTran’s principal hub, allowing it to directly compete with Delta Air Lines without the need of incurring in a long and costly process to get established in that specific market.
98,6%
1,4%
Domestic
Foreign
Figure 11. Southwest Airlines Co. - Revenues by Origin, as of Dec-2015
SOUTHWEST AIRLINES CO. COMPANY REPORT
PAGE 14/31 cost carrier that is not only fully established in the U.S. airlines market, but also constitutes one of the four biggest players of the industry.
Characterized by high fixed costs and unpredictable demand, the airline industry is highly sensitive to business cycles and changes in economic conditions. While short-haul passengers can easily replace air travels by surface means of transport and business passengers may use videoconference and similar systems as an alternative, unfavourable economic conditions may prevent the company to adjust fares when fuel prices, or other general costs, increase.
With fuel expenses representing more than 25%12 of the company’s total
operating costs in 2015, even a small change in market prices can have a great impact on Southwest Airlines Co. profitability. Despite using fuel derivative instruments to protect itself from price volatility, the recent extreme changes in jet fuel prices evidence its highly unpredictable behaviour and the potential danger of this situation for the company. Besides, fuel derivatives may end up not providing the right protection against energy price increases, in the sense that the company uses several different instruments at different price points, which can lead to additional volatility on its earnings. On the other hand, the company’s liquidity and overall financial situation could be affected by the possible need of additional cash collaterals to be delivered to fuel hedge counterparties. As an example, due to the huge drop in oil prices and the hedging position of the company at the time, in 2015 it recognized losses of $254 million in fuel and oil expenses, with $577 million paid to counterparties. Salaries, wages and benefits, on the other hand, constituted about 40% of its 2015 total operating expenses, with the company having a limited ability to control these costs under the terms of its collective-bargaining agreements. In a labour intensive sector full of competition in attracting and retaining skilled personnel, and with more than 80% of its employees represented by labour unions, there is a continued pressure on Southwest Airlines Co. labour costs. Furthermore, several litigation processes against the company are under consideration in the courts, with respect to possible violations of federal antitrust laws, which can potentially lead to high future financial and reputational costs.
12 Fuel expenses include the fuel costs presented in the Income Statement as operating costs as well as the costs related with the
SOUTHWEST AIRLINES CO. COMPANY REPORT
PAGE 15/31
Southwest Airlines Co.: Key Value
Drivers
Demand: Air Traffic
The demand for aviation services, as in any industry, is a key value driver for a company’s business. Understanding the future air traffic demand stands up as crucial when determining the expected revenues of any airline. By correctly predicting demand, the company becomes better able to correctly adjust supply, acting to maximize efficiency.
With a total of 753 million passengers emplaned at U.S. airports in 2014, corresponding to both originating and connecting passengers, future demand is dependent on local and national economic conditions as well as on the specific characteristics of the industry. It is therefore possible to forecast demand at specific airports within the country by using regression analysis, mainly with fares, region and regional demographics as independent variables.
Being that said, and having future predicted demand, given by the total future enplanements by airport13, it becomes important to understand in which airports
Southwest Airlines Co. mainly operates. From the total trips that the company performs per day, more than 50% are concentrated in ten single airports14, with
the remaining spread out by the other locations in which the company maintains operations.
Hence, and making the fair assumption that the company will maintain at a more or less constant level the proportion of flights it keeps in each airport, both since it has no plans to significantly change its current operating strategy and because it is highly unlikely that it loses its position in the market, it is straightforward to determine the level of enplanements it may expect in each future year, from each of the referred airports. The aviation sector is very well defined, with the three major legacy carriers having specific hubs in which they capture almost the entire market share. Since these airlines are not planning to significantly move operations, mainly because they are already established in the largest and busiest airports, the perfect situation for their hub-and-spoke
models, and also because Southwest Airlines Co. bets on several different routes along different secondary airports, in line with its point-to-point strategy,
13
Data and research from the Federal Aviation Administration Aerospace Forecast – Fiscal Years 2015-2040.
14 The ten airports from which the company has the highest number of departures per day are, namely: Chicago Midway, Las Vegas,
Baltimore, Denver, Phoenix, Dallas, Houston, Orlando, Atlanta and Los Angeles.
7% 6%
6%
5% 5% 5%
5% 4% 4% 4%
49%
Chicago
Las Vegas
Baltimore
Denver
Phoenix
Dallas
Houston
Orlando
Atlanta
Los Angeles
Others
Figure 12. Southwest Airlines Co. - Breakdown of airports by total number of departures (% of total), as of Mar-2016
Source: Southwest Airlines Co. Fact Sheet
Having each airport total enplanements for Southwest Airlines Co., the overall number of passengers expected to be carried by the company in each future year is combined with the total miles expected to be flown, and RPM are computed. Through the product of RPM with the expected passenger yield, passenger revenues are estimated.
Total Enplaned Passengers x Total Miles Flown = RPM
SOUTHWEST AIRLINES CO. COMPANY REPORT
PAGE 16/31 major alterations regarding the airport positioning of each company are not expected.
Regarding the airports that are not considered in the implicit forecast, by further considering an average for the total passengers enplaned based on the predictions for the overall domestic industry, a proxy is found for Southwest Airlines Co. air traffic demand. At this point, forecasts must be adjusted to non-revenue passengers, which in this specific case correspond to about 17% of total enplanements, since those would not contribute for the company’s revenue generation.
Supply: Capacity and Capital Expenditures
Supply is the other key value driver of the business. More precisely, supply in the airlines industry is given by the total number of seats available to transport passengers along the total distance flown by them, and therefore affected by several factors, as is the size of the fleet, the specific size of each equipment, the trips flown and the average length per trip.
As of December 2015, Southwest Airlines Co.’s fleet was composed by a total of 704 aircraft, from which 581 were owned by the company and the remaining 123 were under capital and operating leases. With 129 of its older aircraft being completely retired by 2018, it has a plan of purchases of more modern equipment for the next years15, with pre-orders to Boeing until 2025, year by
which the company is expected to have 868 airplanes. Besides, and despite not being probable to happen since the company’s purchases are expected to correctly fit future demand, it also has options that guarantee the purchase of additional equipment in case it needs to.
There are no expectations regarding possible changes in the number of aircraft under capital and operating leases, and hence it is forecasted that Southwest Airlines Co. is maintaining its current level of rented equipment, with increases in the fleet being justified by a number of airplanes fully depreciated lower than the purchases of the company.
These acquisitions are obviously directly tied with the company’s expected future capital expenditures. It is crucial to notice that, despite the high cost associated with the purchase of new equipment, usually airlines get very
15
Overall, Southwest Airlines Co. is expected to maintain the Boeing 737 model, simply replacing the Boeing 300 and Boeing 737-500 currently on the fleet by the new Boeing 737 MAX-7 and Boeing 737 MAX-8. Furthermore, acquisitions of the Boeing 737-800 are also predicted.
Southwest Airlines Co. is expected to maintain the current 50% of total departures in the 14 mentioned airports.
38 53 29 15 14 14 15 34 41 40 14
5 8 18 19 23
23 36
2016 2017 2018 2019 2020 2021 2022 2023 2024 2025 Aircraft Orders Aircraft Options
Figure 13. Southwest Airlines Co. – Aircraft Orders and Options
Source: Southwest Airlines Co. Annual Report and Individual Analysis
669 710 738 787 868 868 152 153 153 154
156 156
2017 2019 2021 2023 2025 2027 Aiplanes in the Fleet
Average Seats per Airplane
Figure 14. Southwest Airlines Co. – Aircraft and Average Seats per Airplane
SOUTHWEST AIRLINES CO. COMPANY REPORT
PAGE 17/31 significant discounts, in this specific case from Boeing, paying a much lower price than the listed one. This becomes even more highlighted since Southwest Airlines Co. has a very close and old relation with Boeing, with all its fleet composed exclusively by the Boeing 737 model for several years, not to mention the large number of already pre-ordered equipment, standing up as one of the producer’s key customers, if not the most important one. Actual prices paid by airlines are not publicly disclosed, which makes it difficult to accurately predict the future expenses of the company regarding these purchases. However, there is evidence pointing to discounts ranging from 20% to 60%, with an average of around 40% per aircraft. In fact, rumours say that Southwest Airlines Co. is having access to discounts up to 60% over the listed price, given the orders for the Boeing 737 MAX in the next few years. Adopting a conservative position, the referred 40% of discount is predicted.
Valuation
Overall Forecasts
An accurate forecast of revenues is also a key step in the correct determination of the company’s fair equity value. Revenues are what mainly drives cash flows up, not to mention that almost all the strategic decisions of management, and therefore the majority of balance sheet and income statement accounts, are directly tied with the expected generation of money. In the case of an airline, revenues may be computed as the product between RPM and passenger yield, the first representing the total distance travelled by paying passengers and the latter the average fare paid per mile.
RPM are therefore given by total miles flown and total enplaned paying passengers, both of which were already discussed above. On its turn, the yield must take into account both the average price that the company is expected to charge in each year and the expected inflation rate of the overall economy. A slightly decrease of the average nominal price it has been historically charging is expected for Southwest Airlines Co., on one hand given its low cost structure and the increased competition from ultra-low-cost carriers that highlight the importance of price competition, and on the other hand since the company is expected to act in order to attract more customers, especially under the predicted increase in demand and all the pre orders of aircraft already made to
Capital Expenditures are given by the product of the number of planes expected to be bought and the average price per plane, which depends on the model acquired.
Figure 15. Southwest Airlines Co. – Passenger Revenues ($ million) and Yield per RPM
19.536 22.433 25.760 29.581 33.969 39.008 0,16 0,17 0,18 0,18 0,19 0,20
0 0 0 0 0 0 0 0
2017 2019 2021 2023 2025 2027
SOUTHWEST AIRLINES CO. COMPANY REPORT
PAGE 18/31 Boeing. Therefore, an overall growth rate of about 1.5%16 is expected for the
company’s passenger revenue yield, reflecting both the slightly decrease on nominal prices and the inflation rate.
Both capital expenditures and therefore the additional property, plant and equipment considered in the company’s balance sheet are forecasted through the predictions of ASM. As referred, ASM represent the total capacity of an airline to accommodate passengers and constitute the best proxy for supply, being calculated as the product of three inputs: the average number of seats per airplane, the average aircraft stage length and the total trips expected to be flown in each year.
Given the planned evolution of aircraft within the fleet, the existing and future purchase volumes of each Boeing 737 model and their specific characteristics regarding size, the computation of the number of seats per airplane is straightforward. For Southwest Airlines Co. specific case, there is a higher level of aircraft orders in the 2016-2018 and 2023-2025 periods due to the need of replacing aircraft that is expected to completely depreciate.
The average length of trips is expected to grow at steady rates, as has been in the historical evolution of the metric. This is due to both a steady establishment within the domestic market and a progressive expansion to international segments. Hence, and since the company does not plan to aggressively enter in any specific market, a 1.3% growth rate in total miles flown is expected to correctly capture the average longer flights it will perform to serve its new long haul routes. From the same rational, with an increase on the frequency of existent flights and the new routes arising from the approach to new markets, an equivalent growth rate is expected for the future total number of trips flown. Following this rational, and taking into account both the models and quantities expected to be bought and the expected price to be paid under the previously referred discount from Boeing, capital expenditures are easily computed. Overall, the company is expected to spend around $18 billion on aircraft purchases until 2025, time by which the fleet is expected to stabilize and capital expenditures start corresponding on average to the depreciation of the period. ASM figure out as an important input in the forecast model since historically, for the overall aviation industry, and excluding the costs associated with fuel and
16 The average cost charged by an airline is dependent on several factors, such as the operating costs of the company and the expected
future demand, and therefore a regression analysis could be used to forecast the yield. In this particular case, however, since the yield is predicted to grow mainly at the expected inflation rate due to the above mentioned factors, inflation is used and adjusted for the marginal expected decrease in fares instead of a regression that could lead to statistically significant but economically irrelevant or immaterial results, especially under a reduced level of available observations.
Figure 16. Southwest Airlines Co. – Capital Expenditures ($ million) and Aircraft Purchases
Source: Southwest Airlines Co. Annual Report and Individual Analysis
2.189 3.170 1.780 812 758 912 990 2.244 2.706 2.640
38 53
29
15 14 14 15 34
41 40
2016 2017 2018 2019 2020 2021 2022 2023 2024 2025 Capital Expenditures Aircraft Purchases
The number of trips performed is expected to increase in order to reflect the predicted higher number of passengers in each airport, which will require a higher frequency of flights.
While maintaining its current operations within the
SOUTHWEST AIRLINES CO. COMPANY REPORT
PAGE 19/31 oil requirements, changes in operating expenses are driven by changes in ASM, justifying the use of the metric as a basis for the predictions regarding the company’s future operating expenses. This happens since the costs associated with the operations of the firm are directly tied with its level of capacity; independently of completely filling in the airplanes or not, it will have to incur in the same costs regarding aircraft maintenance, landing fees and even salaries. Actually, this relation has been proved to hold by the analysis of the historical ASM and operating costs of the company. Despite this close relation, however, it is necessary to understand that while salaries and landing fees are expected to show up an upward trend, maintenance expenses are predicted to have the opposite behaviour.
Salaries per ASM are expected to grow at an average of 3% per year, taking into account both the expected inflation rate for the economy and the nominal increases on payments to employees, in line with the company’s historical decisions regarding this topic. This growth rate above the average inflation, acting to increase salaries not only in nominal but also real terms, considers also the pressure that a highly unionized work force is able to make, with Southwest Airlines Co. having a reduced negotiation power than otherwise. Landing fees per ASM, on the other hand, are predicted to increase due to the higher level of activity of the firm. This is due to the expected increase in the total trips flown and the longer average length of flights due to the approach to international markets, which necessarily leads to the need of longer turnarounds, as well as to the extra competition within existing and new airports in which Southwest Airlines Co. is expected to operate and finally to the historical performance of these costs. An average yearly 4.5% increase in the level of expenses per ASM is therefore predicted.
Additionally, maintenance expenses are expected to decrease as the older aircraft is replaced by new and less maintenance intensive equipment, as has been actually happening in the last years in which the company has started this modernization process. A decrease of about 4% per year on maintenance expenses per ASM is therefore predicted until 2018, time by which Southwest Airlines Co. completely finishes the retirement of the referred airplanes. From this point onwards, however, and as the fleet gets completely modernized and the previously new airplanes start getting older and needing additional maintenance, a yearly growth rate of around 4% is expected, based on the historical costs of the company.
Constituting an airline’s largest and most important cost, fuel and oil expenses are also the most volatile aspect of the business. Its forecast, as opposed to the
0 5.000 10.000 15.000 20.000
2017 2019 2021 2023 2025 2027
Salaries Maintenance Expenses Landing Fees Others Figure 17. Southwest Airlines Co. –
Operating Expenses, excluding fuel and oil and depreciation and amortization expenses ($ million)
Source: Southwest Airlines Co. Annual Report and Individual Analysis
Landing fees are dependent on the time spent on
turnarounds and on the competition within the
SOUTHWEST AIRLINES CO. COMPANY REPORT
PAGE 20/31 previously described operating expenses, is not based on ASM, since the metric would not lead to accurate values due to the volatile nature of jet fuel prices. Independently of capacity, a company may have very different expenses regarding fuel and predictions are therefore made by weighting the average fuel cost by the total fuel consumed in each year.
The determination of jet fuel prices is probably the most difficult metric to accurately forecast. The company is expected to buy jet fuel at the future market spot price, but this is not a very much known market, being infrequently traded and extremely unreliable. In that sense, forecasts for jet fuel prices determined by the research industry are used instead17, with an implicit
average growth rate of about 5% per year.
Total fuel consumed, on the other hand, is determined through the expected consumption per mile flown, being therefore dependent on the fuel efficiency of the fleet, which is expected to increase due to the referred replacement of equipment. Being the new Boeing MAX about 14% more fuel efficient than the current generation of Boeing 737 models that the company is operating, a weighted average efficiency gain is computed for each future year, based on the number of each type of airplane within the fleet. Overall, until 2027 Southwest Airlines Co. is expected to have an annual fuel efficiency gain of about 2%.
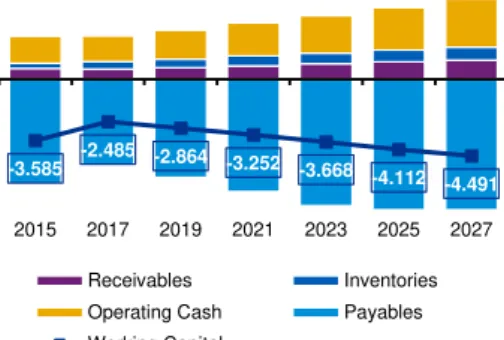
Southwest Airlines Co. working capital is considerably negative, driven by the large level of payables that the company presents on its balance sheet. This, however, is not necessarily an issue given the nature of the industry, characterized by having significant amounts of air traffic liabilities - revenues from passenger air travel are immediately received when the customer books the flight, but only effectively recognized when the service is provided, creating an obligation from the company to the client. Specifically in the case of Southwest Airlines Co., this corresponded to almost 50% of its total payables in 2015.
Regarding positive working capital items, the company presents a majority of operating cash, with a much lower proportion of receivables and an almost negligible amount of inventories, which once again perfectly fits into the industry features.
Under the assumption that the company will maintain its cash conversion cycle in the future, that is, that it will take on average the same time periods to convert working capital into effective revenues and costs, which is considered
17 Jet fuel prices used are estimated by the U.S. Energy Information Administration (EIA) – Independent Statistics & Analysis,
Short Term Energy Outlook November 2016.
-3.585
Receivables Inventories Operating Cash
Payables NWC
Source: Southwest Airlines Co. Annual Report
Figure 18. Southwest Airlines Co. – Working Capital ($ million), Dec-2015
Figure 19. Southwest Airlines Co. – Nature of Payables (% of total), Dec-2015
Source: Southwest Airlines Co. Annual Report
25%
12% 62%
Receivables
Inventories
Operating Cash
Figure 20. Southwest Airlines Co. – Nature of positive Working Capital (% of total), Dec-2015
Source: Southwest Airlines Co. Annual Report
19%
32% 49%
Accounts Payable
Accrued Liabilities
SOUTHWEST AIRLINES CO. COMPANY REPORT
PAGE 21/31 fair enough since its working capital requirements are highly dependent on its level of activity, the expectations will be obviously for working capital to present larger negative amounts along the forecast period. This is because Southwest Airlines Co. is expected to generate a higher level of revenues due to the predicted increase in demand, increasing air traffic liabilities without the need of significantly increase inventories or operating cash.
Furthermore, and as discussed above, the company has been entering into fuel derivative contracts in order to be less exposed to potential unexpected changes on fuel prices, being expected that it reduces its participation in the derivatives market due to the recent losses it had to recognize along with the drop in prices, as well as to the more favourable conditions regarding jet fuel costs.
Capital Structure
Due to the very particular features characterizing the airlines industry, namely the high level of capital expenditures required to sustain the business, and the comparably low cash generated from operations, companies within the sector tend to heavily rely on debt to finance themselves.
Actually, the proportion of debt in the capital structure of an airline has always been high18, but much influenced by the overall economic conditions of the
country. If in 2008 the global financial crisis acted to increase debt levels, from 2010 onwards those levels were reduced through the recovery in profitability and the enhanced generation of cash flows.
As could be expected, low-cost carriers tend to have healthier capital structures than legacy airlines, with lower levels of net debt mainly justified by the approach to more efficient business models with a reduced need for debt financing. However, and despite being an important measure for any company, a high proportion of debt within the capital structure does not constitute an issue unless the company is not able to serve it.
Southwest Airlines Co. has several types of debt within its capital structure, namely banking loans and bonds. Airlines do have a very specific structure of debt, heavily relying on capital and operating leases, by which they are able to benefit from the use of rented aircraft without incurring in the considerable expense of actually buying it. As all its competitors, Southwest Airlines Co. also
18 According to research, between 2005 and 2014, the average level of net debt as a percentage of total capital was about 70%, based
on listed companies within the USA. Figure 21. Southwest Airlines Co. –
Working Capital Evolution ($ million)
Source: Southwest Airlines Co. Annual Report and Individual Analysis
For the net debt analysis, both on and off balance sheet items are considered, that is, operating leases are also taken into account.
Representing a commitment to pay rentals for the use of aircraft, these leases may be perceived as a loan, with rentals representing the interest payments.
-3.585 -2.485 -2.864 -3.252 -3.668
-4.112 -4.491
2015 2017 2019 2021 2023 2025 2027
Receivables Inventories
Operating Cash Payables