Documentary evidence of past floods in Europe and
their utility in flood frequency estimation
T. R. Kjeldsena, N. Macdonaldb, M.Langc, L. Medierod, T. Albuquerquee,
E. Bogdanowiczf, R. Bra´zdilg, A. Castellarinh, V. Davidi, A. Fleigj, G.O.
G¨ulk, J. Kriauciunienel, S. Kohnovam, B. Merzn, O. Nicholsono, L.A.
Roaldj, J.L. Salinasp, D. Sarauskienel, M. Srajq, W. Strupczewskir, J.
Szolgaym, A. Toumaziss, W. Vanneuvillet, N. Veijalainenu, D. Wilsonj
aDepartment of Architecture and Civil Engineering, University of Bath, Bath, BA2 7AY,
UK
bSchool of Environmental Sciences, The University of Liverpool, Roxby Building,
Liverpool, L69 7ZT, UK
cIrstea, Hydrology-Hydraulics Research Unit, 5 rue de la Doua, 69100 Villeurbanne,
France
dTechnical University of Madrid, Department of Civil Engineering: Hydraulic and
Energy, Madrid, Spain
eDepartment of Civil Engineering, Polytechnique Institute of Castelo Branco, Portugal fInstitute of Meteorology and Water Management. Podlesna 61; 01-673 Warsaw, Poland
gInstitute of Geography, Masaryk University, Kotl´aˇrsk´a 2, 611 37 Brno, Czech Republic hDepartment of Civil, Chemical, Environmental and Materials Engineering (DICAM),
University of Bologna, Bologna, Italy
iDepartment of Irrigation, Drainage and Landscape Engineering, Faculty of Civil
Engineering, Czech Technical University in Prague, Thakurova 7, 166 29 Prague 6, Czech Republic
jNorwegian Resources and Energy Directorate, Middelthunsgate 29, 0368 Oslo, Norway kDepartment of Civil Engineering, Faculty of Engineering, Dokuz Eylul University, Buca,
35160, Izmir, Turkey
lLaboratory of Hydrology, Lithuanian Energy Institute, Breslaujos 3, 44403 Kaunas,
Lithuania
mDepartment of Land and Water Resourses Management, Faculty of Civil Engineering,
Slovak University of Technology Bratislava, Radlinskeho 11, 813 68 Bratislava, Slovak Republic
nGFZ German Research Centre for Geosciences, Telegrafenberg, 14473 Potsdam,
Germany
oThe Office of Public Works, Trim, Co. Meath, Ireland
pInstitute of Hydraulic Engineering and Water Resources Management, Vienna
University of Technology, Vienna, Austria
qUniversity of Ljubljana, Faculty of Civil and Geodetic Engineering, Jamova 2, SI-1000
Ljubljana, Slovenia
rInstitute of Geophysics, Polish Academy of Sciences. Ksiecia Janusza 64, 01-452
Warsaw, Poland
tEuropean Environment Agency, Kongens Nytorv 6, 1050 Copenhagen K, Denmark uFinnish Environment Institute, Freshwater Centre, Mechelinkatu 34a, 00251 Helsinki,
Finland,
Abstract
This review outlines the use of documentary evidence of historical flood events in contemporary flood frequency estimation in European countries. The study shows that despite widespread consensus in the scientific liter-ature on the utility of documentary evidence, the actual migration from academic to practical application has been limited. A detailed review of flood frequency estimation guidelines from different countries showed that the value of historical data is generally recognised, but practical methods for systematic and routine inclusion of this type of data into risk analysis are in most cases not available. Studies of historical events were identified in most countries, and good examples of national databases attempting to collate the available information were identified. The conclusion is that there is considerable potential for improving the reliability of the current flood risk assessments by harvesting the valuable information on past extreme events contained in the historical data sets.
Keywords: flood frequency estimation, historical events, Europe,
1. Introduction 1
The reliable estimation of extreme flood events is challenging, but neces-2
sary for the design and operation of vital infrastructure such as flood defences, 3
bridges, culverts and dams, and for more general flood risk management and 4
planning, e.g. emergency planning, flood risk mapping, and for defining 5
flood insurance premiums. In practice, this information is obtained using 6
flood frequency estimation techniques. Through statistical analysis of ob-7
served events, a probabilistic behaviour of flood events is inferred which is 8
then extrapolated to provide estimates of the likely magnitude of future ex-9
treme events (e.g. the magnitude of the flood expected to be exceeded on 10
average once every 100-year is estimated from a 40-year record). By nature, 11
extreme flood events are rare and seldom observed locally and as a result 12
hydrologists have little chance of gathering an adequate sample of recorded 13
events to make confident predictions. This naturally raises the question of 14
how best to extrapolate to extreme events, when no or only short series 15
of recent events are available. As floods occur in almost all regions of the 16
world, reliable flood estimation is a generic and shared problem. In Europe, 17
the last couple of decades have witnessed a number of high-magnitude low-18
frequency flood events (Kundzewicz et al., 2013), causing widespread damage 19
and destruction. But flooding in Europe is not a recent phenomenon, and 20
there are multiple accounts of damaging flood events across the continent 21
going back centuries (e.g., Glaser et al., 2004, 2010; Baptista et al., 2011). 22
While the occurrence of extreme floods is a shared problem across Europe 23
(and beyond), the lack of cross-boundary cooperation (national and regional) 24
has lead to individual countries investing in research programmes to develop 25
national procedures for flood frequency estimation. As a result, no standard-26
ised European approach or guidelines to flood frequency estimation exist. 27
Where methods do exist they are often relatively simple and their ability 28
to accurately predict the effect of environmental change (e.g. urbanisation, 29
land-use change, river training and climate change) is unknown (Castellarin 30
et al., 2012; Madsen et al., 2012). Also, the problem of consistent estimates 31
of extreme floods for trans-boundary rivers is rarely considered (Pappen-32
berger et al., 2012). The COST Action ES0901 European procedures for 33
flood frequency estimation represents a novel opportunity to develop closer 34
understanding of the methods of flood frequency employed across Europe. 35
The Action is undertaking a pan-European comparison and evaluation of 36
different methods available for flood frequency estimation under the various 37
climatologic and geographic conditions found across Europe, and different 38
levels of data availability. The availability of such procedures is crucial for 39
the formulation of robust flood risk management strategies as required by the 40
Directive of the European Parliament and of the Council on the Assessment 41
and Management of Flood Risks (2007/60/EC). 42
Currently, flood frequency is most commonly based on systematic instru-43
mental data, collected from established networks of gauging stations oper-44
ated and maintained by a variety of station authorities/bodies across Europe. 45
These gauging stations are of various forms and complexity depending on the 46
level of data accuracy required. A more detailed discussion of availability, 47
length and types of flood data records as well as procedures for flood fre-48
quency estimation procedures used across Europe is provided by Castellarin 49
et al. (2012). 50
A well-known consequence of the extrapolation from short series is the 51
high level of uncertainty associated with estimates of design floods with large 52
return periods. For example, estimating the 100-year design flood peak from 53
a 24-year record Stedinger and Griffis (2011) reported a factor of 4-to-1 be-54
tween the upper and lower bounds of the 90% confidence interval. Given that 55
the average record length is typically in the range 20-40 years, hydrologists 56
have attempted to reduce the uncertainty levels by either: i) bringing addi-57
tional gauged data from nearby and comparable catchments into the anal-58
ysis (e.g., Hosking and Wallis, 1997), or ii) extending the available records 59
by bringing flood data from before the beginning of systematic flow record-60
ing into the analysis in the form of historical and palaeoflood data (Guo and 61
Cunnane, 1991), or iii) using rainfall stochastic generators and rainfall-runoff 62
models to constrain extreme flood assessment by rainfall information (e.g., 63
Paquet et al., 2013). The three methods all have merit, but only the second 64
is the focus of this review. 65
Realising the importance and utility of long-term datasets, flood hydrol-66
ogists have increasingly turned their attention to historical flood information 67
(Br´azdil et al., 1999, 2006; Glaser et al., 2004; B¨ohm and Wetzel, 2006;
Mac-68
donald, 2006; McEwen and Werritty, 2007; Glaser et al., 2010; Herget and 69
Meurs, 2010; Kobold, 2011; Santos et al., 2011; Br´azdil et al., 2012), and
70
how best to incorporate documentary evidence of such historical floods into 71
flood frequency estimation (e.g., Stedinger and Cohn, 1986; Williams and 72
Archer, 2002; Benito et al., 2004; Gaume et al., 2010; Macdonald and Black, 73
2010; Ga´al et al., 2010). However, the application of non-instrumental data
74
into flood risk analysis is not new, as is evident from already existing guid-75
ance documents such as the Flood Studies Report (FSR) (NERC, 1975) in 76
the UK, a French handbook for flood risk assessment with historical data 77
(Miquel, 1984), the guidelines for flood frequency estimation in Germany 78
(DVWK, 1999), and the methodological guide to implement the Floods Di-79
rective in Spain (MARM, 2011). For the purpose of this study we propose 80
three definitions are adopted for the broad classification of different types of 81
hydrological data. 82
• Instrumental: long records, where records have been kept using avail-83
able technologies, e.g. gauging stations or stage-boards (c.
1850-84
present) 85
• Documentary: data derived from sources which are intermittent e.g. 86
documentary descriptions or flood levels marked on bridges (c. AD 87
1000-present). Documentary evidence most often refers to historical 88
events that occurred decades, centuries or even millennia ago, but it 89
can also relate to more recent events in locations where no instrumental 90
data are available. 91
• Palaeoflood: flood signatures recorded within depositional sequences, 92
often sedimentary (channel cut-offs and lakes), though recent work has 93
also witnessed flood signatures retrieved through dendrochronological 94
approaches (Pleistocene present). As with documentary evidence, ge-95
omorphological evidence can also refer to recent flood events. 96
Regarding the historical and palaeoflood data we can add the following def-97
initions: 98
• Perception threshold: level or discharge above which contemporary 99
society considered the event sufficiently severe to record information 100
about it, e.g. epigraphic markings (Macdonald, 2006) or a written 101
account in news media or a specialist publication. 102
• Censored data: unmeasured floods known to have occurred above or 103
below the perception threshold, despite not knowing their exact magni-104
tude. Several researchers have shown that just knowing that a flood ex-105
ceeded a perception threshold can add significant value to the flood fre-106
quency analysis (e.g., Stedinger and Cohn, 1986; Cohn and Stedinger, 107
1987; Payrastre et al., 2011) 108
An important complication when considering documentary and palaeoflood 109
data is the impact of a changing environment (i.e. changes in climate and 110
land-use, or river engineering works) on the characteristics of the flood series, 111
and how to include this impact in future predictions. 112
The importance of data for assessing both the hydrology and impact of 113
past events has been recognised as an integral part of flood risk management 114
by the EU Flood Directive. The information collected in the Preliminary 115
Flood Risk Assessment (PFRA) documents developed by the individual EU 116
Member States starts with readily available or easily derivable information, 117
such as records and studies on long term developments. Member States 118
describe flood events that occurred in the past, which had significant adverse 119
impacts, and for which the likelihood of similar future events is still relevant, 120
reporting the frequency or recurrence of these events. The likely impact 121
of climate change on the occurrence and impact of floods shall be taken 122
into account in the review of the PFRA. For this, information beyond the 123
instrumental records is acknowledged as being able to reduce the uncertainty 124
of the assessment. 125
A key part of the COST Action ES0901 is to improve understanding of the 126
barriers to new approaches to flood estimation. The results and discussions 127
presented in this paper are mainly based on responses from a questionnaire 128
circulated among COST Action participants on the use of historical floods 129
and documentary evidence in flood frequency estimation. Specifically, this 130
paper will undertake, first, a review of the general challenges for the incorpo-131
ration of documentary evidence within flood frequency estimation. The focus 132
of this paper is not to address the issues of data sources and information, 133
which have previously be examined in detail by others, such as Br´azdil et al.
134
(2006, 2012), but to examine the use and application of historical records 135
and information in flood frequency analysis; specifically. Second, challenges 136
with the application of historical information within a changing environment 137
will be assessed. Then, a review of the use of historical information in flood 138
frequency estimation across Europe is undertaken by examining the detailed 139
questionnaire responses which represent the position and statements of the 140
individual countries. Finally, the paper will conclude by considering the 141
current barriers to further application and potential developments. 142
2. Challenges for broader application of historical information 143
As documentary evidence most often predates the installation of gauging 144
stations, and is not directly supported by other instrumental sources (using a 145
limnimetric scale e.g. stageboards), it generally provides indirect information 146
on peak flood discharge, often in the form of a water level marker (Figure 147
1), or information that a specific location had been flooded, damaged or 148
destroyed, or that the water level had reached a level relative to a structure 149
(e.g. it had reached the top of the doorframe). 150
Different quantitative methods have attempted to extract the information 151
contained in historical data using a variety of approaches. The most com-152
mon approach is to consider a perception threshold for a historical period 153
or sub-period, with the assumption that each flood exceeding this threshold 154
has been recorded (e.g. NERC, 1975). As the consequences are important, 155
this can sometimes be aided by thresholds within the environment of known 156
exceedance. An example is the flooding of the Lincolnshire Plains by the 157
River Trent in Central England when a low lying moraine (Spalford Bank) is 158
overtopped, which is known to occur at flows in excess of 1000 m3s−1
(Mac-159
donald, 2013). Having established the threshold, the number of exceedance 160
events during a period can then be retrieved from historical records. A more 161
detailed approach involves the use of hydraulic formulae (e.g. Manning equa-162
tion) or one or two dimensional hydraulic models (St Venant equations) to 163
convert historical flood levels into historical discharges (Lang et al., 2004a). 164
As shown by Neppel et al. (2010) it is important to ensure that the hy-165
draulic model calibrates with flood marks and rating curves (when available) 166
and reassess the hydrological homogeneity of discharge estimates at several 167
places. Hydraulic studies should provide a discharge estimate, but also a 168
range of possible values within an interval, based on a sensitive analysis or 169
an uncertainty analysis. 170
Several statistical approaches were developed in the past to improve the 171
flood frequency curve estimation by extracting the information contained in 172
the different types of historical records discussed above. In the USA, Bul-173
letin 17 B (USWRC, 1982) proposed the weighted moments (WM) technique 174
for incorporating historical information in a flood frequency analysis. The 175
WM technique is a straightforward method that is noticeable for ease of im-176
plementation. Stedinger and Cohn (1986) developed a maximum likelihood 177
estimator (MLE), which was more flexible, efficient and robust than the WM 178
technique. Moreover, it allowed the introduction of binomial censored data 179
into the likelihood function; however, MLEs present numerical problems in 180
some occasions. To avoid this drawback, while maintaining the efficiency 181
of MLE technique, the expected moments algorithm (EMA) was developed 182
(Cohn et al., 1997). Reis and Stedinger (2005) proposed a Bayesian tech-183
nique based on Markov Chain Monte Carlo methods (BMCMC) that im-184
proves previous techniques by providing the full posterior distributions of 185
flood quantiles. Likewise, the BMCMC technique allows for the introduction 186
of uncertainty into historical peak discharge estimates. The WM technique 187
was adapted to the case of probability weighted moments (PWM), to pro-188
duce the partial probability weighted moments (PPWM) approach (Wang, 189
1990). The EMA technique was also adapted to the PWM case, providing 190
the expected probability weighted moment (EPWM) estimator, which im-191
proves the estimation of the shape parameter, but has also shown some bias 192
(Jeon et al., 2011). 193
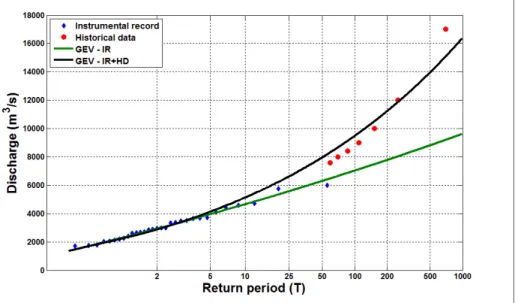
An example of how the inclusion of historical events can help flood fre-194
quency estimation to better represent the probabilistic behaviour of flood 195
events can be seen in Figure 2. It shows the results at the Tortosa gauging 196
station located on the River Ebro in Spain, a comparison between two Gen-197
eralised Extreme Value (GEV) distributions fitted to i) a sample of 31 annual 198
maximum flood peaks recorded at the gauging station (instrumental) by the 199
method of L-moments, and ii) the same sample of instrumental events, but 200
enhanced with seven historical flood events by the method of PPWM. From 201
the frequency plot in Figure 2 it is clear that the GEV distribution fitted to 202
the instrumental record only, would result in severe under-estimation of the 203
real flood risk at the site of interest. However, the inclusion of the histori-204
cal records estimated from a set of flood marks recorded at a house close to 205
the reach improved the estimation of extreme return period floods, as their 206
magnitude was unknown from the short instrumental record. 207
Most of these analytical developments have been undertaken within the 208
academic field. However, extending these improvements to routine practical 209
use is not trivial, principally because of the mathematical complexity of most 210
techniques. For instance, classical MLEs are efficient for sufficiently long 211
records, but may produce numerical problems in application to case studies 212
when sample size is small (El Adlouni et al., 2007); a significant drawback for 213
recommending this technique for practical application. Bayesian techniques 214
also present critical steps, such as the estimation of prior distributions and 215
the computation of posterior distributions which are not always straightfor-216
ward. The elegant statistical models based on censored data sources and 217
solved using likelihood functions, sometimes combined with Bayesian statis-218
tics (Reis and Stedinger, 2005), can provide very good results. Nevertheless, 219
this review suggests that whilst these models exist, there is limited evidence 220
that they have migrated from the academic field into operational guidelines. 221
Potential barriers to the broader application of these approaches may reflect 222
the complex computational requirements and site specific characteristics that 223
may be best combined with specific methods, though the survey undertaken 224
in this study did not contain information on why certain approaches are not 225
applied. These problems lead to the use of the more simplistic, but robust, 226
methods in practice, as recommended by operational guidelines, such us the 227
WM technique in the United States and the PPWM in Spain. 228
In addition to providing formal input into quantitative flood frequency 229
estimation, documentary evidence of past events can be helpful in commu-230
nicating flood risk to non-specialist stakeholders (McEwen et al., 2013) and 231
for better understanding variations in flood seasonality (Macdonald, 2012). 232
The transformation of information from descriptive accounts of past events 233
into more easily understood groups of flood magnitude has seen the use of 234
indices, often using a scale dividing the events into a set of qualitative classes 235
(Sturm et al., 2001; Llasat et al., 2005) for flood severity, see Br´azdil et al.
236
(2006, 2012); for example class 1 (low to intermediate events: damage and 237
flooding are limited to restricted areas), class 2 (high events: flooded area 238
and debris flow are important, structures such as dikes and roads have been 239
destroyed for several hundred of meters), class 3 (extreme events: damage 240
or destruction of important structures and flooding on the whole plain). Al-241
though a useful tool for categorising and visualising flood magnitude, this 242
approach has yet to be useful in the estimation of flood frequency, and is 243
unlikely to present any advances as the approach removes individual event 244
information and groups the events, thereby reducing the potential value of 245
the data. 246
3. Assessment of environmental change 247
There is some discussion provided as to means of accounting for the im-248
pact of environmental change on flood occurrence, with several countries 249
undertaking comparison to nearby stations, for non-homogeneity and trend 250
studies. However, in a review of existing guidance in European countries 251
on how to include considerations of environmental change in flood frequency 252
estimation, Madsen et al. (2012) found that generally little or no guidance 253
is provided for how to deal with trend or non-homogeneity when identified, 254
and how this knowledge should be incorporated into flood estimation. This 255
is clearly an area where much more effort is required to translate scientific 256
research into operational guidelines. 257
Different types of non-stationarity can be considered within historical 258
records, as the frequency distribution could change during the period for 259
which historical and palaeoflood data are recorded: i) the changes related 260
to non-homogeneity problems (historical data availability, transformation of 261
indirect information to discharge estimate); ii) climatic variability over long 262
time scales could limit the utility of historical data under a stationarity frame-263
work to some hundreds of years in the past (Hosking and Wallis, 1997). This 264
topic remains an open field of research, with present interest amplified by 265
the perspective of climate change for the 20th and 21st centuries; iii) chan-266
nel changes (natural and anthropogenic) over long timeframes (e.g., Br´azdil
267
et al., 2011a). As a means of minimising the potential impact of these cli-268
matic non-homogeneities, historical records used for flood frequency analysis 269
are not extended back beyond around 400 years in Spain. This practice lim-270
its the influence of past climatic changes; as a greater frequency of extreme 271
flood events are found in the period 1540-1640 (Benito et al., 2003). Similar 272
timeframes are recommended in a number of academic papers (e.g. Parent 273
and Bernier, 2003; Macdonald, 2013), but this often focuses on concerns re-274
lating to data quality and quantity prior to this (as discussed above) rather 275
than climatic variability, with several studies commenting on the longer time-276
frame providing greater climatic variability, and therefore a more uncertain 277
climate range (e.g. Macdonald et al., 2006). These issues become even more 278
important when attempting to merge gauged flow data with palaeoflood data 279
stretching back millennia, though it could be argued that climatic variabil-280
ity over millennial timescales incorporates sufficient variability that climate 281
phases become less significant. While some researcher have embraced the use 282
of palaeoflood data (Baker et al., 2002), others remain more sceptical of their 283
practical utility, especially when regional flood frequency methods are avail-284
able (e.g. Hosking and Wallis, 1986). Notably, Neppel et al. (2010) identified 285
large error associated with historical flood magnitude estimation could lead 286
to a reduction in the precision of design flood estimates when compared to 287
estimates using gauged data only, supporting the view that palaeoflood data 288
should be handled carefully when included into a flood frequency analysis. 289
Lang et al. (2004b) proposed a statistical test based on the Poisson process 290
for the detection of changes in peak-over-threshold series. It has been applied 291
to several historical series in France and Spain (Barriendos et al., 1999) and 292
in central Europe (Glaser et al., 2004). The power of the test is limited when 293
the number of historical floods is low. On the contrary, including low to 294
intermediate historical floods increases the risk of non-homogeneity, as such 295
floods can be strongly influenced by anthropogenic changes. It is therefore 296
recommended to check the validity of the rating curves used for historical 297
floods. 298
The development of slackwater deposits as a tool in the reconstruction of 299
palaeoflood series has expanded extensively over the last couple of decades 300
Werritty et al. (2006); Jones et al. (2010); Huang et al. (2012); Dezileau et al. 301
(2014), with a number of review papers (e.g. Benito and Thorndycraft, 2006) 302
and books (Gregory and Benito, 2003) addressing the topic in detail. 303
Lakes can act as efficient repositories for sediments eroded from within the 304
catchment and that are transported through the fluvial system (Mackereth, 305
1966). The sediments reaching a lake are dependent on a number of variables 306
which may vary through time and space; see Schillereff et al. (2014) for a 307
full review. The sediments that reach the lake may be laid down providing a 308
sedimentary record of high-magnitude flows which appear as distinct lamina-309
tions of coarse material. An increasing number of studies have examined lake 310
sediment sequences with the intention of determining flood histories (Noren 311
et al., 2002; Gilli et al., 2013; Wilhelm et al., 2013). The sediments preserved 312
within the lake can contribute valuable information on flood frequency and 313
potential magnitude of single events over timeframes reaching several mil-314
lennia (Noren et al., 2002). For example, Swierczynski et al. (2013) derived 315
a 7,000-year flood chronology for the lake Mondsee in Upper Austria. Even 316
the seasons of the palaeofloods could be precisely determined by the micro-317
stratigraphic position of a detrital layer within the annual succession of lake 318
deposition. This flood chronology shows a striking variability in the flood 319
occurrence from decadal to millennial time scales. There is a period of more 320
than 200 years (21 B.C. 216 A.D.) without any flood documented, whereas 321
the average frequency is 0.04 floods/year yielding 9 floods for such a time 322
interval. 323
4. Questionnaire on use of historical data in flood frequency esti-324
mation 325
As part of the COST Action ES0901 European procedures for flood fre-326
quency estimation a review was undertaken examining if, and how different 327
European countries incorporate historical information into flood frequency 328
analysis. Responses were collected from 15 European countries, represent-329
ing the different participant countries of the COST Action; all participant 330
countries were invited to contribute through the completion of a question-331
naire, which was initially distributed to COST participants, who completed 332
or passed onto colleagues better placed to do so. The questionnaire applied 333
the definitions detailed above so as to distinguish between historical and in-334
strumental data series. A summary version of the questionnaire responses is 335
provided in Table 1. 336
TABLE 1 337
The following three sub-sections summarise the information collected 338
from the questionnaires. In particular: i) the length of existing historical 339
data series, ii) the accessibility to historical flood data, and iii) summaries of 340
specific guidelines developed in European countries. 341
4.1. Data availability 342
Each country was asked to provide details of the sites and locations where 343
the most complete historical series are available. This information is used to 344
provide an indication of the types and use of historical records as a series of 345
national summaries, but cannot be considered as an exhaustive inventory. 346
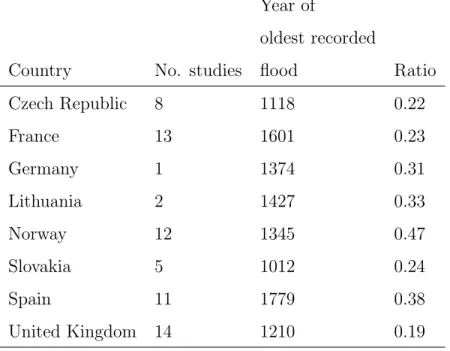
For each reported case-study the ratio between the length of the instru-347
mental record and the total time from the end of the instrumental record 348
until the first recorded historical flood event was calculated. The average of 349
the ratios calculated from the case studies within each country are reported 350
(Table 2) together with the number of case-studies and the oldest recorded 351
flood event. Note that the oldest flood refers to the oldest flood event as-352
sociated with an estimate of peak flow; in some countries, older events were 353
recorded but could not be assigned an estimate of the discharge. 354
TABLE 2 355
The average ratios are all below 0.50 suggesting that additional infor-356
mation of extreme floods can be found as far back in time as twice the 357
period covered by the instrumental record. The countries listed in Table 2 358
are representative of North, South, East and West Europe, indicating that 359
historically augmented flood estimation could be useful across the continent. 360
While no quantitative assessment of the benefit of the extended data series 361
were conducted as part of this review, several previous studies have high-362
lighted the utility of such series. For example, Macdonald et al. (2013) found 363
that extending a 40-year instrumental record with documentary evidence of 364
flooding dating back to 1772 resulted in an almost 50% reduction on the 365
uncertainty of the estimated design flood with a return period of 100 years. 366
Similar conclusions have been reached by other researchers such as Payrastre 367
et al. (2011). Thus, the data series listed in Table 2 represent an important 368
resource for providing more reliable estimates of flood risk across Europe. 369
4.2. Central depository of historical data 370
No centralised database exists as a depository for flood information at 371
a European scale. But a variety of laudable national/regional/local and
individual databases exists. However, there is no common agreed format, 373
and the databases often include either/or both qualitative and quantita-374
tive information with limited quality control on the information uploaded. 375
The purpose of existing data varies, which often reflects the structure and 376
types of information collected, the result is that some disciplines may feel 377
insufficient or ’the wrong’ type of data may be present, reflecting the var-378
ied uses of historical information, from those examining social impacts of 379
past floods to those interested in using the information in flood frequency 380
estimates, as such some disciplines may consider important information to 381
be absent. These databases tend to be funded through a variety of differ-382
ent mechanisms, with few receiving continuous central support; as such they 383
are funded initially, but then become reliant on individuals or professional 384
societies for continuation, good examples being the British Hydrological So-385
ciety Chronology for British Hydrology Events (BHS CBHE), as described 386
by Black and Law (2004), or the French national Historical Database BDHI 387
currently in development in the framework of the EU Flood Directive (Lang 388
et al., 2012). Whilst a valuable resource the full potential of these databases 389
cannot be realised in pan-European flood frequency estimation at present, 390
due to the absence of a standardised method for construction and minimum 391
data requirements. The National Disaster Archive compiled by the Disas-392
ter & Emergency Management Presidency (AFAD) in Turkey, for example, 393
provides tabular and spatial information (date, location) about the entire 394
spectrum of historic disaster events (e.g., floods, droughts, earthquakes, land-395
slides, forest fires, nuclear accidents, etc.) associated with figures of deaths, 396
injuries, affected populations, etc. However, this is not immediately utilizable 397
in flood frequency analyses due to the lack of data describing the physical 398
characteristics of the events, such as flood levels and discharges. 399
Recent efforts by a group of researchers from the Slovak Academy of 400
Sciences started with mapping of all historical flood marks and collecting 401
historical reports of floods in Slovakia. Their results are continuously pub-402
lished, e.g. recent studies by Pek´arov´a et al. (2011, 2013) give the overview of
403
the history of floods and extreme events in Slovakia and in the upper Danube 404
River Basin at Bratislava. 405
These databases provide pockets of knowledge, but large areas of Europe 406
remain ungauged. The use of geospatial databases for the visualisation of in-407
formation and capability to embed images within such databases presents an 408
important development, permitting flood levels and additional information 409
beyond a basic descriptive account to be housed within each flood account, 410
empowering the researcher to more rapidly and easily access required infor-411
mation. One of the principal constraints to the wider application of histor-412
ical information in flood frequency analysis has been the time requirements 413
for collecting the necessary data; well developed and constructed geospatial 414
databases present a valuable step towards removing these constraints. 415
4.3. Practical guidelines for inclusion of historical data 416
A number of countries were identified as possessing practical guidelines 417
for inclusion of historical flood information into flood frequency estimation, 418
including: Austria, France, Germany, Ireland, Italy, Slovakia, Spain and the 419 United Kingdom. 420 421 Austria 422
In Austria historical information, where available, was included in the devel-423
opment of national maps of flood discharge (Merz et al., 2008). The historical 424
information was included in flood frequency estimation procedure based on 425
the use of likelihood functions of censored information and Bayesian mod-426
elling techniques as described by Merz and Bl¨oschl (2008) and Viglione et al.
427 (2013). 428 429 France 430
Miquel (1984) presented a methodological guide for the inclusion of histori-431
cal data in flood frequency analysis. It was based on a Bayesian approach to 432
peak-over-threshold (POT) values with an a posteriori estimate of the flood 433
distribution, by combining with the Bayes theorem and a priori distribution 434
based on instrumental data and historical POT values. Parent and Bernier 435
(2003) presented an application of this model, using a MCMC algorithm for 436
computation. Naulet et al. (2005) used a maximum likelihood approach on 437
annual maximum values, with different sub-periods (each one being related 438
to a threshold of perception according to documentary sources availability) 439
and different types of data (censored, censored with uncertainties, binomial 440
censored). Lang et al. (2010) and Neppel et al. (2010) applied an error
441
model on discharge estimate, accounting for random errors (sampling uncer-442
tainties) and systematic errors (water level and rating curve errors). They 443
showed that ignoring the rating curve errors may lead to an unduly optimistic 444
reduction in the final uncertainty in estimation of flood discharge distribu-445
tion. Gaume et al. (2010) and Payrastre et al. (2011) presented a Bayesian 446
framework allowing the use of regional information of historical floods at un-447
gauged sites. They also provided results on the usefulness of historical data 448
in flood frequency analysis regarding the type of data (censored, censored 449
with uncertainties, binomial censored). 450
451
Germany 452
The German Association for Water, Wastewater and Waste (DWA) and its 453
predecessor DVWK have published guidelines which give recommendations 454
for the use of historical sources and data: DWA (2008): Guidelines on how 455
to exploit and interpret historical sources for determining extreme flood dis-456
charges. DVWK (1999): Guidelines for integrating large historical flood 457
magnitudes in flood frequency analysis are based on the methods presented 458
in Bulletin 17B (USWRC, 1982). This publication was superseded by the 459
more recent guidelines on flood estimation which devotes a separate chap-460
ter to the integration of large historical flood magnitudes in flood frequency 461
analysis (DWA, 2012). Three alternative approaches are offered to consider 462
historical data in the parameter estimation of the frequency distribution. 463
One of them is based on the definition of a set of likelihood functions repre-464
senting the actual nature of the available flood information, i.e.: i) discharge 465
of historical information known, ii) discharge is known to fall within an inter-466
val (upper and lower bound specified), or iii) event is known to have exceed 467
a perception threshold, but the actual discharge value is unknown. 468
469
Ireland 470
In Ireland, the generally accepted approach to incorporating historical flood 471
data follows that put forward by Bayliss and Reed (2001) in a similar man-472
ner to that described for the UK. With the imminent release of the Flood 473
Studies Update (FSU) methodologies in 2014, growth curve analysis will use 474
L-moment methods to derive growth curves, with the EV1 and LN2 distri-475
butions being the preferred distributions for use at gauged locations. It is 476
envisaged that methods of incorporating historical information will move to-477
wards the use of L-moment based methods in the future. The central source 478
of information on historical floods will remain the Irish flood hazard mapping 479 website, floodmaps.ie. 480 481 Italy 482
The gauging network for systematic river-stage monitoring in Italy was largely 483
installed in the twentieth century, therefore Italian streamflow records are 484
usually much shorter than 100 years (Calenda et al., 2009). In this con-485
text, historical and non-systematic information on flood events is a valuable 486
resource. Historical evidence of flooding in Italy has been recorded (e.g., Al-487
drete, 2007), and national databases of historical disasters (mainly landslides 488
and floods) have been established (Guzzetti et al., 1996, 2004). Neverthe-489
less, these databases contain predominantly descriptive information such as: 490
triggering mechanisms, economic losses and casualties, but little information 491
related to peak discharge. Consequently, although basin authorities routinely 492
use information on historical floods for geographically delineating the most 493
vulnerable areas and acknowledge the value of this information for improving 494
flood frequency estimation (see e.g., AdB-Po, 1999), no evidence of practical 495
use of historical floods in flood frequency estimation was identified in Italy 496
at a national level, though examples were found at regional and local scales. 497
For example an application to the Piedmont region reported by Claps and 498
Laio (2008) and Laio et al. (2011), and local application by Calenda et al. 499
(2009) on the River Tiber. 500
501
Czech and Slovak Republics 502
There are several methods for inclusion of historical flood data in flood fre-503
quency estimation in the Czech and Slovak Republics, which were published 504
in reports e.g. Dub and Nemec (1969), Ka˘sp´arek (1984) and Novick´y et al.
505
(1992). These methods are based on corrections of systematic errors by
506
estimation of statistical parameters (coefficient of variability, skewness) of 507
applied distribution functions. The German guidelines for using historical 508
floods, published in DVWK (1999), was applied by Szolgay et al. (2008). 509
Recent studies in Slovakia used a Bayesian framework to include both local 510
and regional information about historical floods at ungauged sites, and to 511
provide results on the usefulness of different types of historical data in flood 512
frequency analysis (Ga´al et al., 2010, 2013).
513
Flood frequency analysis in the Czech Republic is based on combina-514
tion of floods derived from documentary evidence and systematic hydrologic 515
measurements, which permits the creation of 500-year series: examples in-516
clude the Vltava (Prague), Ohˇre (Louny) and Elbe (Dˇeˇc´ın) series in Bohemia
517
(Br´azdil et al., 2005). In Moravia (eastern Czech Republic), similar compiled
518
series are available for the River Morava, starting as early as 1691 (Br´azdil
519
et al., 2011b). More recently, knowledge of historical floods coupled with 520
flood plain information in Prague was used for the estimation of hydraulic 521
parameters, permitting the calculation of peak discharges of past disastrous 522
floods during the pre-instrumental period (Elleder et al., 2013). 523
524
Spain 525
In Spain, the use of historical records is generally recommended when pos-526
sible, by fitting a GEV distribution by the PPWM method. In addition, 527
historical records were used in some Mediterranean basins (3) to improve: 528
i) the results of the regional flood frequency analysis, and ii) estimates of 529
high return period quantiles along the Mediterranean East coast of Spain 530
(Jim´enez- ´Alvarez et al., 2012).
531
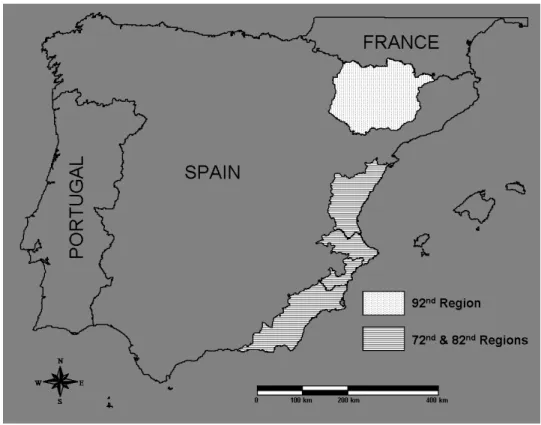
The 92nd Region is located in the northeast of Spain, including the rivers 532
of the left bank of the River Ebro with heads in the central Pyrenees (Figure 533
3). In this region the regional coefficient of skewness (L-CS) estimated from 534
instrumental records was improved by the use of historical information. It 535
was seen that two high flood events that occurred in the 20th century affected 536
most of this region (1907 and 1982). However, they were not recorded, as the 537
former occurred before the existence of a gauging station network in Spain, 538
while the latter exceeded the maximum capacity of the gauging stations. 539
Values of at-site L-CS were improved by the use of a GEV distribution fitted 540
with historical information by the PPWM method. The regional L-CS value 541
was updated by a weighted mean of at-site L-CS with weighting factors 542
dependent on the uncertainty of at-site estimations. 543
The 72nd and 82nd regions are located in the eastern part of Spain, in-544
cluding the lower parts of the J´ucar and Segura catchments that are affected
545
by rare and heavy rainfall events coming from the Mediterranean Sea (Figure 546
3). These events are caused by cut-off lows occurring in spring and autumn, 547
when cold air in the upper part of the troposphere moves from northern 548
latitudes to the south over the warm Mediterranean Sea, generating heavy 549
convective rainfall events and, consequently, intense flood events. However, 550
there is a lack of information recorded about these flood events; either they 551
occurred in the past before a gauging station was installed, or they were not 552
recorded, as they exceeded gauging station capacity. This lack of informa-553
tion can result in potentially severe underestimation of higher return period 554
quantiles. Estimates with only instrumental records can lead to magnitudes 555
around 5 to 10 times smaller for the 500-year return period. As floods come 556
from two types of rainfall events, a Two-Component Extreme Value (TCEV) 557
distribution (Rossi et al., 1984) fitted by MLE is recommended. In these 558
regions, the use of historical information in flood frequency is crucial to 559
achieve reliable estimation of higher return period quantiles. In Spain, the 560
use of historical information to improve flood frequency analyses is recom-561
mended (MARM, 2011). A large catalogue of historical floods is supplied by 562
the Spanish civil defence organization. 563
564
United Kingdom 565
The use of historical record has been called for since the mid-1970s, ini-566
tially through the early work of the Flood Studies Report (NERC, 1975) 567
and Potter (1978). More recently, Bayliss and Reed (2001) provided the first 568
approach designed specifically for practitioners on how to augment instru-569
mental datasets with documental evidence of historical records. However, 570
the uptake of this approach has been piecemeal and slow, in part as practi-571
tioners still require a user-friendly tool for incorporating historical data into 572
flood frequency analysis. Current methods widely employed for incorporating 573
historical flood information into flood assessments often consist of a conven-574
tional flood frequency plot, with the historical levels/discharges marked on, 575
but importantly not included within the statistical analysis. The use of an 576
informal graphical plotting approach was advocated by Reed and Robson 577
(1999) to permit greater confidence among practitioners in the application 578
of historical data. By contrast, Macdonald et al. (2006) and Macdonald 579
and Black (2010) have advocated the use of L-Moments, as they permit 580
greater flexibility and retained an approach practitioners were already fa-581
miliar with in dealing with pooled data, compared to more mathematically 582
involved Maximum-Likelihood approaches (Macdonald et al., 2013). Each of 583
the approaches considered a preference for a Generalised Logistic distribution 584
model to represent the flood growth curve. An interesting use of historical 585
information was reported by Williams and Archer (2002) who used historical 586
flood data to assess the return period of a recent large event. 587
5. Discussion 588
Despite general agreement in the scientific literature on the utility of 589
historical flood information in flood frequency estimation, the survey un-590
dertaken has shown that there is only a limited transfer of methods from 591
academia into practical guidance. A few good examples of guidelines and 592
depositories for historical flood data were identified, but no single unified 593
approach or database is evident. Depositories were identified both as part 594
of larger government hydrometric databases, but also existing independently 595
from official government databases, and operated mainly by volunteers and 596
populated by citizen science efforts (e.g. UK BHS CBHE). The lack of prac-597
tical guidelines and fragmented access to historical information are practical 598
barriers towards more operational use of these data sources to support cur-599
rent risk mapping efforts and decision-making problems. In addition, it is 600
also clear that the inclusion of historical information is not always straight-601
forward, requiring a greater degree of scrutiny before application than typ-602
ically required for instrumental data. In particular, it should be recognised 603
that historical information is fundamentally different from quality controlled 604
streamflow measurements obtained from gauging stations. For example, the 605
degree of certainty associated with discharge estimates from historical in-606
formation requires special consideration. Research has shown that simply 607
ignoring uncertainties on discharge estimates will favour the use of histori-608
cal information, as sampling uncertainty is reduced by increasing the length 609
of the flood period. Nevertheless, it is important to correctly describe the 610
uncertainties on peak discharge for the instrumental, historical and palae-611
oflood data, including errors on water level H, on the rating curve Q(H), 612
on the threshold of perception and on the starting date of the historical pe-613
riod. The latter should not be systematically the date of the oldest flood 614
in the historical data set (Strupczewski et al., 2013), but should include a 615
period prior to this. The Bayesian framework appears to be a suitable sta-616
tistical tool, enabling inclusion of several kinds of data (e.g. single values, 617
intervals, number of exceedances) and able to include errors/uncertainties on 618
discharge estimates (i.e., systematic error on water levels and on the rating 619
curve transformation) into flood frequency analysis. 620
While this review has found that there is largely consensus in the sci-621
entific literature as to the usefulness of historical data in flood frequency 622
estimation, the methods have overwhelmingly focussed on extending at-site 623
estimates. Few studies have reported on the use of historical information 624
in a regional context. A notable exception is the procedure for certain geo-625
graphical regions of Spain, where the occurrence of very extreme events in 626
the past has resulted in a set of regional flood frequency curves adjusted up-627
wards to represent the worst case, even if no actual events has been observed 628
at a particular site. This is potentially a very interesting methodological 629
development, recognising the limitations of fitting current statistical models 630
to datasets that are known not to include potentially very extreme events, 631
similar to events that have occurred in other locations within the region. 632
By contrast, Hosking and Wallis (1997) argue that historical information is 633
of limited use in regional flood frequency estimation; their reservations are 634
based on i) concerns about the accuracy and completeness of the historical 635
information (historical data are most often found in old and large human set-636
tlements and not at a representative sample across all possible catchments), 637
ii) representativeness of catchment within a region where historical data are 638
available, and iii) using data so far in the past that the underlying frequency 639
distribution might have changed too much (non-stationarity). A regional 640
model combining both regional and historical data was presented by Jin and 641
Stedinger (1989) combining the index flood method with a GEV distribution 642
where the model parameters are estimated using a combination of probabil-643
ity weighted moments and a maximum likelihood procedure. Gaume et al. 644
(2010) also presented a maximum-likelihood approach to combining regional 645
and historical data within the framework of the index flood method. Sur-646
prisingly, no or only little further development of these procedures appears 647
to have been reported in the literature, but this is an area where further re-648
search is still required to develop a new generation of risk tools to effectively 649
allow regional models to use historical information, and to define procedures 650
to enable the transfer of historical data between catchments. 651
The potential of historical information in public awareness of flood risk is 652
considerable, historical events are tangible, with epigraphic markings provid-653
ing an example of how communities have preserved evidence from past events 654
to educate future generations of flood risk, which may not be witnessed within 655
any single lifetime. Increasingly recognition of the non-quantitative informa-656
tion contained within historical flood accounts is being recognised, providing 657
detailed descriptions of the social and cultural responses to extreme events, 658
responses that inherently shape current flood risk management approaches 659
through learned knowledge within communities. This informal knowledge 660
is increasingly being sought and embedded within local flood risk manage-661
ment plans, as recognition of the value of local lay knowledge has developed 662
(McEwen et al., 2013). 663
The development of national approaches in individual countries has re-664
sulted in no-single approach being applied at a European level, constraining 665
the potential for cross border information transfer, and at worst leading to 666
misunderstanding and poor communication to the public (e.g. flood maps 667
with different flood extents at the boundary). Future research must address 668
several key themes: 669
• construction of a single database framework within which data can 670
be stored and managed, with both extraction, uploading (preferably 671
through approaches advocated by citizen science) and geospatial pre-672
sentation capabilities; 673
• move towards organisation data sharing across boundaries, with greater 674
free access to data for benchmark sites; 675
• development of a computationally simple user interface toolbox, within 676
which hydrological series comprising of different data types, lengths and 677
completeness can be assessed together; 678
• development of a set of practices for the treatment of data uncertainty 679
associated with historical records; and, 680
• a forum for the sharing and review of best practice at a European level. 681
Inevitably an assessment of the data has to be made by the individual under-682
taking the analysis and the purpose for which the data is compiled, but the 683
above proposals would facilitate a more rapid and structured approach to the 684
compilation and analysis of the data, overcoming a number of the obstacles 685
currently cited as prohibiting expansion in the application of historical data. 686
6. Conclusions 687
There is increasing recognition that historical records of flooding provide 688
a valuable means by which extreme rare events can be better understood, 689
facilitating more enlightened flood frequency analysis where interest is fo-690
cused on extreme events (events with a return period in excess of 100 years). 691
As evidenced within this research (Table 1 and 2), a number of examples of 692
historical flood analysis are present within most European countries, with 693
a number of countries if not actively incorporating historical flood records 694
into flood frequency analysis considering how they can be used, in compli-695
ance with the EU Floods Directive (2007/60/EC). Whilst no single approach 696
is uniformly applied to historical flood frequency analysis across Europe, a 697
number of national and regional approaches exists. As historical evidence is 698
often found in connection with large rivers, the use of this information could 699
be a key driver in both academic and practical investigations of transbound-700
ary flood management. 701
Acknowledgement 702
The authors would like to thank COST Action ES0901 European proce-703
dures for flood frequency estimation for financial support. Two anonymous 704
reviewers are acknowledged for their valuable comments on an earlier version 705
of the paper. 706
7. References 707
AdBPo, 1999. Progetto di Piano stralcio per lassetto Idrogeologico (pai) -708
Interventi sulla rete idrografica e sui versanti, 1. Relazione Generale (Mas-709
ter plan for the hydrogeological risk mitigation in the Po River Basin PAI 710
- General Report, in Italian). Tech. rep., Autorit di bacino del Fiume Po, 711
Parma, Italy. 712
Aldrete, G., 2007. Floods of the Tiber in ancient Rome. Baltimore: Johns 713
Hopkins University Press. 714
Baker, V. R., Webb, R. H., House, P. K., 2002. The scientific and societal 715
value of paleoflood hydrology. Water Science and Application 5, 1–19. 716
Baptista, M., Miranda, J., Omira, R., Antunes, C., 2011. Potential inun-717
dation of Lisbon downtown by a 1755-like tsunami. Natural Hazards and 718
Earth System Science 11 (12), 3319–3326. 719
Barriendos, M., Coeur, D., Lang, M., Llasat, M., Naulet, R., Lemaitre, F., 720
Barrera, A., 1999. Stationarity analysis of historical flood series in France 721
and Spain (14th–20th centuries). Natural Hazards and Earth System Sci-722
ence 3 (6), 583–592. 723
Bayliss, A., Reed, D., 2001. The use of historical data in flood frequency 724
estimation., NERC/Centre for Ecology & Hydrology, Wallingford, UK. 725
Benito, G., D´ıez-Herrero, A., de Villalta, M. F., 2003. Magnitude and fre-726
quency of flooding in the Tagus basin (Central Spain) over the last mil-727
lennium. Climatic Change 58 (1-2), 171–192. 728
Benito, G., Lang, M., Barriendos, M., Llasat, M. C., Franc´es, F., Ouarda,
729
T., Thorndycraft, V., Enzel, Y., Bardossy, A., Coeur, D., et al., 2004. 730
Use of systematic, palaeoflood and historical data for the improvement of 731
flood risk estimation. Review of scientific methods. Natural Hazards 31 (3), 732
623–643. 733
Benito, G., Thorndycraft, V. R., 2006. Palaeoflood hydrology: insight into 734
rare events and extreme flood discharges. La Houille Blanche (5), 91–96. 735
Black, A. R., Law, F. M., 2004. Development and utilization of a national 736
web-based chronology of hydrological events. Hydrological Sciences Journal 737
49 (2). 738
B¨ohm, O., Wetzel, K. F., 2006. Flood history of the danube tributaries lech 739
and islar in the alpine foreland of germany. Hydrological sciences journal 740
51 (2), 784–798. 741
Br´azdil, R., Dobrovoln, P., Elleder, L., Kakos, V., Kotyza, O., Kvˇetoˇn, V.,
742
Mackov´a, J., M¨uller, M., ˇStekl, J., Tolasz, R., Val´aˇsek, H., 2005. Historical
743
and Recent Floods in the Czech Republic., Masaryk University, Czech 744
Hydrometeorological Institute, Brno, Praha, 370 pp. 745
Br´azdil, R., Glaser, R., Pfister, C., Dobrovoln´y, P., Antoine, J.-M.,
Barrien-746
dos, M., Camuffo, D., Deutsch, M., Enzi, S., Guidoboni, E., et al., 1999. 747
Flood events of selected European rivers in the sixteenth century. Climatic 748
Change 43 (1), 239–285. 749
Br´azdil, R., Kundzewicz, Z. W., Benito, G., 2006. Historical hydrology for
750
studying flood risk in Europe. Hydrological Sciences Journal 51 (5), 739– 751
764. 752
Br´azdil, R., Kundzewicz, Z. W., Benito, G., Demar´ee, G., Macdonald, N.,
753
Roald, L. A., 2012. Historical floods in Europe in the past millennium. In: 754
Kundzewicz, Z. W. (ed.): Changes in flood risk in Europe. IAHS Special 755
Publication 10. IAHS Press and CRC Press/Balkema, Wallingford, 121-756
166. 757
Br´azdil, R., M´aˇcka, Z., ˇRezn´ıˇckov´a, L., Soukalov´a, E., Dobrovoln´y, P.,
Gry-758
gar, T. M., 2011a. Floods and floodplain changes of the River Morava, 759
the Str´aˇznick´e Pomorav´ı region (Czech Republic) over the past 130 years.
760
Hydrological Sciences Journal 56 (7), 1166–1185. 761
Br´azdil, R., ˇRezn´ıˇckov´a, L., Val´aˇsek, H., Havl´ıˇcek, M., Dobrovoln´y, P., 762
Soukalov´a, E., ˇReh´anek, T., Skokanov´a, H., 2011b. Fluctuations of floods
763
of the River Morava (Czech Republic) in the 1691–2009 period: interac-764
tions of natural and anthropogenic factors. Hydrological Sciences Journal 765
56 (3), 468–485. 766
Calenda, G., Mancini, C. P., Volpi, E., 2009. Selection of the probabilistic 767
model of extreme floods: The case of the River Tiber in Rome. Journal of 768
Hydrology 371 (1), 1–11. 769
Castellarin, A., Kohnova, S., Gaal, L., Fleig, A., Salinas, J., Toumazis, 770
A., Kjeldsen, T., Macdonald, N., 2012. Review of applied-statistical 771
methods for flood-frequency analysis in Europe. WG2 Milestone Report, 772
COST Action ES0901, NERC/Centre for Ecology & Hydrology, iSBN 773
9781906698324, 122pp. 774
Claps, P., Laio, F., 2008. ARPIEM - Analisi Regionale delle PIEne nei 775
bacini Montani (con applicazione alla valutazione delle piene in Piemonte) 776
(ARPIEM - Regional flood frequency analysis in mountainous basins (with 777
application flood estimation in in Piedmont, Italy). Tech. rep., volume 1, 778
http://www.idrologia.polito.it/piene/. 779
Cohn, T., Lane, W., Baier, W., 1997. An algorithm for computing moments-780
based flood quantile estimates when historical flood information is avail-781
able. Water Resources Research 33 (9), 2089–2096. 782
Cohn, T. A., Stedinger, J. R., 1987. Use of historical information in a 783
maximum-likelihood framework. Journal of Hydrology 96 (1), 215–223. 784
Dezileau, L., Terrier, B., Berger, J., Blanchemanche, P., Latapie, A., Frey-785
dier, R., Bremond, L., Paquier, A., Lang, M., Delgado, J., 2014. A mul-786
tidating approach applied to historical slackwater flood deposits of the 787
gardon river, se france. Geomorphology 214, 56–68. 788
DSI, 2012. Design Guidelines for Flood Hydrology - Ta¸skınlar Hidrolojisi 789
Tasarım Rehberi. Guideline no. 008, State Hydraulic Works (DSI), Ankara, 790
Turkey. 791
Dub, O., Nemec, J., 1969. Hydrologie. technick´y pruvodce c.34. ( Hydrology.
792
Technical Guidelines no 34.). Tech. rep., SNTL, Praha. 793
DVWK, 1999. Wahl des Bemessungshochwassers. DVWK Schriften Heft 794
101, Deutscher Verband f¨ur Wasserwirtschaft und Kulturbau, Verlag Paul
795
Parey, Hamburg. 796
DWA, 2008. Erschließung und Einbeziehung historischer Informationen f¨ur
797
die Ermittlung extremer Hochwasserabfl¨usse; Fallbeispiele und
Empfehlun-798
gen. DWA-Themenheft 90 S, German Association for Water, Wastewater 799
and Waste, Hennef. 800
DWA, 2012. Ermittlung von Hochwasserwahrscheinlichkeiten (Estimation of 801
flood probabilities). Merkblatt DWA-M 552, German Association for Wa-802
ter, Wastewater and Waste. 803
El Adlouni, S., Ouarda, T., Zhang, X., Roy, R., Bob´ee, B., 2007. Generalized
804
maximum likelihood estimators for the nonstationary generalized extreme 805
value model. Water Resources Research 43 (3). 806
Elleder, L., Herget, J., Roggenkamp, T., Nießen, A., 2013. Historic floods 807
in the city of Prague - a reconstruction of peak discharges for 1481–1825 808
based on documentary sources. Hydrology Research 44 (2), 202–214. 809
Ga´al, L., Kohnov´a, S., Szolgay, J., Hlavˇcov´a, K., 2013. Assessing t-year flood
810
quantiles by means of Bayesian MCMC simulations: A case study at the 811
Myjava River, Slovakia. In: In Comprehensive Flood Risk Management: 812
Research for policy and practice. CRC Press/Balkema, London, pp. 169– 813
176, iSBN 978-0-415-62144-1. p. 169-176. 814
Ga´al, L., Szolgay, J., Kohnov´a, S., Hlavˇcov´a, K., Viglione, A., 2010.
Inclu-815
sion of historical information in flood frequency analysis using a Bayesian 816
MCMC technique: a case study for the power dam Orl´ık, Czech Republic. 817
Contributions to Geophysics and Geodesy 40 (2), 121–147. 818
Gaume, E., Ga´al, L., Viglione, A., Szolgay, J., Kohnov´a, S., Bl¨oschl, G., 2010.
819
Bayesian MCMC approach to regional flood frequency analyses involving 820
extraordinary flood events at ungauged sites. Journal of Hydrology 394 (1), 821
101–117. 822
Gilli, A., Anselmetti, F. S., Glur, L., Wirth, S. B., 2013. Lake sediments as 823
archives of recurrence rates and intensities of past flood events. In: Dating 824
Torrential Processes on Fans and Cones. Springer, pp. 225–242. 825
Glaser, R., Riemann, D., Sch¨onbein, J., Barriendos, M., Br´azdil, R., Bertolin,
826
C., Camuffo, D., Deutsch, M., Dobrovoln´y, P., van Engelen, A., et al.,
827
2010. The variability of European floods since AD 1500. Climatic Change 828
101 (1-2), 235–256. 829
Glaser, R., Stangl, H., Lang, M., 2004. Floods in Central Europe since AD 830
1300 and their regional context. La Houille Blanche 5, 43–49. 831
Gregory, K. J., Benito, G., 2003. Palaeohydrology: understanding global 832
change. John Wiley & Sons Ltd. 833
Guo, S., Cunnane, C., 1991. Evaluation of the usefulness of historical and 834
palaeological floods in quantile estimation. Journal of Hydrology 129 (1), 835
245–262. 836
Guzzetti, F., Cardinali, M., Reichenbach, P., 1996. Map of sites historically 837
affected by landslides and floods. CNR Gruppo Nazionale per la Difesa 838
dalle Catastrofi Idrogeologiche Publication number 1356, scale 1:1 200 000. 839
Guzzetti, F., Tonelli, G., et al., 2004. Information system on hydrological 840
and geomorphological catastrophes in Italy (SICI): a tool for managing 841
landslide and flood hazards. Natural Hazards and Earth System Science 842
4 (2), 213–232. 843
Herget, J., Meurs, H., 2010. Reconstructing peak discharges for historic flood 844
levels in the city of Cologne, Germany. Global and Planetary Change 845
70 (1), 108–116. 846
Hosking, J., Wallis, J., 1986. Paleoflood hydrology and flood frequency anal-847
ysis. Water Resources Research 22 (4), 543–550. 848
Hosking, J., Wallis, J. R., 1997. Regional Frequency Analysis: An approach 849
based on L-moments. Cambridge University Press, iSBN 0521430453, 850
Cambridge, UK. 851
Huang, C. C., Pang, J., Zha, X., Zhou, Y., Su, H., Zhang, Y., Wang, H., 852
Gu, H., 2012. Holocene palaeoflood events recorded by slackwater deposits 853
along the lower jinghe river valley, middle yellow river basin, china. Journal 854
of Quaternary Science 27 (5), 485–493. 855
Jeon, J.-J., Kim, Y.-O., Kim, Y., 2011. Expected probability weighted mo-856
ment estimator for censored flood data. Advances in Water Resources 857
34 (8), 933–945. 858
Jim´enez- ´Alvarez, A., Garc´ıa-Monta˜n´es, C., Mediero, L., Inicio, L., Garrote,
859
J., 2012. Map of maximum flows of intercommunity basins in Spain., Re-860
vista De Obras P´ublicas, (3533), 7-32.
861
Jin, M., Stedinger, J. R., 1989. Flood frequency analysis with regional and 862
historical information. Water Resources Research 25 (5), 925–936. 863
Jones, A., Brewer, P. A., Macklin, M. G., 2010. Geomorphological and sed-864
imentological evidence for variations in holocene flooding in welsh river 865
catchments. Global and Planetary Change 70 (1), 92–107. 866
Ka˘sp´arek, L., 1984. O povodn´ıch z let 1872 a 1981 na Litavce a jejich v´yznam
867
pro odhad N-let´ych prutoku (On floods at Litavka in 1872-1981 and their
868
importance for the estimation of N-years floods). Pr´ace a studie (Works
869
and studies), Czech Hydrometeorological Institute, Prague. 870
Kobold, M., 2011. Comparison of floods in September 2010 with registered 871
historic flood events. Ujma 25, 48–56, [In Slovenian]. 872
Kundzewicz, Z. W., Pi´nskwar, I., Brakenridge, G. R., 2013. Large floods in
873
Europe, 1985–2009. Hydrological Sciences Journal 58 (1), 1–7. 874