Calibration of model parameters for the cyclic response of
end-plate beam-to-column steel-concrete composite joints
Pedro Nogueiro*
ISISE, Department of Applied Mechanics, Escola Superior de Tecnologia e Gestão,
Polytechnic Institute of Bragança, Campus de Santa Apolónia, 5300 Bragança, Portugal ([email protected])
Luís Simões da Silva
ISISE, Department of Civil Engineering, University of Coimbra – Polo II Pinhal de Marrocos, 3030 Coimbra, Portugal ([email protected])
Rita Bento
Department of Civil Engineering, Instituto Superior Técnico Av. Rovisco Pais, Lisboa, Portugal ([email protected])
Rui Simões
ISISE, Department of Civil Engineering, University of Coimbra – Polo II Pinhal de Marrocos, 3030 Coimbra, Portugal ([email protected])
(Received November 2, 2007, Accepted January 16, 2009)
Abstract. Composite joints, considering the composite action of steel and concrete, exhibit, in general, high strength and high ductility. As a consequence, the use of this type of joint has been increasing in many countries, especially in those that are located in earthquake-prone regions. In this paper, a hysteretic model with pinching is presented that is able to reproduce the cyclic response of steel and composite joints. Secondly, the computer implementation and adaptation of the model in a spring element within the computer code Seismosoft is described. The model is subsequently calibrated using a series of experimental test results for composite joints subjected to cyclic loading. Finally, typical parameters for the various joint configurations are proposed.
Keywords :structural engineering; composite structures; buildings; component method; beam-to-col-umn joints; dynamic behaviour; seismic behaviour; joint model.
1. Introduction
The global behaviour of a composite steel-concrete structure depends greatly on the composite
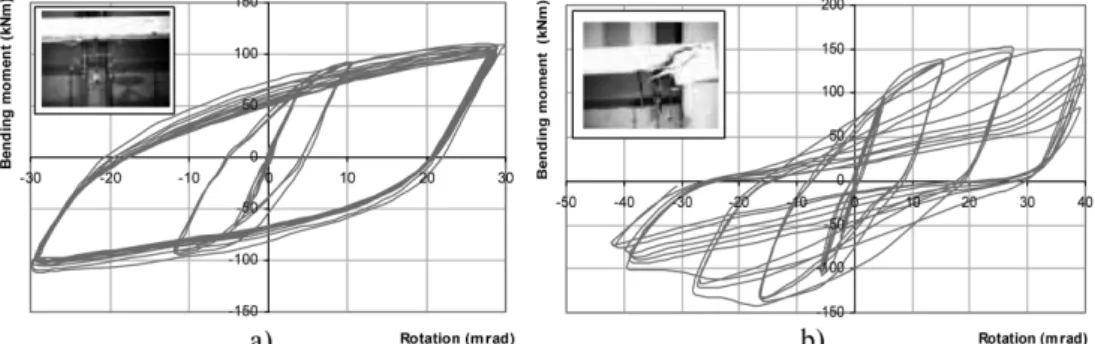
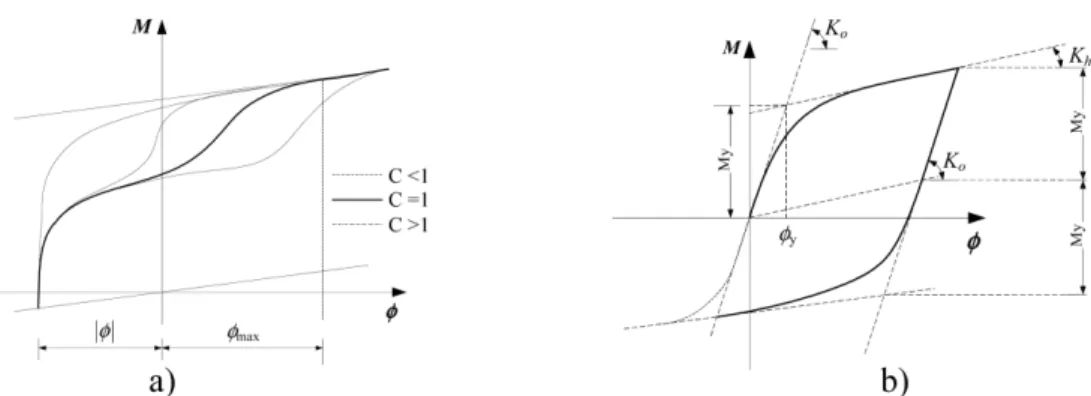
behaviour of the joints. Several studies have demonstrated that composite connections exhibit adequate mechanical properties, such as strength, ductility and energy dissipation capacity, for its use in structures located in seismic areas. The behaviour of usual composite joint typologies under cyclic loading, representative of the effects of a seismic event, is characterized by hysteretic loops with progressive degradation of strength and stiffness that eventually lead to failure of the joint. Typically, seismic events provoke relatively high amplitudes of rotation in the joint area, so that steel and concrete repeatedly reach the plastic range and the joint fails after a relatively small number of cycles. This typical behaviour is usually called oligocyclic fatigue, in close analogy with the behaviour of steel under repeated cyclic loading stressed into the plastic regime (Fig. 1a).
Predicting the behaviour of composite joints is quite complex, because it combines several phenomena such as material non-linearity (plasticity, strain-hardening, cracking of concrete), non-linear contact and slip, geometrical non-linearity (local instability), residual stress conditions and complicated geometrical configurations. Under cyclic loading, this behaviour is further complicated by successive static loading and unloading, as illustrated in Fig. 1b, where the characteristic pinching effect in the loading branches is clearly visible. For static monotonic situations it is nowadays possible to accurately predict the moment-rotation response of a fairly wide range of joint configurations by applying the principles of the component method (Eurocode 4 – EN 1994-1-1, 2004; Simões da Silva et al. 2001). However, this is not the case for the cyclic situation. In this case, the usual approach is to develop multi-parameter mathematical expressions that are able to reproduce the range of hysteretic behaviours for a given group of composite joint typologies. Subsequently, the values of the parameters are calibrated to satisfactorily correlate to a range of section sizes for a given group of joint typologies.
Historically, two mathematical formulas have provided the basis for the majority of the models that have been proposed in the literature: Ramberg-Osgood type mathematical expressions (Ramberg and Osgood 1943), that usually express strain (generalized displacement) as a non-linear function of stress (generalized force) and Richard-Abbott type mathematical expressions (Richard and Abbott 1975), that usually relate generalized force (stress) to generalized displacement (strain).
Ramberg-Osgood based mathematical models were first used by Popov and Pinkey (1968) to model hysteresis loops of non-slip specimens and later applied to model the skew symmetric moment-rotation hysteretic behaviour of connections made by direct welding of flanges with or without connection plate (Popov and Bertero 1973). Mazzolani (1988) developed a comprehensive model based on the Ramberg-Osgood expressions that was able to simulate the pinching effect, later modified by Simões et al. (2001) to allow for pinching to start in the unloading zone. It is noted that models based on the
Osgood expressions present the disadvantage of expressing strain as a function of stress, which clearly complicates its integration in displacement-based finite element codes (that constitute the majority of the available applications) or the direct application for the calibration and evaluation of test results, almost always carried out under displacement-control once they reach the non-linear stage.
The Richard-Abbott expression was first applied to the cyclic behaviour of joints by De Martino et al. (1984). Unfortunately, that implementation was not able to simulate the pinching effect (Simões et al. 2001). Subsequently, Della Corte et al. (2000) proposed a new model, also based on the Richard-Abbott expressions, that was capable of overcoming this limitation and simulate the pinching effect, as well as strength and stiffness deterioration and the hardening effects.
Since the end of the 1980’s, various research projects on the cyclic behaviour of steel-concrete composite joints were undertaken in several research centres, comprising a total number of 19 research projects and 72 individual experimental tests. These tests are summarized in Tables 1 to 3 and comprise various configurations, ranging from welded configurations to end-plate typologies. In general, the objective of these cyclic tests was the study of the seismic performance of the joints, following the observation of failures resulting from the Kobe and the Northridge seismic events.
Previous work by the authors (Nogueiro et al. 2007) was developed with the objective of applying and calibrating the model developed by Della Corte et al. (2000), based on the Richard-Abbott mathematical
Table 1 Welded steel-concrete composite joints
Total number of research projects: 5 Total number of tests: 18
Total number of different load histories: 2
Authors (date) N.
o of tests Joint Characterization Load History Main parameters investigated
Sheikh et al.
(1989) 8
Steel beam which is continuous through the joint was a hybrid built-up section, with roughly 40% of the shear strength of a rolled shape (W18 × 76) and similar moment capacity. Column in concrete (510 × 510), designed to exceed the connection strength.
(2)
Evaluation of strength and stiff-ness; confinement effect of stirrups in the nodal zone.
Plumier and
Schleich (1993) 6
Three external joints and three inter-nal joints, combining steel elements, composite column and beam. Beam in HEA260 and columns in HEB300.
(1)
Contribution of the shear panel in the energy dissipation. Study the strength and rotation capac-ity joint.
Pradhan and Bouwkamp (1994)
-Fully welded joints. Beam section HEA260 and column section HEB300. Some tests are with beam and col-umn filled-in reinforced concrete.
-Column shear web panel zone, shear panel thickness and contri-bution of the concrete.
Bursi and
Ferrario (2003) 3
Steel concrete welded beam-to-col-umn external joint. IPE330 and IPE400 beam sizes and HEB360 column size
(1)
Seismic performance of composite beam.
Calado
(2003) 1
Welded steel composite beam (IPE300) to column (HEB200) external joint. (1)
model, with a series of experimental test results for steel joints subjected to cyclic loading. In a previous work, Nogueiro et al. (2003) investigated the effect of pinching on the seismic response of steel frames and concluded that it leads to an increase of the joint rotation of about 20%, thus increasing the ductility demand on the joints to avoid failure. Besides the brief presentation of a hysteretic model with pinching based on the Richard-Abbott mathematical model and developed by Della Corte et al. (2000), it is the objective of this paper: (i) to describe the computer implementation and adaptation of this model in a spring element within the computer code SeismoStruct (2007); (ii) to apply and calibrate the model
Table 2 Set angle steel-concrete composite joints
Total number of research projects: 6 Total number of tests: 22
Total number of different load histories: 2
Authors (date) N.o of tests Joint Characterization Load History Main parameters investigated
Lee and Lu (1989) 3
Two exterior joint with the beam flange welded to columns (W10 × 60) and (W12 × 65). One interior joint, with the beam flange welded to col-umn (W12 × 65).
All beams are W18x35.
(1)
Study the stiffness, strength, ductil-ity and energy dissipation capacductil-ity, emphasising the effects of the com-posite slab and the panel zone deformation.
Leon
(1990) 7
Four internal types of composite semi-rigid connections combining seat angle, web clips and floor slab. Beams in W14 × 38, W21 × 57 and columns in W14 × 120 and W14 × 145.
(3)
Seismic performance, more specifi-cally the increasing of joint strength and stiffness by means of slab rein-forcement, and indication for this over-strength use. Study of joint ductility and rotation capacity.
Plumier and Schleich (1993) 8
Four external joints and four internal joints, combining composite elements some of them with slab.
Beam in HEA260 and columns in HEB300.
(1)
Contribution of the shear panel in the energy dissipation. Study the strength and rotation capacity joint.
Amadio et al.
(1994) 1
Internal joint, with cleated connec-tion between the beam lower flange and the column. Beam IPE330 and column HEB330. (1)
Cyclic response of the semi-rigid joints and seismic resistance capac-ity of the frames studied. Ductilcapac-ity and strength of the joints, avoiding the failure of bolts and in the welds or local instabilities.
Leon et al.
(1998) 2
Interior joints, with beam W27x94 and the column W14 × 211, the panel zone incorporate four continuity plates and doubler plate on both sides of the column web. The beam flanges are welded to the column.
(3)
Investigate the modes of failure in the region of the bottom flange, specially the effect of the compos-ite concrete slab.
Calado
(2003) 1
Bolted top, seat and web angle steel composite external joint with IPE300 beam size and HEB200 column size.
(1)
with a series of experimental test results for composite joints (described in Tables 1 to 3) subjected to cyclic loading; and (iii) to compare and propose typical parameters for the chosen joint configurations.
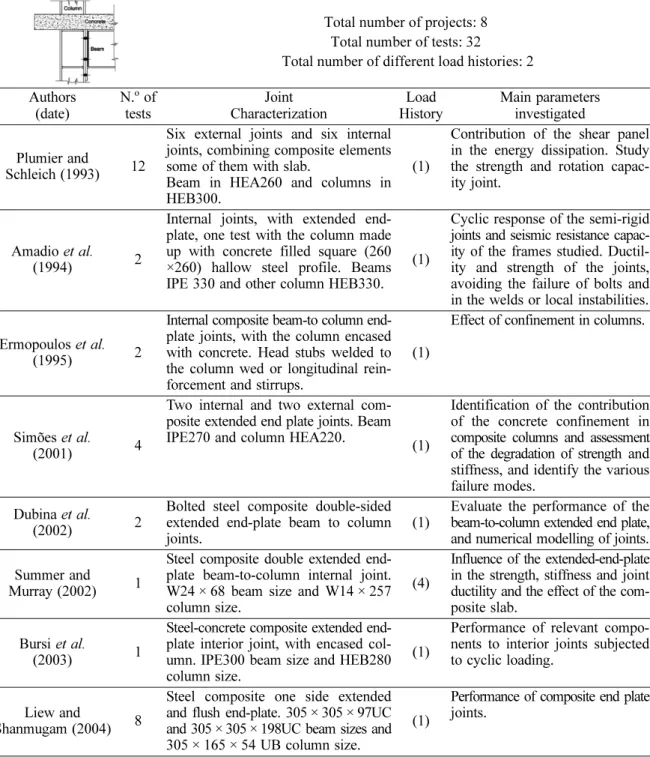
Table 3 End-plate steel-concrete composite joints
Total number of projects: 8 Total number of tests: 32 Total number of different load histories: 2
Authors (date)
N.o of
tests Joint Characterization Load History Main parameters investigated Plumier and
Schleich (1993) 12
Six external joints and six internal joints, combining composite elements some of them with slab.
Beam in HEA260 and columns in HEB300.
(1)
Contribution of the shear panel in the energy dissipation. Study the strength and rotation capac-ity joint.
Amadio et al.
(1994) 2
Internal joints, with extended end-plate, one test with the column made up with concrete filled square (260 ×260) hallow steel profile. Beams IPE 330 and other column HEB330.
(1)
Cyclic response of the semi-rigid joints and seismic resistance capac-ity of the frames studied. Ductil-ity and strength of the joints, avoiding the failure of bolts and in the welds or local instabilities.
Ermopoulos et al.
(1995) 2
Internal composite beam-to column end-plate joints, with the column encased with concrete. Head stubs welded to the column wed or longitudinal rein-forcement and stirrups.
(1)
Effect of confinement in columns.
Simões et al.
(2001) 4
Two internal and two external com-posite extended end plate joints. Beam IPE270 and column HEA220.
(1)
Identification of the contribution of the concrete confinement in composite columns and assessment of the degradation of strength and stiffness, and identify the various failure modes.
Dubina et al.
(2002) 2
Bolted steel composite double-sided extended end-plate beam to column joints.
(1)
Evaluate the performance of the beam-to-column extended end plate, and numerical modelling of joints.
Summer and
Murray (2002) 1
Steel composite double extended end-plate beam-to-column internal joint. W24 × 68 beam size and W14 × 257 column size.
(4)
Influence of the extended-end-plate in the strength, stiffness and joint ductility and the effect of the com-posite slab.
Bursi et al.
(2003) 1
Steel-concrete composite extended end-plate interior joint, with encased col-umn. IPE300 beam size and HEB280 column size.
(1)
Performance of relevant compo-nents to interior joints subjected to cyclic loading.
Liew and
Shanmugam (2004) 8
Steel composite one side extended and flush end-plate. 305 × 305 × 97UC and 305 × 305 × 198UC beam sizes and 305 × 165 × 54 UB column size.
(1)
Performance of composite end plate joints.
2. Modified Richard-Abbott model
According to this model (Della Corte et al. 2000), the loading curve for a generic branch of the moment-rotation curve of a joint is given by the following equation:
(1)
where M0a=Mn+M0p. The unloading curve is obtained in the same way, replacing (Mn, φn) by (Mp, φp)
and the parameters M0a, ka and kpa by the corresponding values evaluated at unloading, M0d, kd and kpd.
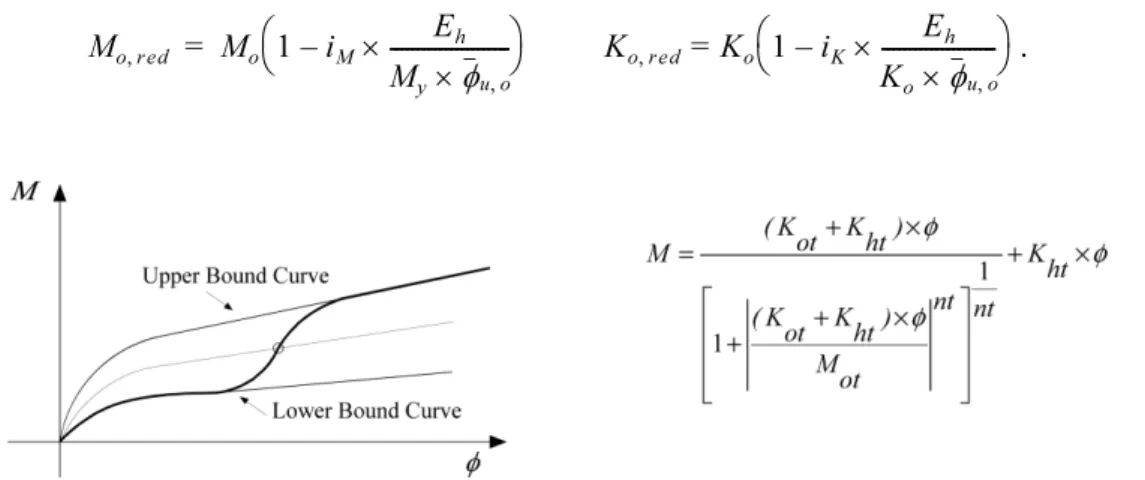
To describe the pinching phenomenon, two limit curves are introduced, that represent a lower and an upper bounds to possible M-φ values. Both curves have a Richard-Abbott type law, and are characterised by parameters Kop, Mop, Khp, np (lower bound curve) and Ko, Mo, Kh, n (upper bound curve). Additionally,
any generic point (M,φ) along the real path is also considered to belong to a Richard-Abbott type curve, where the relevant parameters are defined as follows:
Kot=Kop+ (Ko−Kop)×t (2a)
Mot=Mop+ (Mo−Mop)×t (2b)
M Mn (ka–kpa)⋅(φn–φ) 1 (ka–kpa)⋅(φn–φ)
M0a
---N
+ 1/N
---– –kpa⋅(φn–φ)
=
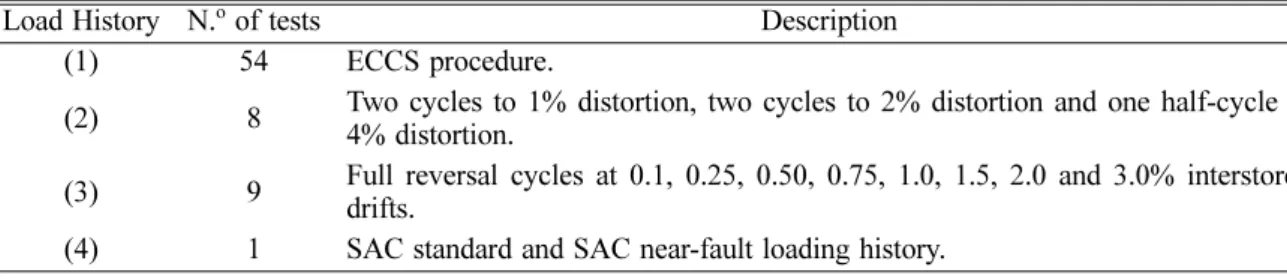
Table 4 Cyclic load histories
Load History N.o of tests Description
(1) 54 ECCS procedure.
(2) 8 Two cycles to 1% distortion, two cycles to 2% distortion and one half-cycle to 4% distortion.
(3) 9 Full reversal cycles at 0.1, 0.25, 0.50, 0.75, 1.0, 1.5, 2.0 and 3.0% interstorey drifts.
(4) 1 SAC standard and SAC near-fault loading history.
Kht=Khp+ (Kh–Khp)×t (2c)
nt=np+ (n–np)×t (2d)
The parameter t, ranging in the interval [0,1], defines the transition law from the lower bound to the upper bound curve. It must reproduce, as closely as possible, the shape of the experimental curves and is given by:
(3)
where t1, t2 and φlim are three experimentally calibrated parameters. Fig. 3 illustrates, qualitatively, the
resulting pinching behaviour with reference to one single excursion from the origin.
In case of a generic deformation history, the parameter φlim is related to the maximum experienced
deformation in the direction of the loading branch to be described. It is evaluated according to the following relationship:
(4)
where is the absolute value of the deformation corresponding to the starting point of the current excursion, φmax is the maximum absolute value of the deformation experienced in the previous loading history, in the direction of loading branch to be described (Fig. 4a) and C is a calibration parameter. The unloading branch is assumed to be linear with a slope equal to the initial stiffness Ko up to the
interception with the straight line obtained drawing a parallel to the hardening line going through the origin. This allows the Bauschinger effect to be considered.
Cyclic action in the inelastic range produces accumulation of plastic deformation, until ductility of the system is locally exhausted and failure occurs due to fracture. In some cases, the repetition of loading is accompanied by degradation of the structural response because of deterioration of its mechanical properties. This can be taken into consideration both for strength (Mo,red) and stiffness
(Ko,red) using the following expressions:
. (5)
t (φ/φlim)
t1
φ/φlim ( )t1+1
---t2
=
φlim = C(φo +φm ax)
φo
Mo red, Mo 1 iM
Eh
My×φu o,
---×
–
⎝ ⎠
⎛ ⎞ K
o red, Ko 1 iK
Eh
Ko×φu o,
---×
–
⎝ ⎠
⎛ ⎞
= =
is the corresponding ultimate value in the case of one single excursion from the origin (monotonic loading), Eh is the hysteretic energy accumulated in all previous experienced excursions,
My represents the conventional yield resistance of the joint, Ko the initial stiffness as defined in the Fig. 4b
and coefficient i is an empirical parameter related to damage rate.
Hardening due to cyclic plastic deformation is considered to be isotropic. Besides, experimental results of constant deformation amplitude tests for joints not exhibiting strength deterioration show that cyclic hardening grows up in few cycles and then becomes stable.
Therefore, the following assumption is made:
Mo,inc=Mo if φmax≤φy
(6)
Mo and Mo,inc are the initial and increased value of strength, respectively; φmax is the maximum value of
deformation reached in the loading history (in either positive or negative direction); φy is the
conventional yielding value of deformation (see Fig. 4b); Hh is an empirical coefficient defining the
level of the isotropic hardening (Filippou et al. 1983). The above formulation practically corresponds to translate the asymptotic line of the original Richard-Abbott equation (De Martino et al. 1984), as a function of the extent of the plastic deformation.
3. Computational Implementation
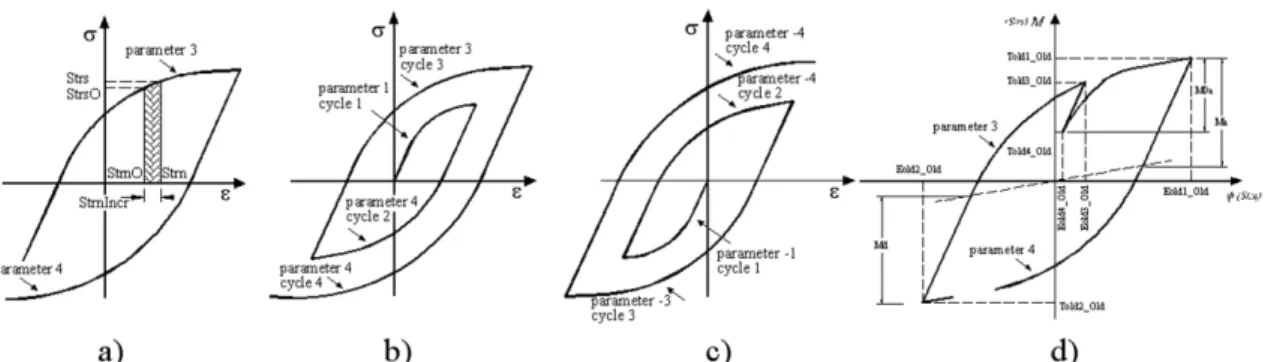
The numerical implementation of the hysteretic model described above was carried out using the Delphi (Delphi 7, 2002) development platform. A six degree-of-freedom spring element was implemented in the structural analysis software SeismoStruct (2007). The implementation comprised two major parts. The first consists of the management of the hysteretic cycles, where a clear distinction between positive and negative moment must be made because of possible asymmetry of joint response under hogging or sagging bending. An illustrative flowchart of the cycle management is shown in Fig. 5.
The second part of the implementation relates to the development of the code for each cycle. Several
φu o,
Mo inc, Mo 1 Hh
φmax–φy φy
---×
+
⎝ ⎠
⎛ ⎞ if φ
max≥φy
=
possibilities must be considered, depending on the starting bending moment (positive or negative) and the sign of the strain increment (positive or negative), as can be seen in the Figs. 6a, b and c.
In total, 30 parameters have to be defined for this model, fifteen for the ascending branches (subscript a) and fifteen for the descending branches (subscript d): Ka (and Kd) is the initial stiffness, Ma (and Md)
is the strength, Kpa (and Kpd) is the post limit stiffness, na (and nd) is the shape parameter, all these for
the upper bound curve (see Fig. 1), Kap (and Kdp) is the initial stiffness, Map (and Mdp) is the strength,
Kpap (and Kpdp) is the post limit stiffness, nap (and ndp) is the shape parameter, all these for the lower
bound curve, t1a and t2a (and t1d and t2d) are the two parameters related to the pinching, Ca (and Cd) is the
calibration parameter related to the pinching, normally equal to 1 (see Fig. 4a), iKa (and iKd) is the
Fig. 5 Flowchart for the management of hysteretic cycles
calibration coefficient related to the stiffness damage rate, iMa (and iMd) is the calibration coefficient
related to the strength damage rate, Ha (and Hd) is the calibration coefficient that defines the level of
isotropic hardening and Emaxa (and Emaxd) is the maximum value of deformation.
The model must deal with all kinds of loads, especially those resulting from seismic action where the loading and unloading branches can be either large or small. In particular, the model must be prepared to consider an inversion of loading as shown in Fig. 6d) for both the positive and the negative starting points. The versatility of the model may be confirmed elsewhere (Nogueiro et al. 2007).
4. Application to composite joints
4.1. Description of the experimental tests
In order to establish reliable parameters for a range of end-plate beam-to-column composite joint configurations and to validate the accuracy of the model, a group of well-documented experimental results was selected from the literature. These tests were performed by Simões et al. (2001), Dubina et al. (2002) and Liew et al. (2004) and are summarized in Table 5.
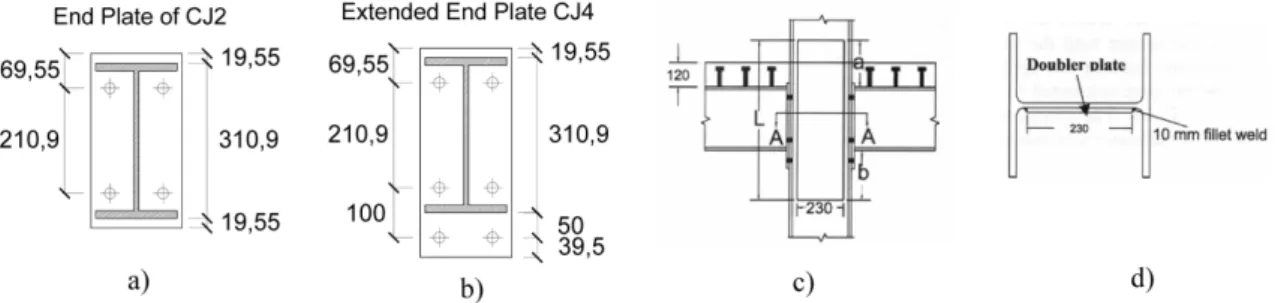
Tests 1 and 2 correspond to external joints. All other tests correspond to internal joints. Tests 2 and 4 have the column encased in concrete. Tests 1 to 4 have 12 mm thick end-plates and M20 bolts, grade 8.8 and the steel is grade S235. For tests 5 to 9 the steel is grade S275. Tests 5, 6 and 7 have M20 preloaded bolts, grade 10.9 and the end-plate is double extended and 20 mm thick. All cyclic tests for internal nodes are loaded in phase, except for test 7. Test 8 has the column web stiffened with a doubler plate (Fig. 9d) and a flush end-plate connection. Test 9 corresponds to an extended end plate connection. For tests 8 and 9 the end-plate is 12 mm thick and the bolts are M20, Grade 10.9. All concrete slabs have 12 cm thickness and continuous steel reinforcement around the column. Figs. 7 to 9 illustrate the joint details.
4.2. Application of the modified Richard-Abbot model
4.2.1. Introduction
The application of the model should be carried out in two consecutive steps. Firstly, the initial
Table 5 Experimental tests
No
Test Ref. Author Type Beam Column hc
cm M+
y
KNm M
-y
KNm K+
y
KNm/rad K
-y
stiffness, moment resistance and post-limit stiffness should be obtained from static monotonic tests. This was the case for all tests except for tests 8 and 9. Subsequently, the cyclic tests allow the calibration of the remaining parameters such as strength and stiffness deterioration coefficients, the isotropic hardening and the pinching parameters. The following sub-sections illustrate the application of the model to the selected tests.
4.2.2. End-plate joints 1 to 4
The cyclic loading strategy applied to joints 1 to 4 is illustrated in Fig. 10. For the external node joints 1 and 2 and for the cycles with the largest amplitude, it led to maxima total joint rotations of about 40 mrad, thus matching the Eurocode 8 ductility requirements (EN 1998-1, 2004) for dissipative joints. For joints 3 and 4 (internal node with symmetrical loading), the maxima total joint rotations reached about 25~30 mrad, below the requirements of Eurocode 8. However, these joints did not fail, the reduced rotations resulting from limitations in the loading equipment (Simões et al. 2001).
Fig. 7 Joints 1 (a), 2 (b), 3 (c) and 4 (d)
Fig. 8 Bare steel joint 5 and 6 (a, b) and composite joint 7 (c, d)
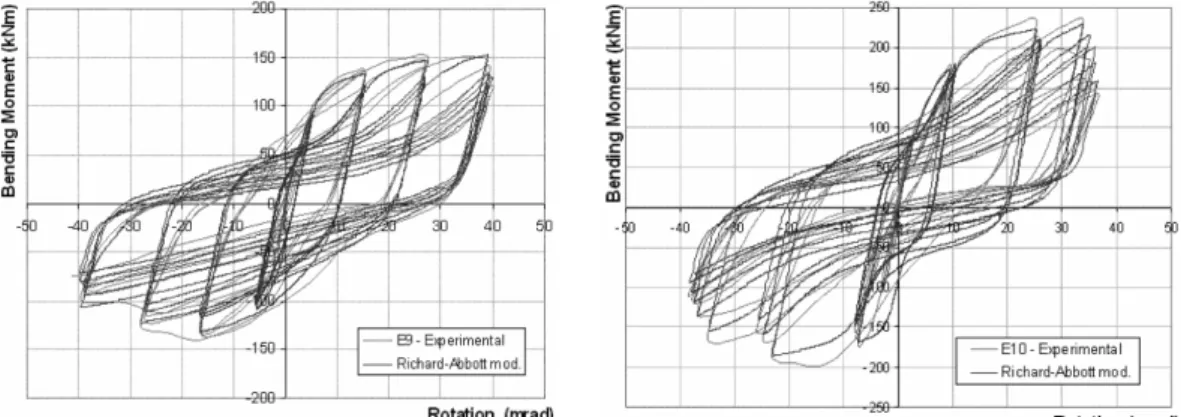
For test 1 (test reference E9) a strong degradation of its mechanical properties (Fig. 11) due to bending of the end-plate and the column flange in the tension zone at the bottom level of the beam and the crushing of the concrete in compression at the interface between the slab and the column flange can be observed.
The contribution of the column web panel distortion to the total joint rotation in test 2 (E10) is not so obvious, when compared to the test E9, due to the additional resistance provided by the encasing concrete.
Fig. 11 shows the results obtained using the modified Richard Abbott model for tests 1 and 2 (test reference E9 and E10). They show good agreement with the experimental curves, as seen in Figs. 12 and 13. Figs. 12 and 13 compare the values of the energy dissipated in each cycle and the strength values for the two tests. The error is quite insignificant for the cycles where the values of energy dissipated and strength are high. The energy dissipated and the strength of the joints demonstrate the good cyclic performance for these composite joint typologies.
The internal joints 3 and 4 (test reference E11 and E12) presented high ductility with similar response for hogging and sagging moments. The strength degradation was low, also because the maximum amplitude of deformation was not very high. The numerical curve shows a good agreement with the experimental results, as can be seen in Fig. 14. The conclusions in terms of energy dissipated and strength values are the same as for the previous tests. Moreover, these two tests presented a more stable
Fig. 10 Cyclic loading strategy for joints 1 to 4
hysteretic behaviour.
Figs. 15 and 16 illustrate the good agreement between experimental and numerical results in terms of energy dissipation and strength.
4.2.3. End-plate joints 5 to 7
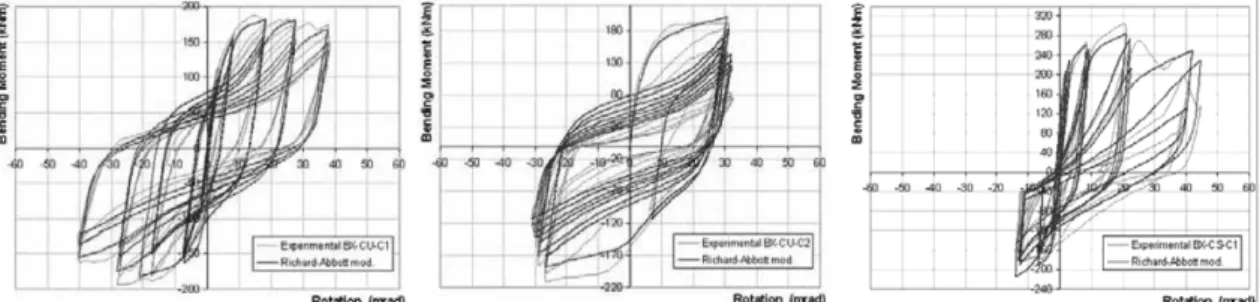
The cyclic loading strategy applied to joints 5 to 7 is illustrated in Fig. 17, as well as the application of the Richard-Abbott model to the composite joints tested by Dubina et al. (2002). The maxima total joint rotations reached were 40 mrad, 33 mrad and 40 mrad, respectively, thus matching the Eurocode 8
Fig. 12 Energy dissipated in each cycle for joints 1 and 2
Fig. 13 Strength reached in each cycle for joints 1 and 2
ductility requirements for dissipative joints.
The first two joints (joints 5 and 6) are structurally identical, but subjected to different cyclic loading procedures. For test 5, the ECCS procedure was adopted, while for test 6 a constant amplitude loading procedure was used. While joints 5 and 6 are steel joints, joint 7 is composite with the addition of a composite slab. For this test, the load strategy is asymmetrical, as can be seen in Fig. 17. For positive bending moments the deformation reached 40 mrad and for negative bending moments the deformation reached only 15 mrad.
Globally, for all three tests, the model is able to accurately reproduce the experimental results, as can be seen in Figs. 18, 19 in terms of energy dissipation and strength.
Fig. 15 Energy dissipated in each cycle for joints 3 and 4
Fig. 16 Strength reached in each cycle for joints 3 and 4
4.2.4. End-plate joints 8 to 9
In the tests performed by Liew et al. (2004), the mode failure for joint 8 was excessive panel zone shear deformation and concrete crushing. The spalling of the white wash in the panel zone indicates extensive yielding of the column web. Since joint 9 was a bottom extended end plate, the tensile resistance of the bottom bolts was increased because of the additional bolt row and thus the main effect was an increase of the positive moment resistance. The failure modes observed included tension cracking of the column
Fig. 18 Energy dissipated in each cycle for joints 5, 6 and 7
web, concrete crushing, end plate bending, yielding of bolt and column web panel in shear.
The cyclic loading strategy applied to joints 8 to 9 led to the hysteretic curves illustrated in Fig. 20. The numerical model is able to reproduce adequately the experimental results. The maxima total joint rotations reached were 45 mrad and 50 mrad, respectively, thus matching the Eurocode 8 ductility requirements for dissipative joints. For both joints the ECCS load strategy was followed. The deformation reached was high, leading to high values of energy dissipated. The hysteretic behaviour of joint 9 is more symmetrical than the other, due to the bottom extended end-plate.
Figs. 21,22 illustrate the good agreement between experimental and numerical results in terms of energy dissipation and strength.
4.3. Proposal of hysteretic model parameters for composite end-plate beam-to-column joints
Tables 6 and 7 summarize the results, for all parameters and for the nine tests.
Examination of the variation of the non-dimensional properties for the nine tests reveals that, except for tests 3 and 4 that present some deviations from the remaining tests (because they were only subjected to moderate rotations and did not reach collapse), the structural properties for strength and stiffness were fairly constant. These values can be seen in the last column of Tables 6 and 7. For the calibration parameters, it was not possible to find a clear tendency. This results from the small number of tests that are used and the variation of joint characteristics. Thus, for these parameters, a range of values is presented that covers all tested joints.
Fig. 20 Hysteretic curves for joints 8 and 9
According to Eurocode 8 (EN 1998-1, 2004), dissipative semi-rigid and/or partial strength connections are permitted, provided that all of the following requirements are verified:
a) the connections have a rotation capacity consistent with the global deformations;
b) members framing into the connections are demonstrated to be stable at the ultimate limit state (ULS); c) the effect of connection deformation on global drift is taken into account using nonlinear static (pushover) global analysis or non-linear time history analysis.
Additionally, (i) the connection design should be such that the rotation capacity of the plastic hinge region θp is not less than 35 mrad for structures of high ductility class (DCH) and 25 mrad for structures of medium ductility class (DCM) with q> 2. The rotation θp is defined as (see Fig. 23)
(7)
where δ is the beam deflection at midspan and L is the beam span and should not include the column elastic deformation; (ii) the rotation capacity of the plastic hinge region θp should be ensured under cyclic loading without degradation of strength and stiffness greater than 20%. (this requirement is valid
θp = δ /0 5, L
Table 6 Joint parameters for all tests for the ascending branches
Test Nº 1 2 3 4 5/6 7 8 9** Ref. Value
KaKNm/rad 24570 36950 16500 34400 36870 27648 32697 102500 K+y
MaKNm 130 200 85 117 170 170 210 240 1.2×M+y
KpaKNm/rad 600 1025 825 1700 1100 1000 1300 3000 0.03×K+y
na 2 2 2 2 2 2 2 2 2
KapKNm/rad 24570 36950 16500 34400 36870 27648 32697 102500 K+y
MapKNm 70 140 40 60 100 100 120 1** 0.65×Ma
KpapKNm/rad 600 1025 825 1700 1100 1000 1300 3000 0.03×K+y
nap 1 1 1 1 1 1 1 1 1
t1a 15 10 6 10 15 15 15 15 6 < ... < 15
t2a 0.5 0.5 0.15 0.15 0.5 0.1 0.1 0.2 0.15 < ... < 0.5
Ca 1 1 1 1 1 1 1 1 1
iKa 15 20 3 15 25 30 15 25 3< ... < 25
iMa 0.15 0.25 0.02 0.01 0.10 0 0 0.4 0.01< ... < 0.25
Ha 0.07 0.09 0.05 0.02 0.02 0.04 0.03 0.02 0.01< ... < 0.09
Emaxarad 0.1 0.1 0.1 0.1 1 0.01 0.1 0.1 0.1
independently of the intended location of the dissipative zones); and (iii) the column web panel shear deformation should not contribute for more than 30% of the plastic rotation capability θp.
Table 8 shows that application of these criteria to joints 1 to 9 are approximately in line with the eurocode requirements. The column web panel contribution could not be verified because of lack of experimental data.
Table 8 Verification of Eurocode 8 requirements
Test Nº 1 2 3 4 5/6 7 8 9 Ref. Value
Rotation capacity 40 40 30* 25* 40/33 40 45 50 25~35 mrad **Strength degradation: positive moment 15 25 2 1 10 0 0 40 < 20% **Strength degradation: negative moment 10 11 1 1 10 0 0 10 < 20% **Stiffness degradation: positive moment 15 20 3 15 25 30 15 25 < 20% **Stiffness degradation: negative moment 18 20 1 5 15 0 10 15 < 20%
* maximum rotation reached in test without joint failure ** number of cycles to reach 20% degradation
Fig. 23 Beam deflection for the calculation of θp
Table 7 Joint parameters for all tests for the descending branches
Test Nº 1 2 3 4 5/6 7 8 9** Ref. Value
Kd KNm/rad 26810 40830 18830 36220 37920 16987 35118 75050 K-y
MdKNm 125 170 80 118 167 160 190 175 1.2×M-y
Kpd KNm/rad 670 1020 940 1800 1140 425 1300 3250 0.03×K+y
nd 2 2 2 2 2 2 2 2 2
Kdp KNm/rad 26810 40830 18830 36220 37920 16987 35118 75050 K-y
Mdp KNm 60 75 60 60 110 90 100 110 0.65×Md
Kpdp KNm/rad 670 1020 940 1800 1140 425 1300 3250 0.03×K+y
ndp 1 1 1 1 1 1 1 1 1
t1d 6 15 5 20 20 15 15 20 5 < ... < 20
t2d 0.2 0.5 0.15 0.15 0.2 0.1 0.1 0.5 0.15 < ... < 0.5
Cd 1 1 1 1 1 1 1 1 1
iKd 18 20 1 5 15 0 10 15 1 < ... < 20
iMd 0.10 0.11 0.01 0.01 0.10 0 0 0.01 0.01 < ... < 0.11
Hd 0 0 0.02 0 0 0 0 0 0
5. Conclusions
The paper presents the numerical implementation of a hysteretic model able to simulate a generic cyclic steel-composite joint behaviour. It is incorporated in the structural analysis software SeismoStruct (Seismosoft 2007) as a joint element, thus allowing realistic non-linear static and dynamic structural analyses. The model was applied to nine experimental tests from three independent sources for composite joints, showing a very good agreement with the experimental results, even when using different cyclic loading strategies. Despite the small sample size, a clear trend was observed for the required model parameters for end-plate beam-to-column composite joints. A proposal of an interval range of design parameters for such joints was presented. Finally, these joints matched the eurocode requirements for dissipative semi-rigid, partial strength joints, showing that these joints may be safely used in seismic situations, although an extended validation should be sought.
Acknowledgements
Financial support from the Portuguese Ministry of Science, Technology and Higher Education (Ministério da Ciência, Tecnologia e Ensino Superior) under contract grants from PRODEP III (5.3), for Pedro Nogueiro, Foundation of Science and Technology through POCI/ECM/55783/2004 and FEDER through INTERREG-III-A (project RTCT-B-Z-/SP2.P18) is gratefully acknowledged. The assistance provided by Seismosoft, is also most appreciated (http://www.seismosoft.com). The supply of the data files from experimental tests by D. Dubina and R. Liew is warmly thanked.
References
Amadio, C., Benussi, F. and Noe, S. (1994), Behaviour of unbraced semi-rigid composite frames under seismic actions, In Behaviour of Steel Structures in Seismic Areas – STESSA’94, Edited by F. M. Mazzolani and V. Gioncu, E& FN SPON, London, 535-546.
Bursi, O.S. and Ferrario, F. (2003), Computational Models for the Low-Cycle Fatigue Behaviour of Composite Members and Joints, Progress in Civil and Structural Engineering Computing, Edited by Topping, B. H. V., Saxe_Coburg Publications, Stirling, Scotland, 119-148.
Bursi, O.S., Lucchesi, D., Salvatore, W. (2003), “Partial-Strength Beam-to-Column Joints for High Ductile Steel-Concrete Composite Frames,” Proc. Ninth Int. Conf. on Civil and Structural Engineering Computing, Edited by Topping B. H. V., Civil-Comp Press, Stirling, Scotland.
Calado, L. (2003), Comportamento sísmico de ligações viga-coluna, Caracterização baseada na experimentação, IV Congresso de Construção Metálica e Mista, Lisboa, 4 e 5 de Dezembro, 645-656.
De Martino, A., Faella, C. and Mazzolani, F.M. (1984), “Simulation of Beam-to-Column Joint Behaviour under Cyclic Loads”, Construzioni Metalliche, 6, 346-356.
Della Corte, G., De Matteis, G. and Landolfo, R. (2000), Influence of Connection Modelling on Seismic Response of Moment Resisting Steel Frames, Mazzolani FM, editor, Moment resistant connections of steel buildings frames in seismic areas, E. & F.N. Spon, London.
Delphi 7 (2002), Borland Software Corporation.
Dubina, D., Ciutina, A.L. and Stratan, A. (2001). “Cyclic Tests of Double-Sided Beam-to Column Joints”, J. Struct. Eng., 127(2), February.
Dubina, D., Ciutina, A.L. and Stratan, A. (2002). “Cyclic testes on bolted steel and composite double-sided beam-to-column joints”, Steel Compos. Struct., 2(2), 147-160.
Loads, No. 45.
Emmett, A. Sumner and Thomas M. Murray (2002), “Behavior of Extended End-Plate Moment Connections Subjected to Cyclic Loading”, J. Struct. Eng.,128(4).
EN 1994-1-1, Eurocode 4 (2004), Design of composite steel and concrete structures, Part 1.1: General rules and rules for buildings, European Committee for Normalization, Brussels.
EN 1998-1, Eurocode 8 (2004), Design of structures for earthquake resistance, Part 1: General rules, seismic actions and rules for buildings, European Committee for Normalization, Brussels.
Ermopoulos, J.C., Vayas, I., Petrovits, N.E., Sofianopoulos, D.S. and Spanos, C. (1995), Cyclic behaviour of composite beam-to-column bolted joints, In Steel Structures – Eurosteel’95, Edited by Kounadis, A. N., Balkera, A. A., Rotterdam, 205-210.
Filippou, F. C., Popov, E. P. and Bertero, V. V. (1983), “Effect of Bond deterioration on Hysteretic behaviour of reinforced concrete joints”, Report No. UCB/EERC-83/19, Earthquake Engineering Research Center, University of California, Berkeley.
Lee, S.J. and Lu, L.W. (1989), “Cyclic Tests of Full-Scale Composite Joint Subassemblages”, J. Struct. Eng.,115(8). Leon, R.T. (1990), “Semi-rigid Composite Construction”, J. Constr. Steel Res., 15, 99-120.
Leon, R.T., Hajjar, J.F. and Gustafsun, M.A. (1998), “Seismic Response of Composite Moment-Resisteng Connections, I: Performance”, J. Struct. Eng.,124(8).
Leon, R.T., Hajjar, J.F. and Gustafsun, M.A. (1998), “Seismic Response of Composite Moment-Resisting Connections, II: Behaviour”, J. Struct. Eng., 124(8).
Liew, J.Y.R., Teo, T.H. and Shanmugam, N.E. (2004), “Composite joints subject to reversal of loading, Part 1: experimental study”, J. Constr. Steel Res.,60, 221-246.
Mazzolani, F.M. (1988), Mathematical model for semi-rigid joints under cyclic loads, R. Bjorhovde et al. (eds), Connections in Steel Structurs: Behaviour, Strength and Design,Elsevier Applied Science Publishers, London, 112-120.
Nogueiro, P., Simões da Silva, L. and Bento, R. (2003), “Influence of joint slippage on the cyclic response of steel frames”, Proc. of 9th
Int. Conf. on Civil and Structural Engineering Computing, Topping, B.H.V. (ed.), Civil-Comp Press, Stirling, United Kingdom, 66.
Nogueiro, P., Simões da Silva, L., Bento, R. and Simões, R. (2007), “Numerical implementation and calibration of a hysteretic model with pinching for the cyclic response of steel joints”, Int. J. Adv. Steel Constr., 3(1), 128-153. Pradhan, A.M. and Bouwkamp, J.G. (1994), Structural performance aspects on cyclic behaviour of the composite
beam-column joints, Behaviour of Steel Structures in Seismic Areas – STESSA’94, Edited by F. M. Mazzolani and V. Gioncu, E& FN SPON, London, 221-230.
Plumier, A. and Schleich, J.B. (1993), “Seismic Resistance of Steel and Composite Frame Structures”, J. Constr. Steel Res., 27, 159-176.
Popov, E.P. and Bertero, V.V. (1973), “Cyclic loading of steel beams and connections”, J. Struct. Div., ASCE, 99(6), 1189-1204.
Popov, E.P. and Pinkey, R.B. (1968), Cyclic loading of steel beams and connections subjected to inelastic strain reversals, Bull No. 3 (Nov.), American Iron And Steel Institute, Washington, D.C.
Ramberg, W. and Osgood, W.R. (1943), Description of stress-strain curves by three parameters, Monograph No. 4, Publicazione Italsider, Nuova Italsider, Genova.
Richard, R.M. and Abbott, B.J. (1975), “Versatile Elasto-Plastic Stress-Strain Formula”, J. Eng. Mech., ASCE
101, EM4, 511-515.
SeismoStruct (2007), Computer program for static and dynamic nonlinear analysis of framed structures [online], Available from URL: http://www.seismosoft.com.
Simões da Silva, L., Simões, R. and Cruz, P. V. (2001), “Experimental behaviour of end-plate beam-to-column composite joints under monotonical loading”, Eng. Struct., 23(11), 1383-1409.
Simões, R., Simões da Silva, L. and Cruz, P. (2001), “Cyclic behaviour of end-plate beam-to-column composite joints”, Int. J. Steel Compos. Struct.,1(3), 355-376.
Sheikh, T.M., Deierlein, G.G., Yura, J.A. and Jirsa, J.O. (1989), “Beam-Column Moment Connections for Composite Frames, Part 1”, J. Struct. Eng., 115(11).