Towards 5G: Performance Evaluation 60 GHz UWB
OFDM Communications under both Channel and RF
impairments.
Rodolfo Gomesa,b, Akram Hammoudehb, Rafael F. S. Caldeirinhaa,b,∗,
Zaid Al-Dahera, Telmo Fernandesa,b, Joao Reisa,b
aUniversity of South Wales, School of Engineering, Treforest, United Kingdom. bInstituto de Telecomunica¸c˜oes (DL-IT), ESTG, Polytechnic Institute of Leiria, Portugal.
Abstract
Detailed analysis on the impact of RF and channel impairments on the per-formance of Ultra-Wideband (UWB) wireless Orthogonal Frequency Division Multiplexing (OFDM) systems based on the IEEE 802.15.3c standard, for high data-rate applications using the 60 GHz millimetre frequency band is presented in this paper. This frequency band, due to the large available bandwidth is very attractive for future and 5G wireless communication systems. The usage of OFDM at millimetre-wave (mmWaves) frequencies is severely affected by non-linearities of the Radio Frequency (RF) front-ends. The impact of impairments is evaluated, in terms of some of the most important key performance indica-tors, including spectral efficiency, power efficiency, required coding overhead and system complexity, Out-Of-Band Emissions (OOBEs), Bit Error Rate (BER) target and Peak Signal-to-Noise Ratio (PSNR). Additionally, joint distortion effects of coexisting Phase-Noise (PN), mixer IQ imbalances and Power Ampli-fier (PA) non-linearities, on the performance degradation of a mmWave radio transceiver, combined with various multipath fading channels, are investigated. Subsequently, the power efficiency of the system is evaluated by estimating val-ues of the PA Output-Power-Backoff (OBO) needed to meet the requirements for the Transmit Spectrum Mask (TSM) and BER target. Finally, a comparison
∗Corresponding author
of the system overall performance between uncoded and coded OFDM systems combined with Quadrature Amplitude Modulations (QAMs) (16 and 64 QAM) and its maximum operable range are evaluated by transmitting a Full HD un-compressed video frame under five different RF impairment conditions over a typical LOS kiosk 60 GHz IEEE channel model.
Keywords: Communication system performance, Channel coding, Fading channels, Millimetre wave communication, Millimetre wave amplifiers, Phase noise.
2010 MSC: 00-01, 99-00
1. Introduction
Radio communication systems at 60 GHz have recently attracted a great deal of interest for future 5G wireless networks, due to the wide available bandwidths to accommodate multi-gigabit transmission rates and to the possibility of highly integrated transceivers at these frequencies. The IEEE 802.15.3c [1], created by
5
Task Group 3c [2], is earmarked as the Wireless Personal Area Network (WPAN) standard for the band 57-66 GHz in Europe [3], with expected data rate targets ranging between 2 and 5 Gb/s. This standard details the implementation of a 60 GHz communication system from a physical layer (PHY) design point of view, considering different target applications or usage models [4].
10
Millimetre-wave communications benefit from a large unlicensed bandwidth, which enables new wireless applications such as High Definition Multimedia In-terface (HDMI) for uncompressed video/audio streaming and multi-gigabit file data transfer. The relatively high free-space signal path loss and high attenu-ation by walls, furniture and other objects, simplify the frequency reuse factor
15
over small distances [5]. The wavelength in free-space is around 5 mm at 60 GHz, which highly reduces the size of the devices. However, there are some drawbacks that must be taken into account at mmWave frequencies, which are mostly related to the non-linearities of the RF front-ends [6]. A signal conver-sion from baseband to 60 GHz introduces a relatively higher PN in comparison
to lower frequencies [7]. In [8], it is also demonstrated that phase noise floor, presented in the oscillators, is significantly increased at mmWave frequencies. For instance, if the desired frequency at the input of the mixer is f and the original frequency from the reference source is fo, the final phase noise will
be 20 log10(f /fo) dB above the original level. In addition, the upconversion of 25
baseband signals at the transmitter and their down conversion back to baseband at the receiver, using IQ mixers, causes the RF front-ends to induce several crit-ical non-idealities affecting both transmitted and received radio signals. Such non-linearities, including Phase-Noise (PN), IQ imbalances and Power Amplifier (PA) non-linear distortions, should be taken into account in radio design and
30
link quality.
Despite the existence of a large number of articles addressing RF impair-ments at 60 GHz published in literature, to the authors’ knowledge, none of them present a comprehensive critical survey analysis of the performance of Orthogonal Frequency Division Multiplexing (OFDM) under RF and channel
35
impairments, leading in loss of subcarrier orthogonality and hence degradation in system performance. For example, in [9], the IQ imbalances are not con-sidered and only low modulation orders are used. In [10] and [11], only the impact of a typical PA on the transmitter side is considered. Moreover, in
[12, 13, 14, 15], the comparison is performed without considering the proposed
40
standard specifications [1] and the appropriate RF impairment models for 60 GHz communication systems, reported in [16] and [17]. Finally in [8], only simulation results of error vector magnitude vs. difference phase noise floor lev-els are assessed targeting the E-band. Also in [18], semi-analytical methods to estimate the error-rate for uncoded OFDM systems are proposed, considering
45
non-Gaussian distributions for the joint interference of RF impairments in con-trast to taking into account realistic models at mmWave spectrum, as presented in this paper. Additionally, PA non-linearities are not considered in the work presented in [18].
Following a preliminary study done by the authors [19], this paper presents
50
on the performance of OFDM wireless communication systems at 60 GHz. The authors intend to provide a realistic channel and RF impairment models for mmWave spectrum, which are essential for system assessment, radio planning, and link budget analysis for giga-bit per second wireless applications, such as
un-55
compressed video streaming. An end-to-end simulation framework based on the IEEE 802.15.3c standard [1] is developed, which can be used to predict system performance for future radio networks. According to [20, 21], to compensate for the expected growth of users and the consequent overloading of the frequency spectrum that will caused by 5G, the use of the unlicensed mmWave spectrum
60
(especially the 60 GHz) is very likely. This band is due to be standardized for 5G applications by 2020.
Firstly, the system performance is characterized under an Additive White Gaussian noise (AWGN) channel in order to determine the effects of RF impair-ments in the absence of other factors such as multipath propagation. The models
65
used for RF impairments are similar to those proposed in [16] and [17] for the PN, IQ imbalances and PA non-linearities. Two realistic power amplifier mod-els of different technologies (CMOS and GaAs) are considered. For each model, the PA Output-Power-Backoff (OBO) needed to meet the requirements for the Transmit Spectrum Mask (TSM) [1] and BER target is presented. Secondly,
70
the overall OFDM (both uncoded and coded) system performance, is evaluated taking into account both RF and channel impairments, by transmitting a Full High Definition (HD) uncompressed video frame under five different impair-ment conditions, as detailed in section 5. Finally, Forward Error Correction (FEC) codes, in particular, Reed Solomon (RS) and Low-Density Parity-Check
75
(LDPC) codes, aimed at reducing the effects inherent from the RF front-ends and from the radio propagation channel, are implemented. As metrics, Bit Error Rate (BER), Out-Of-Band Emissions (OOBEs) and maximum system range are used for performance assessment. Peak Signal-to-Noise Ratio (PSNR) is used to assess the received quality of service in an uncompressed video streaming
ap-80
plication (UM1 [4]) using Equal Error Protection (EEP). For millimetre-wave (mmWaves), in general, a link with a dominant Line-of-sight (LOS) is required
to support higher throughput and higher range of operation [4]. For example, the data rate requirement to transmit a Full HD video content at a frame rate of 90 Hz and 30 bits per channel per pixel, which are the expected revised
spec-85
ifications to improve the quality of HDTV [22], is 5.6 Gbps. The IEEE CM9 standard model [2], typically for indoor LOS Kiosk environment, is employed in the analysis presented in this paper.
The paper is organized as follows. Section 2, presents the RF impairment models for PN, IQ imbalances and PA non-linearities. Section 3, details
im-90
plementation of both coded and uncoded OFDM system modelling. Section 4, provides results of the OFDM performance degradation due to each RF impair-ment, together with link-budget analysis. Section 5, presents the OFDM BER and PSNR simulation results for a typical RF front-end architecture considering a number of different impairment scenarios. Finally, the main conclusions are
95
drawn in section 6.
2. RF impairment modelling at 60 GHz
Behavioural modelling and simulation of non-linear systems play an im-portant role in the evaluation of an overall communication system design and performance. In this section, modelling of RF impairments is presented.
100
2.1. Phase Noise and IQ Imbalances
In a typical radio communication systems operating at the sub-6 GHz band, the IQ mixing and upconversion/downconversion stages are being replaced by software implementations, making the system less susceptible to hardware im-perfections and non-linearities. However, at 60 GHz, performing upconver-sion/downconversion by digital signal processing algorithms is impracticable, since a minimum sampling rate of 120 GS/s would be required to comply with the Nyquist criteria. Therefore, for such high frequencies, RF conversions are preferably implemented in hardware. Oscillators for the RF conversions and IQ mixers for the Quadrature Amplitude Modulations (QAMs), and such hardware imperfections should be taken into account in a mm-Wave system design. For
example, it is very unlikely to have two oscillators operating at the exact same carrier frequency and thus distortion in the OFDM signal due to this effect is always present, causing Inter-Carrier Interference (ICI) and Common Phase Ro-tation (CPR) [12], also known as phase-noise. By performing an interpolation of the data obtained from measurements at 60 GHz it has been demonstrated that PN can be modelled as a high-pass filter [16], given by:
P SD(f ) = P SD(0)[1 + (f /fz)
2]
[1 + (f /fp)2]
, (1)
where, P SD(0) is the low frequency phase noise, fp is the pole filter
fre-quency and fz is the zero filter frequency. Thus, by considering different
values of P SD(0), the PN spectral density model can be adjusted for differ-ent competing Integrated Circuit (IC) technologies, such as 0.25 µm/0.13 µm
105
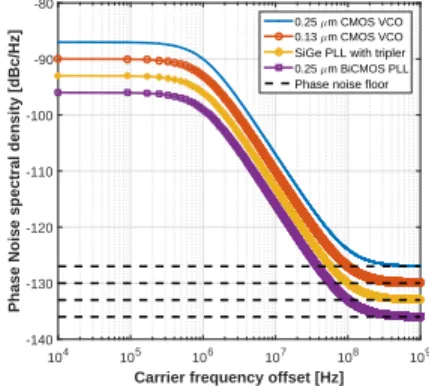
Complementary Metal-Oxide-Semiconductor (CMOS) Voltage-Controlled Os-cillators (VCOs), 0.25 µm BipolarCMOS (BiCMOS) Phase-Locked Loop (PLL) with frequency tripler and a Silicon-germanium (SiGe) PLL, as is depicted in Fig. 1 according to [16].
Carrier frequency offset [Hz]
104 105 106 107 108 109
Phase Noise spectral density [dBc/Hz]
-140 -130 -120 -110 -100 -90 -80 0.25 µm CMOS VCO 0.13 µm CMOS VCO
SiGe PLL with tripler
0.25 µm BiCMOS PLL
Phase noise floor
Figure 1: Power spectral density for different VCO and PLL CMOS/SiGe IC technologies.
IQ imbalances are described by the phase and amplitude offset between I and Q branches, in quadrature amplitude modulators/demodulators. The complex baseband output signal, which suffers this mismatch, can be defined by [22]:
[∆g cos(∆φ) − j sin(∆φ)]x∗(t), (2)
where, x(t) is the input signal, x∗(t) is its complex conjugate and, ∆g and ∆φ
110
are the gain and phase mismatches, respectively. From (2), it can be seen that x(t) is interfered with its image signal, x(t)*, causing attenuation and a rotation of the desired signal.
2.2. Power Amplifier
Radio Signals are subject to both amplitude and phase distortions when
115
passing a power amplifier. Such distortions are visible not only in the signal bandwidth but also as out of band emissions.
For a generic amplifier stage, the input signal x(t), given by x(t) = A(t) cos[2πfct+
θ(t)], is amplified and characterized by y(t) = G[A(t)] cos(2πfct+θ(t)+ψ[A(t)]),
where G[A(t)] is the amplitude distortion, also known as amplitude modulation to amplitude modulation (AM-AM) and ψ[A(t)] is the amplitude modulation to phase modulation (AM-PM). In [16], the Rapp model for AM-AM [23] has been used and modified to extend it to include the AM-PM effects. Spectral regrowth and distortions on the constellation scheme of a 60 GHz PA can be therefore modelled by [16]: FAM −AM(|x[n]|) = G|x[n]| (1 + (|x[n]|V sat) 2s)2s1 , (3) FAM −P M(|x[n]|) = α|x[n]|q1 (1 + (|x[n]|B )q2) , (4)
where G is the voltage gain of the PA, Vsatis the saturation voltage level, |x[n]|
is the input voltage level, s (s > 0) is the smoothness factor that controls the transition from the linear zone to the saturation zone, α, B and q are constants
120
and representing fitting parameters.
In order to mitigate the distortion introduced by the power amplifier, its qui-escent operating point should be set to operate in the linear region, otherwise out-of-band emissions (intermodulation products) will appear in the output sig-nal spectrum. And thus, leading to a high Adjacent Channel Interference (ACI)
and ISI, contributing to the degradation of the transmitted signal. In addition, if the input signal envelope is not constant, the operation point of the PA will vary. In practice to avoid (or at least to reduce) the effects of non-linearities, the PA should be operated at a given OBO set to a specific level keeping the signal within the linear region, at the expense of less power efficiency.
130
The PA OBO is given by:
OBO = 10 log 10(Psat Pout
), (5)
where, Pout is the average output power from the PA and Psatcorresponds to
the maximum output power (saturating power). The OBO parameter is highly important, since OFDM systems are characterized by large signal amplitude fluctuations, which make it susceptible to system non-linearities. Such ampli-tude fluctuations are characterized by the PAPR of the signal. The PAPR measures instantaneous power compared to the average power of the OFDM symbols and for the discrete-time signal is expressed as:
P AP R(x[n]) = max0≤n≤Nc−1
|x[n]|2
E[|x[n]|2], (6)
where, |x[n]|2 is the maximum instantaneous power, E[.] is the average power
and Nc is the number of the subcarrier per OFDM signal.
The Power Added Efficiency (PAE), denoted by η, is defined as the ratio of the amplified output signal power to the DC power supplied to the amplifier, which is expressed by:
η =Pout− Pin PDC
, (7)
where, Pinis the input power, Pout is the desired output power in the band of
interest and PDC is the DC input power.
The values characterizing the PA non-linearities, given in Table 1, for two
135
competing IC technologies have been calculated by fitting data obtained from 60 GHz measurements on Gallium Arsenide (GaAs) pHEMT [17] and a 65 nm CMOS [24] to the models presented in (3) and (4). The power and voltage characteristics for both GaAs and CMOS PA models, together with the AM/AM transfer functions assuming a 50Ω input impedance, are given in Fig. 2a and
Table 1: Modelling parameters for the considered PA models.
Model Gain Vsat[V] s α B q1 q2
GaAs 19 1.98 0.81 -48000 0.123 3.8 3.7
CMOS 4.65 0.82 0.81 2560 0.114 2.4 2.3
Fig. 2b, respectively. In addition, the AM/PM characteristics of the amplifiers are depicted in Fig. 2c.
Input Power [dBm] -25 -20 -15 -10 -5 0 5 Output Power [dBm] -20 -15 -10 -5 0 5 10 15 20 25 30 35 Linear - GaAs GaAs GaAs with s=100 Linear - CMOS CMOS CMOS with s=100 (a) |x[n]| [V] 0 0.05 0.1 0.15 0.2 0.25 0.3 0.35 0.4 FAM-AM (|x[n]|) [V] 0 0.5 1 1.5 2 2.5 3 3.5 Linear - GaAs GaAs GaAs with s=100 Linear - CMOS CMOS CMOS with s=100 (b) |x[n]| [V] 0 0.05 0.1 0.15 0.2 0.25 0.3 0.35 0.4 FAM-PM (|x[n]|) [º] -15 -10 -5 0 5 10 15 20 GaAs CMOS (c) 0 2 4 6 8 10 0 10 20 30 40 50 60 70 OBO [dB] η [%] GaAs GaAs with PD CMOS CMOS with PD (d)
Figure 2: PA characteristic curves of: AM/AM for (a) power and (b) voltage, (c) AM/PM in function of input voltage and (d) relation between PAE and OBO for GaAs and CMOS model amplifiers.
char-acteristic for low input signal amplitudes, followed by a transition towards a constant saturated output. Additionally, it is evident that as the smoothness
145
function becomes increasingly large (s → ∞), the Rapp model converges to-wards a perfect Pre-Distortion (PD) technique. This is verified for both PA technologies and observed when s = 100.
The PA is the main power consuming device in a transceiver. Therefore it is important to operate it close to its saturation point. However, as it was cited
150
above, distortions occur due to the signal high PAPR., and a trade-off between the PA OBO and efficiency must be taken into account. This trade-off is shown in Fig. 2d for both PA models, with and without employing PD. Results for the CMOS PA have been obtained with the DC power value of 14.59 dBm [24]. As no DC power value is reported in literature for GaAs PA, its value was
155
interpolated from reference (blue curve), assuming OBO = 0 and η = 50%. Fig. 2d shows that the GaAs PA has much higher PAE than the CMOS model and when employing a PD technique, the PAE increases significantly, i.e. CMOS PA has an increased PAE of about 20%.
3. mmWave System Model based on IEEE 802.15.3c standard
160
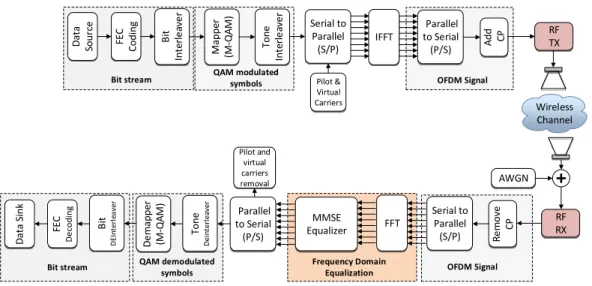
The presented OFDM system model was developed based on the IEEE 802.15.3c standard [1] and is illustrated in Fig. 3, with the physical operat-ing parameters given in Table 2 [1], for both 16 QAM and 64 QAM. Their constellations are mapped to Gray-code and their output values are obtained by multiplying the constellation points with a normalization factor. The FEC codes, bit and tone interleaver blocks are directly provided by the standard. In order to shape the OFDM signal Power Spectral Density (PSD) the subcarriers are allocated into the IFFT according to [1]. The wireless channel employed is based on the IEEE model proposed in [2]. The received signal, y(t), after being processed using a K- point FFT, is converted into its frequency domain, Y (k).
Table 2: Main parameters considered in the design of uncoded OFDM system based on IEEE 802.15.3c standard.
Parameter Value
FFT size block (Nf f t) 512
Cyclic prefix (Ncp) 64 samples
Sampling rate 2640 MHz
Nominal Used Bandwidth 1815 MHz
Sub-carrier bandwidth 5.15 MHz
Cyclic prefix time (Tcp) 24.24 ns
Symbol time 218.18 ns
Throughput 6.2 Gbps
The received OFDM signal, Yl, is given by:
Yl(k) = Hl(k).Xl(k) + Zl(k), (8)
Considering that Tcp≥ τmax, where, Tcp is the cyclic prefix interval time, τmax
corresponds to the maximum excess delay from a generic multipath channel, k denotes the subcarrier frequency component of the lth transmitted OFDM signal, Hl(k) is the Channel Frequency Response (CFR) and Zl(k) is the AWGN
in the frequency domain. The original transmitted information, Xl(k) can be
recovered employing a Frequency Domain Equalization (FDE) technique [25], which is performed as a K-branch linear feed-forward equalizer with C(k) being the complex coefficient of the kth subcarrier. Minimum Mean Square Error
(MMSE) equalizer is considered, where for this criterion, C(k) is defined by (9).
CM M SE(k) = ˆ H(k)∗ | ˆH(k)|2+1 η (9)
where, ˆH(k), η,∗ and |.| denote the estimated CFR, SNR, conjugate trans-pose and modulus, respectively.
FEC schemes should be determined considering the trade-off between higher coding gain, hardware complexity and code rate. Two families of linear block codes are proposed in the standard: RS codes (mandatory) and LDPC codes
D ata So u rc e
Bit stream QAM modulated symbols
Serial to Parallel (S/P) Pilot & Virtual Carriers IFFT Add CP Wireless Channel OFDM Signal R e m o ve CP MMSE Equalizer Pilot and virtual carriers removal AWGN Parallel to Serial (P/S) FE C C o d in g B it In te rl e av e r Mapp er (M -Q A M ) To n e In te rl e av e r D ata S in k
Bit stream QAM demodulated
symbols FFT Serial to Parallel (S/P) FE C D e co d in g B it D EIn ter le aver D e m ap p er (M -Q A M ) To n e D ei n ter lea ver Parallel to Serial (P/S) Frequency Domain
Equalization OFDM Signal
RF TX
RF RX
Figure 3: OFDM block diagram.
(optional) with several coding rates. RS codes are known for their good capa-bility of burst error correction at a relatively high SNR. LDPC codes, despite having high complexity, with its iterative decoding process, ensures a better error correction performance than Reed Solomon codes or turbo codes [26] and its performance is very close to the Shannon coding limit [27].
170
4. Effect of RF and Channel impairments on OFDM performance
Non-linearities in wireless systems mainly result in performance degradation. The response of non-linear systems are, usually characterized by undesirable signal components in addition to the desired signal. Therefore, this section presents a study of performance degradation due to the inclusion of individual
175
RF impairments on the uncoded OFDM, namely, PN, IQ imbalances and power amplifier non-linearities. The effect of the RF impairments, is implemented based on the models introduced in section 2. This is achieved through BER analysis for 16 and 64 QAM, under an AWGN channel. The considered BER target, recommended for video streaming applications is 10−6 [2].
4.1. Phase Noise and IQ imbalances
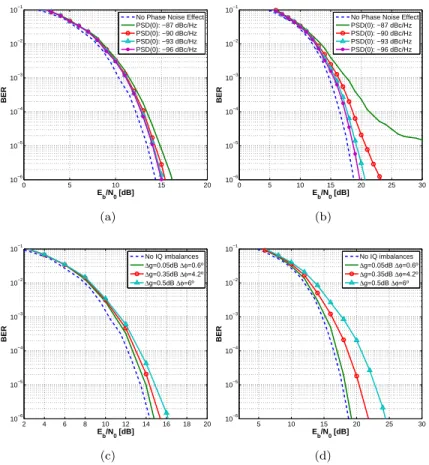
The impact of phase noise on the performance of OFDM using 16 QAM (Fig. 4a) and 64 QAM (Fig. 4b), for four low frequency PN constants: -87, -90, -93 and -96 dBc/Hz [17], where -87 and -96 represent the worst and best case scenarios, respectively. It can be clearly seen that the presence of PN
de-185
grades the overall system performance, requiring larger Eb/N0values to achieve
a desired BER. i.e for the worst case scenario (PSD (0) = -87 dBc/Hz), the degradation of the OFDM performance is about 1.5 dB for 16 QAM, while in the 64 QAM system, the BER target is not achievable.
The effect of IQ imbalances on BER analysis depends on the type of IQ
190
mixers and the number of upconversion/downconversion stages present in the RF front-end architecture. The phase gain mismatch (∆g) and phase mismatch (∆θ) values vary from 0 to 0.5 dB and from 0 to 6 degrees, respectively [17]. Figures 4c and 4d demonstrate the effect of IQ imbalances considering both modulation orders, where the OFDM system employing 16 QAM is slightly
195
more robust against IQ imbalances than 64 QAM (to achieve the required BER of 10−6). 16 QAM requires approximately 8.5 dB lower value of Eb/N0 for the
worst case scenario (∆g = 0.5 dB and ∆θ = 6◦), in comparison with the 64 QAM.
0 5 10 15 20 10−6 10−5 10−4 10−3 10−2 10−1 Eb/N0 [dB] BER
No Phase Noise Effect PSD(0): −87 dBc/Hz PSD(0): −90 dBc/Hz PSD(0): −93 dBc/Hz PSD(0): −96 dBc/Hz (a) 0 5 10 15 20 25 30 10−6 10−5 10−4 10−3 10−2 10−1 Eb/N0 [dB] BER
No Phase Noise Effect PSD(0): −87 dBc/Hz PSD(0): −90 dBc/Hz PSD(0): −93 dBc/Hz PSD(0): −96 dBc/Hz (b) 2 4 6 8 10 12 14 16 18 20 10−6 10−5 10−4 10−3 10−2 10−1 Eb/N0 [dB] BER No IQ imbalances ∆g=0.05dB ∆φ=0.6º ∆g=0.35dB ∆φ=4.2º ∆g=0.5dB ∆φ=6º (c) 5 10 15 20 25 30 10−6 10−5 10−4 10−3 10−2 10−1 Eb/N0 [dB] BER No IQ imbalances ∆g=0.05dB ∆φ=0.6º ∆g=0.35dB ∆φ=4.2º ∆g=0.5dB ∆φ=6º (d)
Figure 4: BER performance under PN and IQ imbalances effect, respectively, for (a) (c) 16 QAM, and (b) (d), 64 QAM.
4.2. Power Amplifier
200
The effects of the in-band and out of band distortions, due to the non-linear PA response, modelled in section 2.2 for uncoded OFDM, are presented in this section. The out of band emissions do not have a direct impact on the system performance, but may harm communication systems operating in the adjacent frequency channels. Nevertheless in-band emissions introduce ISI. In order to
205
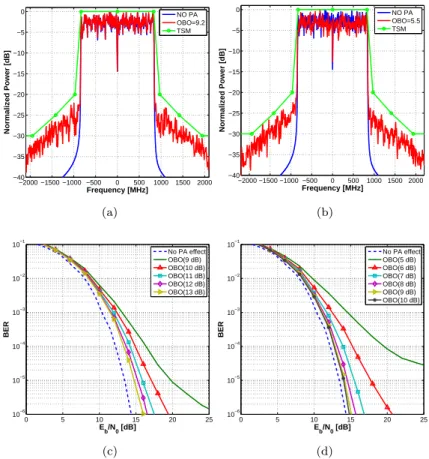
minimize the effect of out of band emissions, the spectrum of the transmitted signal must be below the Transmit Spectrum Mask (TSM) is defined by the IEEE 802.15.3c standard [1]. The estimation of such spectrum was performed by calculating the transmitted Signal Power Spectrum Density (PSD).
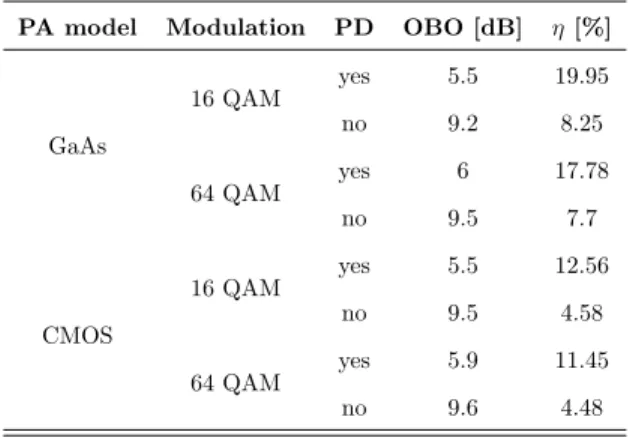
Table 3: OBO required to meet TSM requirements for 60 GHz OFDM systems.
PA model Modulation PD OBO [dB] η [%]
GaAs 16 QAM yes 5.5 19.95 no 9.2 8.25 64 QAM yes 6 17.78 no 9.5 7.7 CMOS 16 QAM yes 5.5 12.56 no 9.5 4.58 64 QAM yes 5.9 11.45 no 9.6 4.48
The transmitted OFDM signal amplitude might exhibit high peak values,
210
since many subcarrier components are added in the IFFT operation. However, a discrete representation of the OFDM signal does not necessarily contain the maximum amplitude values of the continuous time domain signal. Therefore, an oversampled version of the discrete signal is considered, yielding a more accurate PAPR distribution of the OFDM signals. An oversampling factor of L = 4 is
215
considered for both QAM modulations.
The PSD has been computed for both PA technologies. Estimated OBO values for both PA models and both modulations are summarized in Table 3, and illustrated, in particular for 16 QAM, in Fig. 5a and in Fig. 5b without and with PD, respectively. Results show that the minimum estimated OBO
220
values, which meet the TSM requirements are slightly higher for 64 QAM, as expected. The PAPR distribution employing 64 QAM has slightly higher val-ues than 16 QAM. In addition, introducing a PD technique reduces the OBO values for both amplifier technologies and consequently increases their power efficiency, e.g. for the GaAs model the PAE increases from 8.25% to 19.95% (16
225
QAM). Furthermore, both PA models present similar OBO values to meet the TSM requirements. i.e., for the GaAs model using PD, the lowest values of PA OBO are 5.5 and 6 dB for both modulation schemes, whereas the CMOS model requires OBO values of 5.5 and 5.9 dB, respectively.
Table 4: Summary of PA non-linearity impact on BER results for 60 GHz OFDM systems. PA model M-ary PD Eb/N0 [dB] 4Eb/No [dB] OBO [dB] η % GaAs 16 yes 20.5 6.1 6 17.7 no 26 11.6 9 8.6 64 yes 26.2 7.45 8 11.2 no 32 13.25 13 3.44 CMOS 16 yes 23.7 9.3 7 8.89 no 21.6 7.2 11 3.26 64 yes 28.65 9.9 12 2.81 no 26 7.25 15 1.3
A summary of PA non-linearity impact on BER results against PA OBO
230
for both PA models, is presented in Table 4. In this table, the performance degradation is characterized by 4Eb/No, which is the difference between the
required Eb/N0in the presence and absence of non-linearities. Simulated results
have shown that the PA OBO has a significant impact on the BER performance. A trade-off is noticed between the PA operating point, 4Eb/Noand PAE, i.e, in 235
order to mitigate the effects of the PA non-linearities on the system, the power efficiency of the PA is significantly decreased. Pre-distortion employment allows to reduce the signal degradation for lower PA OBO values, making the system more power efficient and more robust against this impairment, as demonstrated with the comparison between Fig. 5c and Fig. 5d.
240
Additionally, when comparing the BER simulation results for both PAs, it is noticed that the GaAs PA is a better choice for the RF front-end, as it is capable to achieve the desirable BER target with lower PA OBO values at a higher power efficiency. The system requires 6 and 8 dB of PA OBO (optimum values) using GaAs model and PD for 16 and 64 QAM, respectively. On the other hand, the
245
CMOS model requires 7 and 12 dB for 16 and 64 QAM, respectively. This can be justified by the fact that CMOS PA model is being characterized by a high phase distortion on its AM-PM curve, as is evident in Fig. 2c.
−2000 −1500 −1000 −500 0 500 1000 1500 2000 −40 −35 −30 −25 −20 −15 −10 −5 0 Frequency [MHz] Normalized Power [dB] NO PA OBO=9.2 TSM (a) −2000 −1500 −1000 −500 0 500 1000 1500 2000 −40 −35 −30 −25 −20 −15 −10 −5 0 Frequency [MHz] Normalized Power [dB] NO PA OBO=5.5 TSM (b) 0 5 10 15 20 25 10−6 10−5 10−4 10−3 10−2 10−1 Eb/N0 [dB] BER No PA effect OBO(9 dB) OBO(10 dB) OBO(11 dB) OBO(12 dB) OBO(13 dB) (c) 0 5 10 15 20 25 10−6 10−5 10−4 10−3 10−2 10−1 Eb/N0 [dB] BER No PA effect OBO(5 dB) OBO(6 dB) OBO(7 dB) OBO(8 dB) OBO(9 dB) OBO(10 dB) (d)
Figure 5: (a) (b) estimated OOBEs and (c) (d) OFDM BER performance employing GaAs PA without and with PD for 16 QAM.
4.3. Effects of Channel Impairments
In this section, the uncoded OFDM system performance over the IEEE CM9
250
standard model [2] (typical indoor LOS kiosk environment) at 60 GHz is assessed using MMSE equalization and employing both QAM modulations. Moreover, the maximum separation between terminals as a function of Eb/N0 is also
ob-tained.
The complex Channel Impulse Response (CIR) for the CM9 channel is
ob-255
tained from an IEEE statistical model [28], which takes into account the vari-ation of the TX and RX antenna heights and the scatterers position in the
Based on the suggested Equivalent Isotropically Radiated Power (EIRP) of 40 dB [22] and a receiver gain antenna (GRX) of 10 dBi (typical value of gain 260
on-chip antennas at 60 GHz) [29], the dynamic range of the average PDP is computed considering all multipath components which are 10 dB above the noise floor (-81.4 dBm), considering a channel bandwidth of 1.815 GHz. Con-sequently, the PDP has been analysed in terms of averaged RMS delay spread (¯τRM S), coherence bandwidth for signals correlation of 0.9 ( ¯Bc0.9) and Rician 265
factor ( ¯K). Results are as follows: ¯τRM S = 2.9 ns, ¯Bc0.9 = 258.1 M Hz and
¯
K = 52.62 dB. Moreover, the considered Half Power Beamwidth (HPBW) of TX/RX antennas is 30◦and 30◦, respectively.
The BER performance of OFDM over the CM9 channel is depicted in Fig. 6. From the results it is possible to conclude that BER curves varies from one
270
channel realization to another, since each CIR is characterised with different statistical values of τRM S, K, and Bc0.9. Due to the statistical nature of the
model [28], it is expected that BER curves converge with the increase of the number of iterations. Therefore, 100 realizations were considered in this work respecting a relatively good commitment between simulation time and accuracy.
275
In order to assess the effect of the kiosk multipath environment on the OFDM system, the average of BER performance is conducted. With this, it is verified that 16 QAM uncoded OFDM BER performance is similar to that obtained with AWGN. This is explained by the fact the former is characterized by a very high Rician factor and a relatively high coherence bandwidth. Whereas, the
280
performance of the 64 QAM uncoded OFDM system is inferior rendering it to be inoperable for BER below 10−6.
The maximum separation between terminals (dmax) as a function of Eb/N0
has been estimated, based on the relation between the maximum operation range, dmax, and the link-budget equation, given by (10) [30] and (11),
respec-tively.
6 8 10 12 14 16 18 20 22 24 10−6 10−5 10−4 10−3 10−2 10−1 Eb/N0 [dB] BER AWGN
Average Simulated BER Realization # (a) 6 8 10 12 14 16 18 20 22 24 10−6 10−5 10−4 10−3 10−2 10−1 Eb/N0 [dB] BER AWGN
Average Simulated BER Realization #
(b)
Figure 6: Average BER for the considered fading channel for: a) 16 QAM b) 64 QAM.
P L = EIRP + GRX− PN − Eb/No− IL − M [dB], (11)
where, P L0is the path loss at d0= 1m, n is the path loss exponent and P L
is the path loss. Values of n = 2, P L0 = 68 dB reported by the TG3c group
[2]. In (11), PN is the average noise power per bit, where PN = N + Nf and 285
N = −174 + 10log10(throughput [bps]), Nf is the receiver noise figure, IL is
the implementation loss of the transceiver and M the link margin. In addition, Nf = 8 dB, IL = 2 dB and M = 5 dB can be found in [31] for a 60 GHz
transceiver.
5. Impact of RF front-end non-linearities at 60 GHz
290
In this section, the effect of RF impairments on the quality of uncompressed wireless video streaming for UM1 application, defined by standard [4], is eval-uated and demonstrated under different impairment conditions (case studies) over CM9 channel. Hence, it is possible to accurately estimate the impact of a realistic RF front-end on a wireless mmWave OFDM (uncoded and coded)
295
communication system, under various scenarios for a combination of optimum and non-optimum non-linearity values based on results presented in section 4.2.
Table 5: Relation between subjective and objective quality indicators.
PSNR [dB] ITU Quality scale
> 37 5 - Excellent
31 − 37 4 - Good
25 − 31 3 - Satisfactory
20 − 25 2 - Poor
< 20 1 - Very poor
Therefore, five distinct case studies (A to E) have been built based on a combination of different QAM modulation order, PA OBO values, IQ imbalances and PSD(0) modelling values. Those are thoroughly reported in Table 6.
300
The quality of the transmitted uncompressed video content, in Full HD, is assessed through BER and PSNR analysis. Moreover, it is possible to estimate the minimum value of Eb/N0 to ensure a relatively good subjective quality
considering a reference video frame. This is achieved by using the relation between the PSNR (objective quality assessment metric) and the subjective
305
quality assessment based on viewer’s impression, presented in Table 5 [32].
Table 6: Case study RF impairments values.
Case M-ary PA IQ PSD(0) studies OBO [dB] (∆g [dB], 4θ [◦]) [dBc/Hz] A 16 6 (0.05,0.6) -96 64 8 B 16 6 (0.5,6) -96 64 8 C 16 6 (0.05,0.6) -87 64 8 D 16 6 (0.5,6) -87 64 8 E 16 5.5 (0.5,6) -87 64 6
0 5 10 15 20 25 30 35 40 10−6 10−5 10−4 10−3 10−2 10−1 Eb/N0 [dB] Average BER Ideal RF front−end Case A Case B Case C Case D Case E (a) 0 5 10 15 20 25 30 35 40 10−5 10−4 10−3 10−2 10−1 Eb/N0 [dB] Average BER Ideal RF front−end Case A Case B Case C Case D Case E (b) −5 0 5 10 15 10−6 10−5 10−4 10−3 10−2 10−1 Eb/N0 [dB] Average BER Ideal (R=1/2) Case B (R=1/2) Case C (R=1/2) Case D (R=1/2) Case E (R=1/2) Ideal (R=3/4) Case B (R=3/4) Case C (R=3/4) Case D (R=3/4) Case E (R=3/4) Ideal (R=9/14) Case B (R=9/14) Case C (R=9/14) Case D (R=9/14) Case E (R=9/14) (c) 0 5 10 15 10−6 10−5 10−4 10−3 10−2 10−1 Eb/N0 [dB] Average BER Ideal (R=1/2) Case A (R=1/2) Case B (R=1/2) Case C (R=1/2) Case D (R=1/2) Case E (R=1/2) Ideal (R=3/4) Case A (R=3/4) Case B (R=3/4) Case C (R=3/4) Case D (R=3/4) Case E (R=3/4) (d)
Figure 7: BER performance for various case studies: uncoded OFDM for a) 16 QAM b) 64 QAM and Coded OFDM for c) 16 QAM and d) 64 QAM modulations.
The uncoded OFDM BER results, computed for each case study, are dis-played in both Fig. 7a and Fig. 7b, for 16 QAM and 64 QAM, respectively, where ”Ideal RF front-end” means that only the effect of the multipath propa-gation is taking into account. It is evident from these results that the desired
310
BER is only achievable using 16 QAM for case study A, which corresponds to a maximum system range of 10.2 m, according to (10). In order to minimize ISI, in particular, in cases where the BER target is not achieved and consequently increasing operation range, FEC code schemes RS(224,216), LDPC(672,336) and LDPC(672,504) with coding rates of 9/14, 1/2 and 3/4, respectively, are
315
Table 7: Summary of RF front-end non-linearity impact on the BER results for 60 GHz coded OFDM systems for 16 QAM.
Case Studies Coding Eb/N0[dB] 4Eb/No dmax[m])
B R=3/4 8 1.51 73.7 R=9/14 15 4 35.6 C R=3/4 8.1 1.6 72 R=9/14 - - -D R=1/2 4.05 1.05 143.1 R=3/4 8.6 2.1 68.8 R=9/14 - - -E R=1/2 4.15 1.15 139.7 R=3/4 9.1 2.6 64.1 R=9/14 - -
-In Fig. 7c and Fig. 7d, it is clearly shown that the C-OFDM outperforms the uncoded OFDM under both RF and channel impairments, but at the expense of system throughput. Moreover, as expected the LDPC coding with its iterative decoding and exploitation of frequency diversity leads to impressive results. For
320
example, using RS FEC coding, 16 QAM OFDM BER performance fails to meet the BER target for C, D and E case scenarios. However, for the 64 QAM system with LDPC (672,504), the BER target is only achieved for case study A, whereas, the 16 QAM OFDM system is able to achieve the BER target in all case scenarios, making the wide-band wireless transmission reliable regardless of
325
the impact of non-linearities. A summary of RF front-end non-linearity impact over CM9 channel on the BER results and maximum range for 60 GHz coded OFDM systems, using 16 and 64 QAM, are shown in Table 7 and Table 8, respectively.
In order to evaluate the effectiveness of uncoded OFDM in ensuring a good
330
Quality of Service (QoS), at appropriate PSNR values, the degradation of the quality of the video frame for the best case scenario (case A), has been studied. The video frame content (Fig. 8a) is divided into several transmitting OFDM
Table 8: Summary of RF front-end non-linearity impact on the BER results for 60 GHz coded OFDM systems for 64 QAM.
Case Studies Coding Eb/N0[dB] 4Eb/No dmax[m])
A R=1/2 7.1 1.1 82.6
R=3/4 12 2 38
C R=1/2 7.5 1.45 79.1
D R=1/2 8.2 2.2 72.1
E R=1/2 9.6 3.6 61.3
symbols and then transmitted over the channel model. PSNR results are de-picted in Fig. 8c, for both modulation schemes together with those obtained for
335
an ideal RF front-end, where dash curves show the BER results over AWGN. It be can seen that both RF and channel impairments have significant impact on the degradation of the quality of reference video frame,where the presence of distorted pixels is clearly visible when compared to those of Fig. 8a and Fig. 8b, and a maximum achievable PSNR of about 24 dB (for an Eb/No= 24 dB) for 340
both modulations. This characterizes the video frame subjective quality as poor (Table 5), while the effective objective quality degradation (4P SN R), which is the difference between the PSNR in absence and presence of non-linearities to achieve an excellent video quality, is about 17 dB for same Eb/N0.
There-fore, in order to ensure reliable QoS (P SN R > 31) and consequently reducing
345
the necessary SNR to meet this quality requirement, FEC schemes are selected based on their BER performance, complexity and system throughput. Based on results presented in Fig.7 for the worst case scenarios, i.e case study D and E, 16 QAM RS (224,216) lend itself to be the preferred option, since 64 QAM requires LDPC (672,336). Although both modulation schemes operate approximately at
350
the same throughput rate, LDPC (672,336) increases significantly the overall system complexity in comparison with RS (224,214). The 16 QAM C-OFDM system ensures an excellent and satisfactory QoS under the worst case scenarios (D and E) with Eb/No = 24, as demonstrated in Fig. 8d, which restricts the
maximum distance between TX/RX to 12.62 m. In other words, for a satis-355
factory QoS the streaming video device and a TV/projector or other receiver equipment should be at a distance smaller than 12.62 m.
(a) (b) 0 5 10 15 20 10 15 20 25 30 35 40 45 50 55 60 E b/N0 [dB] Average PSNR [dB] Poor QoS Satisfactory QoS Good Qos Excellent Qos Ideal 16 QAM Case A − 16 QAM Ideal 64 QAM Case A − 64 QAM (c) 0 5 10 15 20 5 10 15 20 25 30 35 40 45 50 55 60 E b/N0 [dB] Average PSNR [dB] Poor QoS Satisfactory QoS Good Qos Excellent Qos Case D (R=9/14) − 16 QAM Case E (R=9/14) − 16 QAM (d)
Figure 8: Subjective video quality performance assessment of the received video frame for an ”Ideal RF front-end” a) and under impairments b) for an Eb/No= 24 dB using 16 QAM. In
c) and d) the impact of impairments on the objective quality of the received frame vs Eb/N0
is conducted for uncoded and coded OFDM, respectively.
6. Conclusions
In this paper, a study of the impact of RF impairments on a 60 GHz OFDM (uncoded and coded) system, implemented according to the IEEE 802.15.3c
360
standard, for high data-rate applications, and considering 16 QAM and 64 QAM, was presented. Degradation in system performance due to phase noise
char-acteristics, IQ imbalances and power amplifier non-linearities, was evaluated. Such impairments were modelled and used to characterize a realistic generic RF front-end system. The performance assessment of the OFDM system was
365
conducted through BER and PSNR analysis considering the transmission of an uncompressed Full HD video frame over an AWGN radio channel model.
It has been shown that PA non-linearities induce the largest performance degradation in the OFDM system, when compared with PN and IQ imbal-ances. This limitation has been compensated for by the introduction of a PA
370
PD technique, which allows to achieve a good communication quality, reducing the required PA OBO value which, however, remains above those of 6 dB and 8 dB estimated using a GaAs PA for 16 QAM and 64 QAM, respectively. It is concluded that, in order to decrease further these values, a PAPR reduction technique should be considered in the system design, together with PD. This is
375
particularly important if a mobile equipment is used as either TX or RX, since the efficiency of PA should be as high as possible to overcome battery saving requirements.
It is also concluded that the modulation order is important in OFDM sys-tem design, in particular at high frequencies and in uncoded syssys-tems, since
380
high order modulations present higher sensitivity to bit errors in presence of impairments. For example, it has been shown that for channels with small time dispersion characteristics such as the CM9, BER values of 10−6cannot be achieved for 64 QAM OFDM without FEC schemes. Whereas a performance similar to that of AWGN is noted for uncoded 16 QAM system. This makes
385
the system performance impractical in some cases. For example, 64 QAM with coded OFDM, which enhance the spectral efficiency of the system, just ensures a reliable wireless communication system for worst case scenarios considering LDPC (672,336) coding. This makes the system to operate at approximately the same rate as the 16 QAM with RS (224,216), but with higher complexity.
390
Additionally, it is concluded that a coded 16 QAM OFDM system operating under RF and channel impairments is robust enough to provide a relatively good quality of service in streaming uncompressed video for wireless applications, for
a range shorter than 13 m. Hence, PN, IQ imbalances and PA non-linearities have direct impact on the potential OFDM system throughput. Both uncoded
395
16-QAM and 64-QAM OFDM systems fail to achieve the required performance target (for all RF impairment combinations), and coded 64-QAM systems re-quire large coding rates.
Finally, results presented in this work provide an important guidance for 60 GHz OFDM system design principles, in particular for uncompressed wireless
400
video streaming applications.
References
[1] 802.15.3c-2009 - Physical Layer (PHY) Specifications for High Rate Wire-less Personal Area Networks(WPANs).
[2] S.-K. Yong, TG3c Channel Modeling Sub-committee Final Report,
Sam-405
sung Advanced Institute of Technology, 2007.
[3] T. Baykas et al, Ieee 802.15.3c: the first ieee wireless standard for data rates over 1 gb /s 49.
[4] A. Sadri, Summary of the Usage models for 802.15.3c, 2006.
[5] H. Yang, P. F. M. Smulders, M. H. A. J. Herben, Channel characteristics
410
and transmission performance for various channel configurations at 60 ghz, EURASIP J. Wirel. Commun. Netw. 2007 (2007) 43–43.
[6] J. Nsenga, W. V. Thillo, F. Horlin, A. Bourdoux, R. Lauwereins, Compar-ison of oqpsk and cpm for communications at 60 ghz with a nonideal front end, EURASIP Journal on Wireless Communications and Networking 2007
415
(2007) 086206.
[7] N. Guo, R. C. Qiu, S. S. Mo, K. Takahashi, 60- ghz millimeter - wave radio : Principle , technology , and new results, EURASIP Journal on Wireless Communications and Networking 2007 (2006) 068253.
[8] H. Mehrpouyan et al, Improving bandwidth efficiency in e-band
communi-420
cation systems, IEEE Communications Magazine 52 (3) (2014) 121–128.
[9] M. Lei et al, Hardware impairments on ldpc coded sc - fde and ofdm in multi - gbps wpan ( ieee 802.15.3c), 2008.
[10] A. Maltsev, A. Lomayev, A. Khoryaev, A. Sevastyanov, R. Maslennikov, Comparison of power amplifier non - linearity impact on 60 ghz single
425
carrier and ofdm systems, 2010.
[11] H. Yang, P. Smulders, E. Fledderus, Comparison of single and multi -carrier block transmissions under the effect of nonlinear hpa, 2007.
[12] U. Rizvi, G. Janssen, J. Weber, Impact of rf impairments on the perfor-mance of multi -carrier and single -carrier based 60 ghz transceivers, 2007.
430
[13] F. Horlin, A. Bourdoux, Comparison of the sensitivity of ofdm and sc - fde to cfo , sco and iq imbalance, 2008.
[14] Y. Zou et al, Impact of major rf impairments on mm- wave communications using ofdm waveforms, 2016, pp. 1–7.
[15] A. A. A. Boulogeorgos et al, Effects of rf impairments in communications
435
over cascaded fading channels, IEEE Transactions on Vehicular Technology 65 (11) (2016) 8878–8894.
[16] Y. Shoji et al, Rf impairment models for 60 ghz -band sys / phy simulation (nov 2006).
[17] V. Erceg et al, 60 ghz impairments modeling (nov 2009).
440
[18] N. Y. Ermolova, Y. Zou, M. Valkama, O. Tirkkonen, Error-rate analysis of ofdm radio link over mobile rayleigh channel under multiple rf impairments, IEEE Transactions on Vehicular Technology 63 (2) (2014) 930–936.
[19] R. Gomes et al, Performance and evaluation of ofdm and sc - fde over an awgn propagation channel under rf impairments using simulink at 60 ghz,
445
[20] J. Andrews, S. Buzzi, W. Choi, S. Hanly, A. Lozano, A. Soong, J. Zhang, What will 5g be?, Selected Areas in Communications, IEEE Journal on 32 (6) (2014) 1065–1082.
[21] D. Soldani, A. Manzalini, Horizon 2020 and beyond: On the 5g operating
450
system for a true digital society, IEEE Vehicular Technology Magazine 10 (1) (2015) 32–42.
[22] S. Yong, P. Xia, A. Garcia, 60GHz Technology for Gbps WLAN and WPAN : From Theory to Practice, Wiley Publishing, 2011.
[23] C. Rapp, Effects of hpa -nonlinearity on a 4- dpsk / ofdm -signal for a
455
digital sound broadcasting system.
[24] M. Varonen, M. Karkkainen, K. Halonen, Millimeter-wave amplifiers in 65-nm cmos, 2007.
[25] M. Lei, I. Lakkis, H. Harada, S. Kato, Mmse - fde based on estimated snr for single - carrier block transmission ( scbt ) in multi - gbps wpan ( ieee
460
802.15.3c), 2008.
[26] N. Bonello, S. Chen, L. Hanzo, Design of low-density parity-check codes: An overview, IEEE VechicularTechnology Magazine (2011) 16–23.
[27] C. Shannon, A mathematical theory of communication, Bell System Tech-nical Journal, The 27 (1948) 379–423 ,.
465
[28] H. Harada et al, CM MATLAB Release Support Document, 2007.
[29] R. Daniels, J. Murdock, T. Rappaport, R. Heath, 60 ghz wireless: Up close and personal, IEEE Microwave Magazine 11.
[30] T. Baykas et al, Operation range estimation of reed solomon coded sc -fde system in 60- ghz wpans, Vol. 1, 2008.
470
[32] H. K. Kim et al, IAENG Transactions on Engineering Technologies : Spe-cial Edition of the World Congress on Engineering and Computer Science 2011, Springer Science & Business Media, 2012.


![Table 4: Summary of PA non-linearity impact on BER results for 60 GHz OFDM systems. PA model M-ary PD E b /N 0 [dB] 4E b /N o[dB] OBO[dB] η % GaAs 16 yes 20.5 6.1 6 17.7no2611.698.6 64 yes 26.2 7.45 8 11.2 no 32 13.25 13 3.44 CMOS 16 yes 23.7 9.3 7 8.89no2](https://thumb-eu.123doks.com/thumbv2/123dok_br/18640469.911802/16.918.286.640.225.465/table-summary-linearity-impact-results-ofdm-systems-model.webp)