BJRS
RADIATION SCIENCES
07-02B (2019) 01-09ISSN: 2319-0612 Accepted: 2019-05-20
Dose rate in a deactivated uranium mine
Pereira, W. S.
a, b, Kelecom, A. G. A. C.
c, Silva, A. X.
d,
Lopes, J. M.
d, do Carmo, A. S.
d, Pinto, C. E. C.
aand Dias, A. O.
aa Universidade Veiga de Almeida, 20271-020, Rio de Janeiro, RJ, Brasil. b Indústrias Nucleares do Brasil, 25.510-080, Resende, RJ, Brasil c Universidade Federal Fluminense, 24021-141, Niterói, RJ, Brasil. d Universidade Federal do Rio de Janeiro, 21945-970, Rio de Janeiro, RJ, Brasil.
ABSTRACT
The Ore Treatment Unit is a deactivated uranium mine situated in Caldas, MG, BR. Although disabled, there are still areas considered controlled from the radiological point of view. In these areas, it is necessary to keep an occu-pational monitoring program. For area monitoring (AM), the dose rate, was measured with Geiger Müller (GM) area monitors or personal electronic monitors (PEM) and thermoluminescence dosimetry (TLD), along the years 2013 to 2016. For area monitoring (AM), 577 samples were recorded; for PEM, 2,656; and for TLD monitoring type, 5,657. The AM showed a mean dose rate of 6.42 µSv∙h-1. 96 % of the samples were below the derived limit per hour for workers. For the PEM, the average of the data sampled was 15.86 µSv∙h-1. 80 % of the samples were below the derived limit. Finally, the TLD showed a mean of 0.01 mSv∙h-1 (TLD detection limit is 0.2 mSv∙month-1). 98% of the registered values were below 0.2 mSv∙month-1 and less than 2 % of the measurements had values above the limit of detection. The samples show areas with low risk of external exposure, as can be seen by the TLD evalua-tion. Specific areas with greater risk of contamination have already been identified, as well as operations at higher risks. In these cases, the use of the PEM is justified for a more effective monitoring. Radioprotection identified all risks and was able to extend PEM to all risk operations, even with the use of the TLD.
1. INTRODUCTION
There are two main contributors to exposure to natural radiation: incident high-energy cos-mic particles on the Earth’s surface and radioactive nuclides that originated the Earth’s crust and are present in the environment, including the human body. In addition, the practice, defined by the National Nuclear Energy Commission [1] as any human activity that introduces additional sources of exposure or routes of exposure or extends exposure to more people, may increase the individual’s exposure to natural radiation to the point of exceeding levels recommended by ac-credited agencies for this purpose. One of the sectors with a high dose rate is the uranium mining plant [2-5].
Brazil possesses one of the largest uranium reserves in the world [6, 7]. Currently, the Brazil-ian Nuclear Industries (INB) has one mine in full extraction activity in Caetité, State of Bahia, one facility for the extraction of concentrate that is being implemented in Santa Quitéria, State of Ceará, and the Ore Treatment Unit (OTU) located in Caldas, State of Minas Gerais, whose ex-traction activities were closed in 1995. The latter has tailings and wastes that are sources of heavy metals that may cause a short or long term environmental impact. Even after deactivation, continuous evaluation of mines is essential because the construction of a database helps to assess the radiological impact on the environment [8, 9].
However, in Brazil, there is no regulatory control available to establish the basic nuclear safety requirements to be met during the planning and implementation of mining decommission-ing of radioactive concentrate extraction, with only one standard for the decommissiondecommission-ing of nuclear power plants [10]. In order to minimize the undesirable effects of ionizing radiation, INB created and implemented an effluent treatment program and developed an environmental moni-toring plan to verify whether effluent treatment actually mitigated impacts or maintained radio-metric levels within the limits allowed by Brazilian legislation [11]. Periodically surveys are carried out in a variety of natures and, among the radiometric measurements such as personal monitoring, which aims at the need for continuous dose evaluation in the Occupationally Ex-posed Individual (OEI), according to Section 5.9 from CNEN-NN-3.01 Standard [1].
From the Regulatory Position PR:3.01/005, Section 3.3 [12], the necessary parameters for calculation of effective dose are found, according with the equation below.
𝐸 = 𝐻𝑃 (10) + ∑ 𝑒(𝑔)𝑗,𝑖𝑛𝑔 𝐼𝑗,𝑖𝑛𝑔
𝑗
+ ∑ 𝑒(𝑔)𝑗,𝑖𝑛𝑎 𝐼𝑗,𝑖𝑛𝑎
𝑗
(1)
The effective dose E is the sum of the external effective dose to a depth of 10 mm in soft tis-sue [Hp (10)] with committed effective doses due to the ingestion [∑𝑗𝑒(𝑔)𝑗, 𝑖𝑛𝑔 𝐼𝑗,𝑖𝑛𝑔] and the
inhalation [∑𝑗𝑒(𝑔)𝑗,𝑖𝑛𝑎 𝐼𝑗,𝑖𝑛𝑎 ]. This term of the equation can be inferred in different ways. In this work, were used the area monitoring with Geiger-Müller, the personal monitoring with elec-tronic monitors and by TLD. This study aimed to analyze the area monitoring data, whose dose rate value is in µSv∙h-1 and individual monitoring with electronic monitor also in µSv∙h-1, and to
analyze the personal monitoring using TLD, whose dose value is in mSv∙month-1. The data
ana-lyzed were collected during 2013-2016.
2. MATERIALS AND METHODS
In order to meet the Occupational Radiological Protection Program (ORPP) [13-15], the ex-ternal exposure assessments were conducted in more than 70 areas at OTU areas, including deac-tivated mining and beneficiation areas, waste deposit areas (internal and external areas, including around near surface silos of waste) and in areas within the 4 hangars containing waste initial deposition. The dose rate was estimated using a Geiger-Müller (GM) detector MRA model GP-500, reading from 10 to GP-500,000 CPM or from 0.1 to 5,000 CPS, with external probe, 1 meter cable and direct reading capacity multiplied by 1,000 (x 1 to x 1,000 CPM and x 1 to x 1,000 CPS) or a personal electronic monitor POLIMASTER model, PM1703M1A, detector CsI(Ti) and GM tube, Sensitivity, 100 (s-1)∙(μSv∙h-1)-1 [1.0 (s-1)∙(μR∙h-1)-1], energy range 0.033 -3.0 MeV,
0.01 μSv - 9.99 Sv (1 μR - 999 R), accuracy ± (20 + К1/Н+K2*H) % in measurement range, 0.1 μSv∙h-1 - 10 Sv∙h-1 (10 μR∙h-1 – 1,000 R∙h-1) and thermoluminescent dosimeters (CaSO
4:Dy)
3. RESULTS AND DISCUSSIONS
Table 1 presents the statistical results regarding the measurements for area monitoring with GM, personal monitoring with electronic dosimeters and TLDs. For the area monitoring with Geiger-Müller, the average of the measurements was below the derived limit for occupational Exposed Individual - OEI (10 µSv∙h-1). For personal monitor, this average was higher than the
derived limit. When we evaluated the monitoring with TLD, it was observed that the average was below the limit of detection of this technique (0.28 µSv∙h-1 or 0.2 mSv∙month-1). This aver-age is a result of the large number of values below the detection limit that were considered zero.
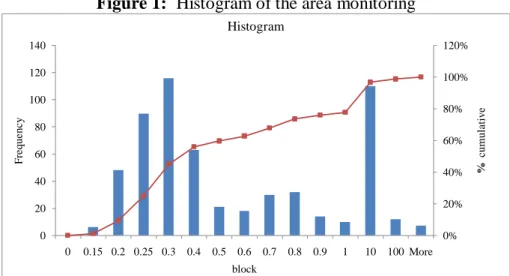
Figure 1 shows the frequency histogram of the area monitoring. It appears that 60 % of the measurements were below 0.5 mSv∙h-1, 77 % of the measurements below 1 mSv∙h-1 and 97 %
below 10 mSv∙h-1. Of the 577 measurements performed, only 19 were above the value of 10m
Sv∙h-1.
In Figure 2, the frequency distribution of individual monitoring with electronic monitors can be observed. 36 % of the measurements were below 0.5 mSv∙h-1, 53 % below 1 mSv∙h-1 and ap-proximately 80 % of the samples below 10 mSv∙h-1.
With respect to the TLD, in Figure 3, 97.4 % had zero dose value; 40 measurements were limited; 16 measurements among the 5,657 performed were above 1 mSv∙moth-1, and 36 of these measurements were above 0.50 mSv∙moth-1, with a maximum value of 1.8 mSv∙moth-1. The
mean dose value was 0.0104 mSv∙moth-1 and considering 12 months of work per year, the
esti-mated mean dose was 0.12 mSv∙year-1. By averaging the measurements with values equal to or
greater than the limit of detection, 135 measurements had mean dose equal to 0.44 mSv∙month-1. Considering 12 months of work per year, the estimated average dose was 5.30 mSv∙year-1, see Table 2.
4. CONCLUSIONS
The area monitoring can help to identify the radiological risks of areas due to external expo-sure. On average, the area dose rate monitoring (6.42 µSv h-1) was below the derived limit from
the dose rate for OEI (10 µSv h-1). The maximum value of exposure rate (0.68 mSv h-1) pointed
year). The frequency distribution of the area samplings indicated a low risk of external exposure, with approximately 60 % of the dose rate values lower than the limits derived from the public exposure rate (0.5 µSv h-1).
Table 1: Descriptive statistics for the area monitoring data
Parameters Area monitoring (AM) with GM (mSv∙h-1) Personal eletronic monitoring (PEM) (mSv∙h-1) Personal monitoring with TLD (mSv∙month-1) Average 6.42 15.86 0.01 Standard error 2.01 1.20 0.001 Median 0.32 0.90 N. D. Mode 0.73 0.20 N. D. Standard deviation 48.31 61.74 0.09 Sample variance 2,334.45 3,812.72 0.01 Curtose 117 126 170 Asymmetry 10.40 9.46 11.8 Interval 685 1,220 1.8 Minimum 0.13 0 0 Maximum 685 1,220 1.8 Count 577 2,656 5,657
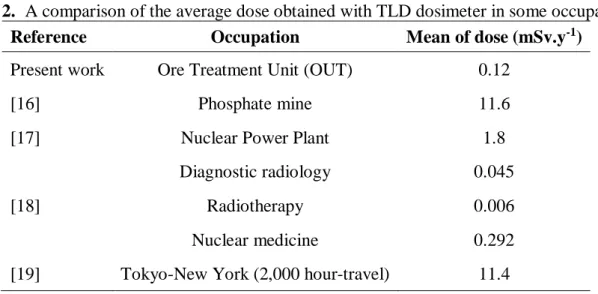
Table 2. A comparison of the average dose obtained with TLD dosimeter in some occupations Reference Occupation Mean of dose (mSv.y-1)
Present work Ore Treatment Unit (OUT) 0.12
[16] Phosphate mine 11.6
[17] Nuclear Power Plant 1.8
[18]
Diagnostic radiology 0.045
Radiotherapy 0.006
Nuclear medicine 0.292
Figure 1: Histogram of the area monitoring
Figure 2: Histogram of individual electronic monitoring
Figure 3: Histogram of TLD monitoring
0% 20% 40% 60% 80% 100% 120% 0 20 40 60 80 100 120 140 0 0.15 0.2 0.25 0.3 0.4 0.5 0.6 0.7 0.8 0.9 1 10 100 More F re que nc y block Histogram % c um ul a ti ve 0% 20% 40% 60% 80% 100% 120% 0 100 200 300 400 500 600 700 800 900 1000 0 0.5 1 2 3 5 10 50 100 500 1000 More F re que nc y block Histogram % c um ul a ti ve 96% 97% 97% 98% 98% 99% 99% 100% 100% 101% 0 1000 2000 3000 4000 5000 6000 0 0.05 0.1 0.15 0.2 0.25 0.3 0.35 0.4 0.45 1 Mais F re que nc y block Histogram % c um ul a ti ve
The TLD monitoring showed a large number of values below the detection limit of 0.2 mSv h-1 with 97,76 % and more than 98,81 % of the samples below 1 mSv month-1, indicat-ing low OEI exposure at the facility studied when compared to other situations, see Table 2. The estimated mean dose (0.12 mSv h-1) again indicated a mean exposure to low radiation when the occupational exposure occurred.
The frequency distribution to the TLD values and the individual electronic dosimeter indi-cated a good management of these two samplings. The large number of null values in the TLDs (98 %) and the small percentage of values with a zero exposure rate in the electronic dosimeters (2.45 %) indicated that the electronic dosimeters were used as complementation of monitoring when the potential dose was identified.
Evaluating the data globally, the high frequency of low values pointed out that the installa-tion offered low risks of external exposure. This conclusion does not mean to abandon the use of the monitors, as there are areas with high exposure rates (0.68 mSv h-1).
REFERENCES
[1] CNEN – Comissão Nacional de Energia Nuclear. Diretrizes Básicas de Proteção
Radio-lógica. Rio de janeiro: CNEN, 2014. 15 pp
[2] TRIPATHI, R. M.; SAHOO, S. K.; JHA, V. N.; KHAN, A. H.; PURANIK, V. D. Assess-ment of EnvironAssess-mental Radioactivity at Uranium Mining, Processing and Tailimgs Man-agement Facility at Jaduguda, India, Applied Radiation and Isotopes, V. 66, n 1, 1666-1670, 2008. DOI: 10.1016/j.apradiso.2007.12.019
[3] OYEDELE, J. A.; SHIMBOYO, S. SITOKA, S; GAOSEB, F. “Assessment of Natural Ra-dioactivity in the Soils of Rössing Uranium Mine and its Satellite Town in Western Na-mibia, Southern Africa,” Nuclear Instruments and Methods in Physics Research A, V. 610, N. 1-3, 467-469, 2010, doi.org/10.1016/j.nima.2010.01.068
[4] RACHAVENDRA, T.; RAMAKRISHNA, S. U.; VIJAYALAKSHMI, T.; ARUNACHA-LA, J. Assessment of Randos Concentration and External Gamma Radiation Level in the Environs of the Proposed Uranium Mine at Peddagattu and Seripally Regions, Andhra
Pradesh, India. Journal of Radiation Research and Applied, V. 7, N. 3, 269-273, 2014, doi.org/10.1016/j.jrras.2014.03.007.
[5] SRINIVAS, D.; RAMESH BABU, V.; PATRA, I.; RAMAYYA, M.; SHAILESH TRIPATHI, S.; CHATURVEDI, A. K. Assessment of Background Gamma Radiation Lev-els Using Airbone Gamma Ray Spectrometer Data over Uranium Deposits, Cuddapah Ba-sin, India and a Comparative Study of Dose Rates Estimated by AGRS and PGRS. J. of
Env. Radioactivity, V. 167, pp1-12, 2017. doi.org/10.1016/j.jenvrad.2016.11.027
[6] MATOS, E. C.; RUBINI, L. A. Reservas Brasileiras de Urânio e Sua Capacidade de Aten-dimento à Demanda Interna, In: Congresso Geral de Energia Nuclear - VII CGEN, 1999. Belo Horizonte.
[7] CIPRIANI, M. Mitigação dos impactos sociais e ambientais decorrentes do fechamento definitivo de minas de urânio.D. Sc Thesis, Campinas, São Paulo, 332 p. 2002.
[8] E.Lespukh, P.Stegnar, M.Yunusov, H.Tilloboev, G.Zyazev, P.Kayukov, A.Hosseini, G.Strømman, B.Salbu. Assessment of the Radiological Impact of Gamma and Randon Dose Rates at Former U Mining sites in Tajikistan. Journal of Environmental
Radioac-tivity. V. 126, 147-155, 2013. doi.org/10.1016/j.jenvrad.2013.07.019
[9] N. Karunakara, I. Yashodhara, K. Sudeep Kumara, R. M. Tripathi, S. N. Menon, S. Ka-dam, M. P. Chougaonkar. Assessment of Ambient Gamma Dose Rate Around a Prospec-tive Uranium Mining Area of South India – A ComparaProspec-tive Study of Dose by direct Meth-ods and Soil Radioactivity Measurements. Results in Physics. V. 4. 20-27, 2014. doi.org/10.1016/j.rinp.2014.02.001
[10] CNEN – Comissão Nacional de Energia Nuclear. Descomissionamento de Usinas
Nu-cleoelétricas. Rio de Janeiro: CNEN, 2012. xx pp
[11] PEREIRA, W. S.; KELECOM, A.; PEREIRA, J. R. S.; PY JÚNIOR, D. A. Release of Uranium by an Ore Treatment Unit at Caldas, MG, Brazil, Journal of Environment
Pro-tection, V. 4, N. 6, pp. 570-574, 2013. DOI:10.4236/jep.2013.46066
[12] CNEN – Comissão Nacional de Energia Nuclear. Critérios para Cálculo de Dose
Efeti-va a partir da Monitoração Individual. Rio de Janeiro: CNEN, 2011. xx pp
[13] INB - Indústrias Nucleares do Brasil, Plano de proteção radiológica do Complexo Minero Industrial Do Planalto De Poços De Caldas (CIPC), 56 pp, (1986).
[14] INB - Indústrias Nucleares do Brasil, Plano de proteção radiológica da Unidade de Tra-tamento de Minério, em condição de área parada, 26 pp, (2002).
[15] INB - Indústrias Nucleares do Brasil, Plano de proteção radiológica ocupacional da uni-dade de tratamento de minérios – UTM, 46 pp, (2012).
[16] KHATER, A. E; HUSSEIN, M. A; HUSSEIN, M. I., Occupational exposure of phos-phate mine workers: airborne radioactivity measurements and dose assessment. Journal of
Environmental Radioactivity, V. 75. N. 1, pp 47–57. 2004. doi.org/10.1016/j.jenvrad.2003.11.001
[17] ALM-LYTZ, K; RIIHILUOMA, V; HYVÖNEN, H., Occupational exposures of nuclear power plant workers in Finland, Radiation Protection Dosimetry. V. 96. N. 1-3, pp 39– 42. 2001, doi.org/10.1093/oxfordjournals.rpd.a006603
[18] PAKRAVAN, A. H; AGHAMIRI, S. M. R; BAMDADIAN, T; GHOLAMI, M; MOSHFEGHI, M; Dosimetry of occupational radiation around panoramic X-ray appa-ratus”. J Biomed Phys Eng, doi.org/10.22086/jbpe.v0i0.466
[19] FRIEDBERG, W; COPELAND, K; DUKE, F. E; O’BRIEN, K; EDGAR B. DARDEN, E. B., Radiation exposure during air travel: guidance provided by the federal aviation ad-ministration for air carrier crews. V. 79, N. 5, Health Physics, pp 591-595, 2000.