1
A Work Project, presented as part of the requirements for the Award of a Master Degree in Finance from the NOVA – School of Business and Economics.
Forecasting power of social media sentiment time series
Felix Paul Heller n° 23299
A Project carried out on the Master in Finance Program, under the supervision of:
Professor Pedro Lameira
2 Forecasting power of social media sentiment time series
Abstract
Social media are not only the new form of communication, but also give the ability to big industry players, like Facebook, to analyze overwhelming amounts of data about customers’ behavior. The focus of this study was to analyze if social media time series have the power to predict the evolution of financial markets. Despite the short time frame being analyzed, the study delivered promising results that social media time series may be a leading indicator for market behavior after special events. Building on my findings, an applied sentiment trading strategy delivered positive abnormal returns and statistically significant positive alpha in and out-of-sample.
Acknowledgments
I am very grateful for the supervision of my advisor Professor Pedro Lameira. Additionally, I would like to thank InfoTrie for providing the datasets & Ran Fuchs of FNA for his support
and help.
3
I.
Introduction
Web 2.0 and social media are the new form of technical revolution. Enormous amounts of data are generated and stored each second and have changed the way we interpret social and economic science. The usage of Facebook, Twitter, blogs and many more, lead to an increasing online activity, where information is spread over the world in a much faster way than before. In recent times, data is becoming the new gold. An unimaginable amount of datasets is collected by the big players, like Facebook, Google or Amazon for documenting and analyzing the behavior of costumers and markets (Ranco, Aleksovski, Caldarelli, Grcar and Mozetic, 2015). Fundamental analysis is still a major point when investigating investors’ decision making process but nowadays personal beliefs, trends, peer evaluation, information of news and social media are an increasingly important source of research (Vega, 2006). Rational and irrational investor’s behavior and the connection with market efficiency hypothesis have been former discussed in economic and financial literature (Oliveira, Cortez and Areal, 2013). However, datasets from online platforms paved the way for large-scale investigation of investors’ behavior in the financial world. In the 21st century, social media platforms offer the
opportunity to monitor the moods and feelings of a big part of the society in an aggregated and real time manner with almost zero costs. Social media data have been used to measure and forecast interesting topics such as brand popularity (De Vries, Gensler and Leeflang, 2012) and election outcomes (O’Connor, Balasubramanyan, Routledge and Smith, 2010).
Furthermore, social media and micro blogging platforms play a role as proxies of collective intelligence and sentiment of the market. Nevertheless, there are still doubts if social media can be used as predictive indicators and there is still a lack of research on this topic.
The existing literature identified two types of assessing financial markets with social media. The first one concentrates on the volumes of social media messages, like search engines queries, tweeting frequency over a certain topic or views and clicks analysis (Mao, Counts and
4
Bollen, 2011). The second type centers on attempts to predict the financial market evaluation via quantitative estimation of the content of social media (Oliveira, et al., 2013). These methods were used to anticipate markets ahead of time by considering tweets and analyze the meaning of social media messages from large groups in advance of return changes in the financial world (Zhang, Fuehres and Gloor, 2011). The computational statistics and data analysis of the sentiment of social media news is one way of determining the ‘crowd wisdom’ on a given event. This tool is a ‘Natural Language Processing and Opinion Mining’ synopsis which allows for the categorization of the polarity of unstructured text elements. Emotional scales are used, e.g. ‘happy’ vs. ‘afraid’ for classifying positive or negative sentiment. Thus, the analysis of sentiments expressed via social media may give the opportunity to gain deeper insights of the forecasting power of social media considering financial markets (Oliveira, et al., 2013).
However, the dimension of power of sentiment analysis methodologies in financial market prediction remains limited and faces a lot of drawbacks, especially when contentual analysis of social media messages is used. Using single words for identifying the polarity of news can be contra productive. Therefore, complex algorithms with highly intelligent methods have to be applied to get an accurate sentiment valuation (Ranco, et al., 2015)
This thesis focuses on investigating social media time series by using a combination of both types, volume and sentiment polarity to estimate the forecasting power. Initially, the main problem is to obtain the social media data sets with a longer time frame than half a year, as these datasets becoming increasingly important and are very expensive. This work studies the relation between stock prices and the sentiment expressed in social media with financial content over the period of three years. 30 companies of Dow Jones Industrial Average the (DJIA) and 25 stocks of the National Association of Securities Dealers Automated Quotations (NASDAQ) were analyzed, by building a time series of social media sentiment, with end of day data to mimic the “wisdom-of-crowd” and use it later for defining trading strategies.
5
The following section discusses the recent literature about social media and its relation to financial markets. Section III describes preparation and usage of data. Section IV explains the methodology taken to perform the event study and the trading strategy. Section V shows and discusses the results. The last part concludes this thesis and outlines further research suggestions.
II.
Literature Review
“You've got to be very cognizant of the correlation between social media links and business because they don't always correlate as highly as people would like.” (Mark Cuban, 2016). Despite 50 years of research of financial economists, the discussion continues over how public information is reflected in stock prices and if there is a way to predict the market evolution with public available data.
Most of prior research on stock returns after a certain news event approves the idea of underreaction, which means that people react proportionately to new information about a given security (Chan, 2003). However, there is also evidence that one-time strong news events can generate overreaction (Schuster, 2006). According to the availability bias, investors tend to densely weigh their conclusion towards more recent information (Barberis, Shleifer and Vishny, 1998). Another stream of research has discussed, whether news are public or private seems almost irrelevant. What matters is the range this information has (Vega, 2006). Consequently, a fairly new source of information spread, social media, is increasingly in the focus of research and used to predict the market mood. Social media are already used as a new data source by contemporary researchers in multiple areas: political science, sociology, linguistics, physics, computer science and finance (Zhang and Skiena, 2010). Authors determine that there is evidence that movements in broad indicators of major stock markets can be predicted by news media content. The authors proved positive correlation between high/low
6
pessimism of media and high trading volumes (Tetlock, 2007). Furthermore, researchers identified that web queries can be used to predict stock market volumes and to identify early indicators of financial systemic risk, based on the volume and activity of users of the World Wide Web (Bordino, Battiston, Caldarelli and Cristelli, 2012).
In fact, in 2015 75% of all Americans were using at least one social networking site every day, hence one can analyze this major source of information to get deeper knowledge about people’s mood in the United States (Smartinsights, 2015). Therefore, I considered the US as a perfect market for researching purposes, as the US has the highest density of social media use. To overcome this excessively amount of data, scientists use automatic text analytic tools like algorithms, which screen the web, based on linguistic pattern recognition (Groß-Klußmann and Hautsch, 2010). These filtered Datasets are much easier to analyze and can be used to identify significant effects. Since then, with using machine readable news and implementation of sentiment analysis, several papers have identified social media as a highly important source for financial applications (Zhang and Skiena, 2010).
A former paper states that there is significant prove of positive correlation between the stock’s trading volume and the count of a company’s name in the Financial Times (Alanyali, Moat and Preis, 2013). Furthermore, Twitter, a microblogging website, is increasingly used in financial analysis, due to its easy structure. A well-known paper analyses daily tweets to identify two types of mood: polarity and emotions. This sentiment analysis allowed the authors to increase the prediction ability of the Dow Jones Industrial Average (Bollen, Mao and Zeng, 2011). A quite similar approach was used by comparing reported media frequency and sentiment polarity with trading volumes and stock returns (Zhang and Skiena, 2010).
More recently, authors tried to identify which assets qualify most for trading purposes in an ex-ante sentiment methodology. The results showed that the sentiment can contain statistically significant ex-ante information on the future prices of the Standard & Poor’s 500 (Ilya Zheldudev, Robert Smith and Tomaso Aste, 2014). In an event study approach, significant
7
dependence between Twitter sentiment and abnormal returns during the highest level of Twitter volume was established (Ranco, et al., 2015).
This aggregated knowledge was used by authors to compute optional rule-based trading strategies built on the sentiment analysis of stocktwits (social media platform for investors) to accommodate the level of bullishness or bearishness of the online-investor-community towards certain shares. This strategy outperforms classical risk-return portfolios, however without considering transaction costs (Hochreiter, 2015). In the most recent paper, it is demonstrated that social media has a significant nonlinear impact on stocks returns. The results indicate that a nonparametric approach is highly preferable for the investigation of the relationship of social media and financial systems (Souza and Aste, 2016).
Having addressed the most appropriate findings and limitations of existing research connecting social media sentiment to financial markets predictions, the following research question will be examined in this thesis. Is there a continual relation between social media sentiment and changes in prices? Does social media sentiment have predictive power? Is the market reacting equally to the polarity of sentiment peaks of social media data? This thesis
evaluates the following hypotheses in order to answer the above research questions. Hypotheses 1: Only some moments, identified as events/peaks, show a strong relation between
social media sentiment and stock returns.
Hypotheses 2: Social media sentiment can be used to predict the evolution of the market in the
short term.
Hypotheses 3: The market is overreacting to negative sentiment peaks and shows a reversal
8
III. Data
When working with raw data it should be examined as a whole, before trying to generate specific implementations. While looking at correlation between stock price time series and social media sentiment time series, it appears that the relation is more complex and that measuring the dynamics of interaction only with correlation might not be the right way. Although it can be possible that they are dependent only at some specific time periods. In order to detect these moments the methodology of an “event study” known in economics and finance is used (Boehmer, Masumeci and Poulsen, 1991). This methodology allows to examine sentiment aggregation, different events, (known, e.g. Earnings announcements and unknown) and post-event effects.
The first source of data used for the analysis contains all 30 stock prices of the Dow Jones Industrial Average and the Index itself. For each stock a time series of daily returns, Rd
is computed.
(I) 𝑹𝒅 =
𝑷𝒅 − 𝑷𝒅−𝟏
𝑷𝒅−𝟏
where Pd is the closing price of the stock atday d. The data was collected over a period of 3
years, between 01.01.2013 and 01.02.2016. The data was downloaded from Bloomberg via the Excel add-in (Bloomberg, 2016).
The data for the social media sentiment analysis was provided by InfoTrie, a Big Data, Financial Engineering and News Analytics company whose cutting edge algorithms transform unstructured data for financial analysis. InfoTrie scans 6.000 websites, blogs, Twitter, and business news publications every 5 minutes. InfoTrie applies a supervised learning method to get the sentiment associated with its selection. They sort them by relevance and then conduct a sentiment analysis, where the sentiment score is a measure of the bullishness and bearishness of the data mentioning the certain company. The sentiment scores for every news found range from -5, negative, to + 5, positive. The individual scores are computed by an algorithm using
9
data mining and text mining (defined dictionary) methods. Moreover, InfoTrie provides the exact news volume of each company mentioned on a specific day. When using algorithms for analyzing text, word disambiguation is a major concern. However, InfoTrie applies a system where only social media messages with relevant financial content is analyzed. Special machine learning processes have been adapted, which leads to more precise filtering. Infotrie provided a dataset with daily frequency, end of day, from 01.01.2013 - 01.02.2016. The dataset contains all 30 companies of the DJIA1, and a random sample of 25 stocks of NASDAQ2 (InfoTrie, 2016).
Furthermore, I will run regressions with the strategy’s returns to test for robustness. Therefore, I obtained the Fama-French Factors and the Momentum factor with daily/monthly frequency from Kenneth R. French online data library.
IV.
Methods
Firstly, this section shows the event study methodology, by demonstrating the detection of specific events. Furthermore the categorization of events based on social media sentiment, and the statistical validation of the cumulative abnormal returns. Secondly, it describes the implementation of the trading strategy.
IV.I. Event study
In this thesis, the methodology used is based on an event study as defined in financial econometrics (MacKinlay, 1997). The efficient-market hypothesis (EMH) states that asset prices fully reflect all available information in the market however, there are certain studies which show that specific events can affect stock prices ex-post (Luke Qiu, 2014). External events can lead to abnormal returns of specific stocks. An event study tries to prove
1 Dow Jones Industrial Average
10
the existence of these abnormal returns after events (MacKinlay, 1997).
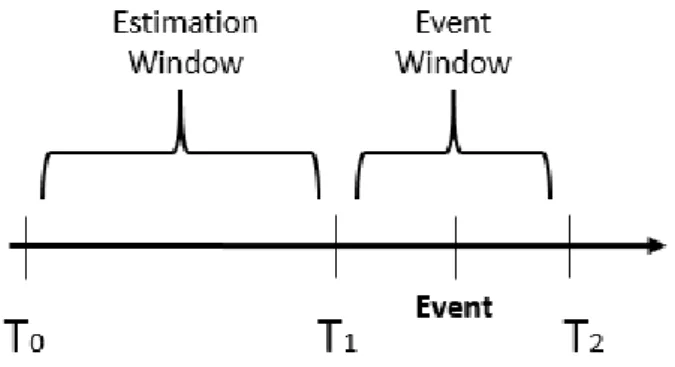
First of all, these events have to be identified, either automatically using certain criteria, or taking public known events, such as earnings announcements or spin-offs. Each event has its own ‘polarity’, whether the event should have a positive, negative or neutral effect on the asset price. Afterwards the returns of the events are analyzed. However, to focus only on isolated events affecting a specific stock, the method removes the noise of the market to which the stock belongs. This is accomplished by using the market model, which is explained in detail later in this section. After identifying the events, a period, over which the certain stocks are affected by these events had to be defined: the event window, as shown in Figure 1 (Ranco, et al., 2015).
In this paper the event window has 18 days, 9 days prior the event and 9 days after it. The reason for considering a certain period before the event is that the market can acquire information prior to the examined event and one can study this possibility by looking at pre-event returns. If there is an impact of the pre-event one needs a measure to prove the existence of abnormal returns (Boehmer, et al., 1991).
The abnormal return is the actual ex-postreturn of the stock minus the normal expected return of the stock over the event window. The normal expected return is defined as the return that would be expected if the event did not happen. For each stock i and event date d, we have:
(2) ARi,d = Ri,d – E[Ri,d],
where ARi,d, Ri,d, E[Ri, d] are the abnormal, actual, and expected normal returns, respectively.
11
There exist two typical approaches for generating the expected normal return: the constant-mean-return model, and the market model. The constant-constant-mean-return model assumes that expected asset returns can differ by company, but are constant over time. The market model, which is used in this paper, assumes a stable linear relation between the overall index return and the individual stock returns.
The next sections first describe the method applied to identify social media volume peaks which are then considered as events. Second, a method to attach polarity to these events, using the social media sentiment, is described. Conclusively, a special type of events is discussed, called earnings announcement events (abbreviated EA), which have been already studied in prior research, e.g. Brandt, Kishore, Santa-Clara & Venkatachalam, 2008.
To identify social media activity peaks, for every stock, the time series of its daily sentiment volume, provided by InfoTrie, is used. I name it SMd. I defined a volume baseline,
which averages the 3 highest SMd of the previous week to get a comparable volume activity,
named SMb. For detecting spikes in news volume, an outlier fraction ϕ, is defined:
(3) ϕ = (SMd –SMb) / max (SMb, average (SMd 40 days), 20)
I subtract the volume baseline from the daily sentiment volume and divide it by the highest values of 3 parameters: volume baseline (SMb), average of 40 days of SMd & 20 volume units. Sometimes there are low activity days or even no activity days over a certain period, which would lead to peaks where no peaks are. Therefore, I define that at least 20 volume units must have occurred for an eventual peak detection however, most of the time the two other parameters are used. There is a volume activity peak if the outlier fraction is higher than a predefined threshold:
ϕ > ϕ
t, I set the threshold to 1.5:ϕ
t =1.5. The thresholdϕt
detfines thenumber of detected peaks. As a final step, a filter which removes detected peaks that are less than 9 days apart from an identified peak is applied to avoid leverage effects, because sometimes the method detects more peaks for the same event. A threshold is always a little
12
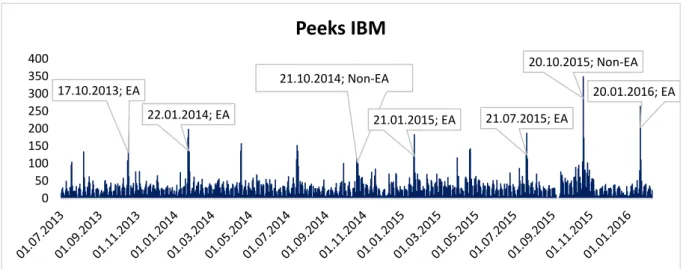
restrictive, therefore a sentiment analysis to identify the best strategy and test for robustness has been conducted which is shown later in the result section. For illustration purposes, the resulting activity peaks for the IBM stock are shown in Figure 2.
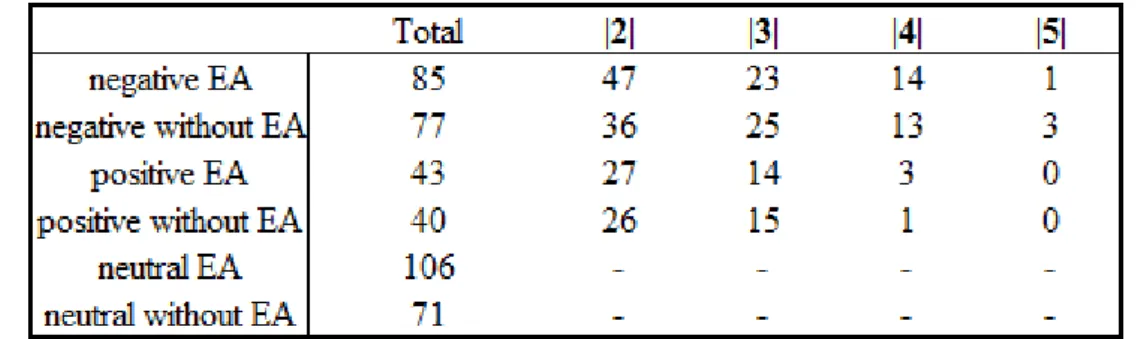
The detected events are then assigned polarity and type (earnings announcement or not). The polarity is subdivided in: negative, neutral or positive. The sentiment polarity Pd for each company delivers the market mood about the stock at a certain day. From the data, 382 events are detected. To obtain three sets of events the following thresholds are selected, and the event polarity is defined as follows:
If Pd ∈ [−1,1] the event is a neutral event, If Pd ∈ [< -1] the event is a negative event, If Pd ∈ [> 1] the event is a positive event.
Setting thresholds is always slightly arbitrary, and there is no systematic treatment of this issue in the event study (MacKinlay, 1997). However, dealing with sentiment data a threshold for analyzing purposes has to be defined. The data set ranges from −5 highly negative to +5 really positive. This concept can be found in similar approaches, i.e., comparing the sentiment leaning of network communities towards different environmental topics and to compare conspiracy to emotional reactions and science posts on different social media websites (Sluban, B., Smailović, J., Battiston, S. & Mozetič, I., 2015). Recent research have shown that for a specific type of
17.10.2013; EA 22.01.2014; EA 21.10.2014; Non-EA 21.01.2015; EA 21.07.2015; EA 20.10.2015; Non-EA 20.01.2016; EA 0 50 100 150 200 250 300 350 400
Peeks IBM
13
events i.e., quarterly earnings announcements (EA), the price return of a stock abnormally jumps in the direction of the earnings (Brandt, et al. 2008).
The findings indicate that social media data show high volume activity during the EA events, as expected. However, there are also other peaks in volume, which do not correspond directly to EA. In the examined period 330 EA have occurred according to Bloomberg (Bloomberg, 2016). The method used, detected 198 EA, which means 60 % of it were correctly discovered. The remaining 184 events are non-EA events. This number shows that there exist a high number of events which cannot be explained by EA events. See Table 1.
The impact of the EA events on price returns is already studied in prior literature, and the goal is to reconfirm these results (Brandt, et al., 2008). However, of more interest is the impact of non-EA events on prices. Therefore, the event study is performed in two scenarios. First, only EA events are used then only non-EA events are used. The first scenario gives the opportunity to compare the results of social media sentiment with the existing literature in financial econometrics (Boehmer, et al. 1991). With the analysis of the non-EA events, I try to ascertain if social media data contain information about stock market returns evolution.
In this part the market model procedure for the event study is briefly explained. The market model is a statistical model. The return of a given security depends on the return of the market. The extent of the stock’s responsiveness is measured by beta. The model’s linear specification follows from the assumed joint normality of asset returns (Ranco, et al., 2015). As the analyzed companies are all part of the Dow Jones Industrial Average Index, it seems obvious to use the DJIA as the market. For each stock i, and date d, the market model is:
14 (4) Ri,d = αi + βiRDJIA,d + εi,d
(5) E(εi,d) = 0, Var(εi,d) = σ2 εi,d
(6) E[Ri,d] =𝜶̂𝒊+ 𝜷̂𝒊 RDJIA, d
where Ri,d and RDJIA, d are the returns of the stock(i) and the market(DJIA), respectively. The εi,d
is the zero mean disturbance term and αi,, βi, εi,d are the parameters of the market model. αi, is
the intercept, βi the slope and εi,d is the random error. To evaluate these parameters for a
detected event an estimation window (see figure 1) of T = 120 trading days is used. The parameters are estimated by ordinary least squares regressions (OLS) for each security. A method for estimating the unknown parameters in a linear regression model. The abnormal returns are calculated by subtracting the intercept, and the slope times the market return from the actual return:
(7) ARi,d = Ri,d - 𝜶̂𝒊 - 𝜷̂𝒊 RDJIA, d
The null hypothesis, H0, is that external events will have no impact on the properties of returns.
Under H0, abnormal returns will be normally distributed with a zero mean:
(8) ARi, t ∼ (0, σ2 (ARi, t))
Usually individual return data is too noisy to allow inference of event effects based upon a single stock, which necessitate aggregation of abnormal returns across securities:
(9) AAR = (1/N) * ∑𝑵𝒊=𝟏𝑨𝑹𝒊,𝒕
Additionally, uncertainty about when the event information has entered the market often requires aggregation of abnormal returns over time.
(10) CAAR(t1,t2) = ∑𝒕𝟐𝒕=𝒕𝟏𝑨𝑨𝑹𝒕
15
H0 : AAR = 0 is given by t-test:
(11) tAARt = √𝑵 𝑨𝑨𝑹𝒕
𝑺𝑨𝑨𝑹𝒕, where SAARt is the standard deviation across firms at time t.
(12) 𝑺𝑨𝑨𝑹𝒕 = (𝟏/𝑵 − 𝟏) ∗ ∑𝑵𝒊=𝟏(𝑨𝑹𝒊,𝒕- AARt)2
Test statistic for testing H0: CAAR = 0 is given by:
(13) tCAAR = √𝑵 𝑪𝑨𝑨𝑹
𝑺𝑪𝑨𝑨𝑹, where SCAAR is standard deviation of the cumulative abnormal returns across the sample.
(14) 𝑺𝑪𝑨𝑨𝑹𝒕 = (𝟏
𝑵− 𝟏) ∗ ∑ (𝑪𝑨𝑹𝒊 𝑵
𝒊=𝟏 - CAAR) (Boehmer, et al. 1991).
IV.II. Trading Strategy
Regarding the findings in the event study a trading strategy is structured and back-tested. To avoid over-fitting and forward looking bias there are some key guidelines for the setting up of
the strategy.
First, for every stock the same set-up process is used and there is no individual fitting.
Second, as this strategy is not a long-short strategy, money is needed. Therefore the risk free
rate matters, however for simplicity reason and the current circumstances, where the risk free rate is around zero during the examined period, this problem is disregarded. Third, as the strategy was generated with in-sample data, an out of sample strategy will be applied.
Forth, the last guideline has to do with trading costs. The back test tries to imitate the trading costs of the strategy. I assume 5 basis points for each trade (bid-ask spread and brokerage costs).
Liquidity should not be a major concern as all stocks included in the strategy are very liquid. Several metrics to measure the performance of the strategy and make it comparable are
observed:
16
I) Sharpe Ratio (SR):
(14) SR= Rt/𝜎Rt
II) Maximum drawdown (MDD) up to time T.
(15) MDD(T) = max rε(0,T) [max tε(0,τ) X(t) –X(τ)] Finally, I will use the Fama-French model,
(16) ri = RF + βimkt RMRF + βisize SMB + βivalue HML
trying to explain the results in more detail. Therefore a regression analysis is done checking if the alphas and betas are positive and significant with the sentiment strategy returns. I will add the Momentum factor as well (Carhart model) to get more sophisticated results. Finally, a sensitivity analysis on the thresholds and parameters defined earlier is conducted.
V.
Results
This section presents the results of the event study applied to social media sentiment time series and stock returns. Furthermore it shows the results of a trading strategy where the findings of the event study are implemented.
V.I. Cumulative Returns of EA events
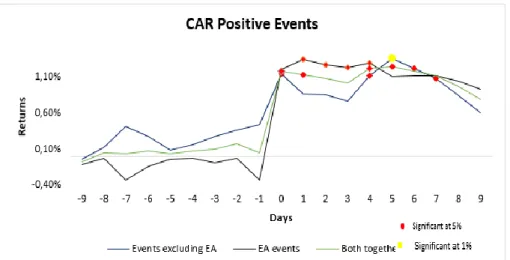
The event study results are displayed in figures 4, 5 and 6, where the cumulative abnormal returns (CAR) are plotted for the two different types of events and the pooling of both. Firstly, the focus is on the EA-event results. The results seem to confirm the prior literature on the information content of earnings (Campbell, Lo & MacKinlay, 1997). The CAAR for EA events is exceptionally increasing on the event day after positive sentiment peaks. They reach around 1.1% and it seems that the returns stay almost at the same level for four days and then begin to weaken. The CAAR of positive EA-events after the announcement are significant at the 5% level for four days. Therefore, H0, the events have no impact on stock returns is rejected. This
17
The average CAAR for the neutral EA-events seem pretty irregular and non-meaningful as one could have expected. The cumulative abnormal returns on the event day and after are not statistically significant so the null hypotheses that the events have no impact on the returns cannot be rejected, see Figure 5.
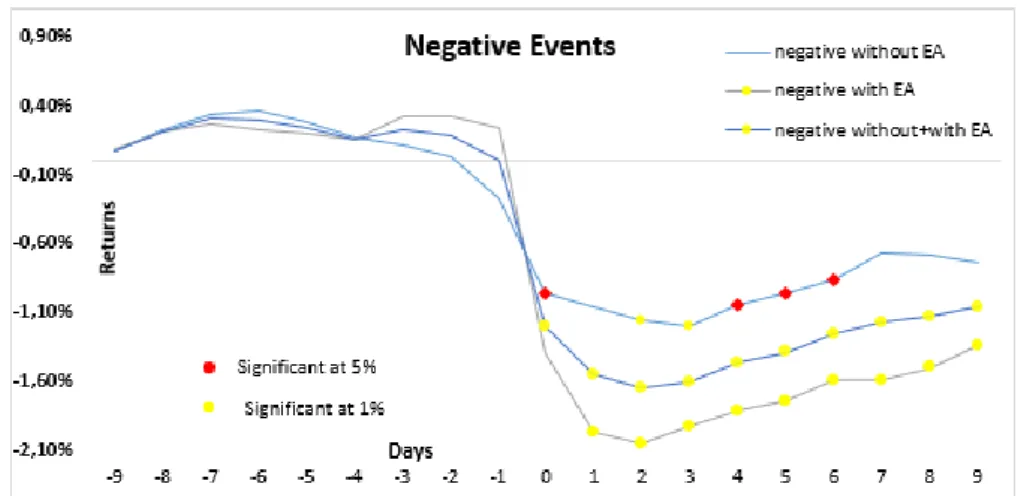
The event study shows that the negative sentiment events have the largest CAAR in absolute terms and the cumulative returns are significant at the 1% level at and after the event. The null hypotheses that the negative events have no impact on price returns, can be rejected. Moreover, a clear pattern can be seen in the graph, where the returns continuously begin to reverse three days after the event. An equal effect was researched by Ranco and is consistent with my findings (Ranco et al., 2015), as figure 6 shows:
Figure 5: Cumulative abnormal returns after neutral sentiment peaks at EA events and non-EA events Figure 4: Cumulative abnormal returns after positive sentiment peaks at EA events and non-EA events
18 V.II. Cumulative Returns non-EA events
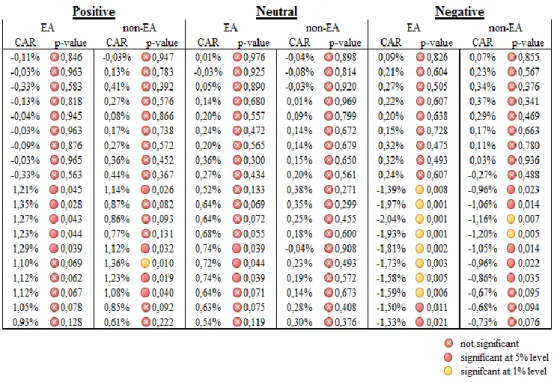
Due to a lack of research the non-EA events are of more interest. When removing the earnings announcements, the CAAR are still abnormally increasing in absolute terms after the detected event. The positive non-EA events CAAR are not significant the first 3 days after the event, although they become significant even at a 1% level the next day and remain significant for 2 more days. Therefore, the null hypothesis that non-EA have no impact on stock returns cannot be fully rejected regarding the positive sentiment peaks. One could argue that the real positive effect of such an unknown event has a delay however, the positive reaction does not last for long. Regarding the neutral non-EA events the null hypothesis cannot be rejected and no clear pattern can be seen. The negative non-EA events give some indication that the CAAR are meaningful after the sentiment volume peak. Figure 6 shows that after the peak, the average cumulative returns remain statistically significant for one week after the negative event, so one can reject the null hypothesis that negative non-EA events have no impact on price returns. Although the period of influence of social media sentiment on returns is shorter when earnings events are removed and CAAR are lower, the returns are still statistically significant. All statistics are summarized in Table 2.
In conclusion, the first two hypotheses that some moments, identified as peaks, show a
strong relation between social media sentiment and stock returns, and that social media
19 sentiment can be used to predict the evolution of the market, can be accepted.
V.III. Speculation on the abnormal return
With examining all three polarities separately, the negative one shows the most transparent and significant pattern. The combination of sentiment analysis and event study leads to the conclusion that the market seems to overreact to negative news and reverses after a few days. Therefore, the resulting trading strategy to maximize one’s return would be to buy stocks when the market begins to reverse. All 30 companies are watched simultaneously and if a negative peak in sentiment volume occurs, the investor can react. This can be realized by buying the stocks just before the stock exchange closes on the third day after the event. The following day was estimated to have a positive and significant AAR and was followed by trading days which have positive AAR as well. The trader is recommended to hold his long position over this period and only should close it after 5-8 days. This strategy has the advantage that the stocks are bought by the end of a trading day. This day is expected to generate a negative return and then be followed by positive return days. Even more appealing is that this trading strategy takes place post-event, so investors have the opportunity to react to unexpected information which can
20
occur after the event. I also applied a positive sentiment strategy, although the results were rather weak. Below, a graph of the cumulative returns and the performance measures of the sentiment trading strategy, just described, against an equally weighted strategy of the 30 companies in DJIA.
The period examined was remarkably good for equities, however the sentiment strategy outperforms the DJIA in every performance measure. One has to keep in mind that there is survivorship bias e.g. Apple, however for simplicity reasons this matter is disregarded.
The sharpe ratio with 2.4 is significantly higher than the sharpe ratio of the equal weighted strategy of DJIA. The maximum drawdown is also highly impressive with just around 9%. The strategy outperforms the DJIA especially in the second half of the examined period. The sentiment strategy is positively skewed, which indicates a distribution with an asymmetric tail extending toward more positive returns. The strategy has a kurtosis of 18,22 which is compared
Figure 7: Cumulative returns of Sentiment Trading Strategy against equally weighted DJIA over the period of 3 years
21
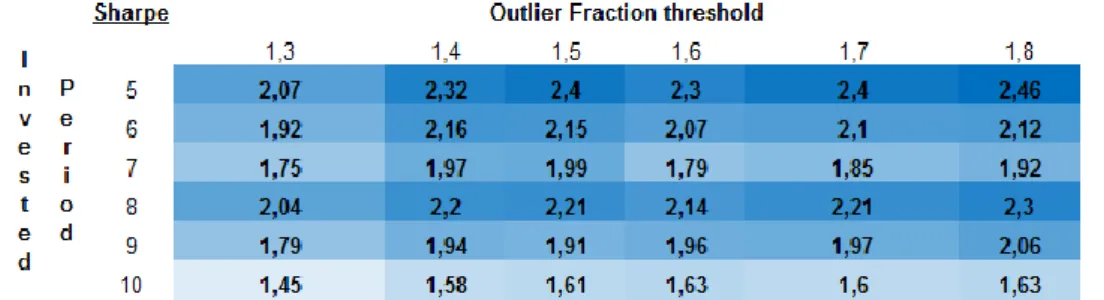
to a normal distribution (kurtosis = 3) a high value. This means that the sentiment strategy has fat tails. This could have been expected, as the strategy concentrates on special events with extraordinary high returns. As over-fitting is a major concern in back-testing, I run a sensitivity analysis changing the outlier fraction threshold ϕ and the investing period in days after the detected peak, seen in Table 3.
The table illustrates that the strategy is very robust and shows decent sharpe ratios over several input parameters. The best results occur if one would invest only 5 days with the outlier fraction threshold of 1,8.
Furthermore, the multiple regression with Fama-French factors and Momentum leads to this outcome (Carhart Model):
The fact that alpha is significant at the 1% level indicates a daily outperformance of 0,11% with regard to the Carhart model. Table 4 affirms that the market beta is positive and significant, this means that the returns are partly explained by the market. Moreover, the Small minus Big is negative but not significant. Negative coefficients imply that movements in the sentiment strategy behave more similarly to large cap than small cap stocks. This could have been expected as all the stocks watched are all big stocks. The High minus Low is positive and significant at the 5% level. The momentum factor is significant but negative. One has to keep in mind that the Carhart model takes monthly momentum into account. This might be the reason for the negative correlation between the two factors, given that the strategy concentrates on
Table 4: Multiple regression results of in-sample strategy's returns with Carhart model.
22
special events where significant positive or negative price changes may occur in a short period of time. Trying to test the fit of the model, the coefficient of determination R2 is important. One can find a low value of 0,24 because of the significant and positive alpha.
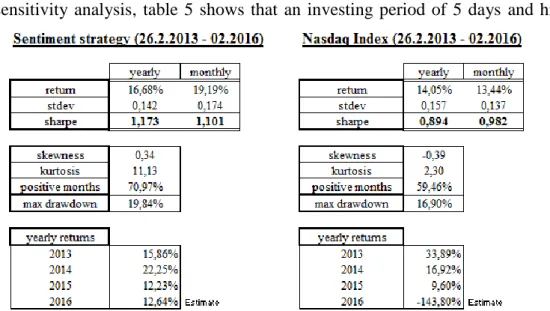
One can always argue that past performance generated in a back test does not guarantee future returns, but it is one of the few ways to test if any strategy works. Now I will test the strategy out-of-sample, with 25 random picked stocks of the NASDAQ. Figure 9 shows that the out-of-sample strategy has decent results, even though it does not outperform the NASDAQ, which was used as a benchmark, as high as the strategy against the DJIA does. One has to keep in mind though that the NASDAQ performed pretty well in this period.
The sensitivity analysis, table 5 shows that an investing period of 5 days and higher
outliers lead to better sharpe ratios. This might be due to picking more sophisticated events. Testing for further prove, I ran the regression against the Carhart model. Table 6 shows that the
outof sample has a significant alpha, although the value is with 0.06% lower than the in-sample alpha. The market beta is positive and significant which indicates that most of the returns are
Figure 9: Performance measures of negative sentiment strategy out-of-sample and the NASDAQ Index
23
indicated by the market. The fact that both in and out-of-sample analysis show a positive and significant alpha, seems to confirm the third hypotheses that the market is overreacting to
negative sentiment peaks and shows a reversal after. To conclude, the results point in the
direction that negative sentiment time series can help to improve the ability to predict the evolution of the market.
VI. Discussion
VI. I. Conclusion
The purpose of this thesis was to extend the understanding of the impact of social media on investors’ behavior and to complement previous research. A series of other papers has already shown that there is a connection between social media and investor’s behavior. Sentiment analysis has the ability to pool market moods. This may give the opportunity to implement trading strategies and if not, then at least generate insights about financial market behavior. As social media are becoming increasingly influential in recent times, the proper use and selection can be decisive when applying strategies. For this reason, identifying events and combining it with social media sentiment data is one way to generate useful information. There seems to be another way to use the combination of social media news volume and investors sentiment to predict the market more precisely, and generate a profitable trading strategy. The key result of this thesis is that negative social media sentiment during identified events, may help to predict the direction of market evolution.
VI. II. Future research and limitations
Suggestions for future research are highly connected to the limitations of this thesis. The most appropriate direction for future research would be to apply the same strategy to several
24
markets, not just the United States. Furthermore, the use of daily data may be a limitation. Therefore, one could use hourly, or even smaller time steps analyzing social media to get deeper knowledge about market behavior. Moreover, there may be moods in the market which cannot be detected by a combination of volume and sentiment of the crowd. For that reason, different triggers, e.g. the number of clicks or retweets might be interesting for further research. Future research can investigate long term triggers, rather than short time triggers by applying similar methodologies. Finally, the data set is small and equities did well during this period. I would suggest repeating the study with a much longer period of time and different securities, although sentiment data is in great demand and therefore expensive. To summarize, all these suggestions would be a valuable and interesting contribution to the research conducted in this thesis.
References:
1) Alanyali M., Moat H.S. & Preis T. 2013. “Quantifying the Relationship between Financial News and the Stock Market.” Scientific Reports, 2.
2) Barberis N., Shleifer A. & Vishny R. 1998. “A model of investor sentiment” Journal of Financial Economics, 49: 307-343.
3) Bloomberg L.P. (2006) Stock prices 01/01/13 to 03/03/16. Retrieved Feb. 8, 2016 from Bloomberg database.
4) Boehmer, E., Musumeci J. & Poulsen, A.B. 1991. “Event-Study Methodology under Conditions of Event-Induced Variance.” Journal of Financial Economics, 30 (2): 253-272. 5) Bollen, J., Mao, H., & Zeng, X. 2011.”Twitter mood predicts the stock market.” Journal
of Computational Science, 2: 1-8.
6) Boudoukh, J., Feldman, R., Kogan, S. & Richardson, M. 2013. “Which news moves stock prices? A textual analysis.” 46.
7) Brandt M., Kishore R., Santa-Clara P. & Venkatachalam M. 2008. “Earnings Announcements are Full of Surprises.” SSRN: http://ssrn.com/abstract=909563
8) Campbell, J.Y., Lo, A.W. & MacKinlay, A., 1997. The econometrics of financial markets. Princeton: Princeton University Press.
9) Chan, W.S. 2003. “Stock price reaction to news and no-news: drift and reversal after headlines.” Journal of Financial Economics, 70: 223-260.
25
10) De Vries, L., Gensler, S. & Leeflang, P.S.H. 2012.”Popularity of Brand Posts on Brand Fan Pages: An Investigation of the Effects of Social Media Marketing.” J. In. M. 26, 83-91. 11) O’Connor, B., Balasubramanyan, R., Routledge, B. R. & Smith, N. A. 2010. ”From tweets to polls: Linking text sentiment to public opinion time series.” Proc. of I AAAI.C. 8. 12) Groß-Klußmann A. & Hautsch N. 2011. “Using automated text analytics to quantify high
frequency news-implied market reactions.” Journal of Empirical Finance, 18: 321-340. 13) Hochreiter, R. 2015. “Computing trading strategies based on financial sentiment data using
evolutionary optimization.” http://arXiv:1504.02972.
14) InfoTrie: Website. http://www.infotrie.com. Last accessed on March 10, 2016.
15) MacKinlay, AC. 1997. “Event studies in economics and finance.” J. E. literature. 13–39. 16) Mao, H., Counts, S. & Bollen, J. 2011. “Predicting financial markets: Comparing survey,
news, twitter and search engine data.” ArXiv e-prints.
17) Oliveira, N., Cortez, P. & Areal, N. 2013. “Some experiments on modeling stock market behavior using investor sentiment analysis & posting volume of Twitter.” Pro. 3rd ICWI 9. 18) Qiu L. 2014. “Earnings Announcement and Abnormal Return of S&P 500 Companies.” 19) Ranco, G., Aleksovski, D., Caldarelli, G., Grčar, M. & Mozetič, I. 2015. “The Effects
of Twitter Sentiment on Stock Price Returns.” PLoS ONE, 10 (9).
20) Schuster T. 2006. The markets and the media. Oxford: Lexington Books, 46
21) Sluban, B., Smailović, J., Battiston, S. & Mozetič, I. 2015. “Sentiment Leaning of Influential Communities in Social Networks.” Computational Social Networks. 2 (9). 22) Smartinsights: Website. http://www.smartinsights.com. Last accessed on April 11, 2016. 23) Sprenger, T.O., Sandner, P.G., Tumasjan, A. & Welpe, I.M. 2014. “News or Noise?
Using Twitter to Identify and Understand Company-specific News Flow.” Journal of Business Finance & Accounting 41 (7-8): 791–830.
24) Tetlock, P.C. 2007. “Giving content to Investor Sentiment: The Role of Media in the Stock Market” Journal of Finance, 62, No. 3.
25) Vega, C. 2006. “Stock price reaction to public and private information.” J. E. 82: 103-133. 26) Zhang, W. & Skiena, S.. 2010. “Trading Strategies to Exploit Blog and News Sentiment.”
In Proceedings of the 4th International AAAI Conf. on Weblogs and Social Media.
27) Zhang, X., Fuehres H. & Gloor PA. 2011.”Predicting stock market indicators through twitter. I hope it is not as bad as I fear.” Procedia Soc. Behav. Sci. 26: 55–62.
28) Zheludev, I., Smith, R. & Aste, T. 2014. “When can social media lead financial markets?” Scientific Reports, 4.