Graduated in Biology - Educational field
Storage of Water Molecules
into Biomimetic Heterostructures:
The Role of Roughness
Dissertation to obtain the PhD Degree in Biomedical Engineering
Supervisor: Maria de Fátima Guerreiro da Silva Campos Raposo,
Assistant Professor, Universidade Nova de Lisboa
Co-supervisor: Pedro António de Brito Tavares,
Assistant Professor, Universidade Nova de Lisboa
Júri:
Presidente: Prof. Doutor António Manuel Dias de Sá Nunes dos Santos Arguente(s): Prof. Doutor João Filipe Colardelle da Luz Mano
Prof. Doutora Ana Maria da Conceição Ferraria Vogais: Prof. Doutora Maria Adelaide de Almeida Pedro de Jesus
Prof. Doutora Ana Margarida Madeira Viegas de Barros Timmons Prof. Doutora Maria de Fátima Guerreiro da Silva Campos Raposo Prof. Doutor Paulo António Martins Ferreira Ribeiro
Prof. Doutora Quirina Alexandra Tavares Ferreira
© Andreia Arrimar Duarte; FCT/UNL; UNL
Storage of Water Molecules into Biomimetic Heterostructures: The Role of Roughness
Don´t get set into one form,
adapt it and build your own,
and let it grow, be like water.
Acknowledgements
I would like to express my sincere gratitude to my supervisor Prof. Dr. Maria Raposo for her support,
understanding, generosity and encouragement that were of great value while pursuing this work. Her perseverance and assertiveness allowed good personal and professional relationships. I certainly appreciate the prolific scientific guidance and the opportunity of being part of a research group. I would like to thank Prof. Dr. Pedro Tavares for accepting to be my co-supervisor. I am very grateful
for his comprehension, patience and scientific cooperation during this period.
I acknowledge both Prof. Dr. Ana Barros and Prof. Dr. Maria Adelaide de Jesus for accepting to be
part of the monitoring committee, and for their precious advice that helped the progress of this research work.
I warmly thank to Doctor Paulo Gomes for his many years of friendship and for the fruitful challenge of
joining science and education, but also for the Vacuum Ultraviolet spectroscopy measurements. I am very grateful to Prof. Dr. Paulo Ribeiro for reading drafts, helpful asking, insightful questions, and
his spontaneous good mood.
Special thanks to Mestre Luís Abegão for technical support in quartz crystal microbalance
measurements implementation, for the extended scientific discussions, but above all for his optimism and willingness.
I am very grateful to Doctor João Lourenço for thesupport and technical advices and to Eng. Jorge Ribeiro for the precious technical designs and I would like to extend my sincere thanks to all of the
other members that have been part of the Sistemas Moleculares Funcionais research group, for the opportunities over the years, the provided and developed support.
I would like to thank the entire research staff and students with whom I’ve worked with, mainly
Francisco Brasil, João Lourenço, Sérgio Filipe and Tiago Valente for their continuous help in daily
laboratory life.
I thank Dr. Cristina Cordas and Dr. Filipe Folgosa from Departamento de Química of FCT-UNL, for
their helpful assistance, sympathy and collaboration.
I want to thank Dr. Joana Pinto and Mestre Tomás Calmeiro from CENIMAT of FTC-UNL for the
atomic force microscopy ex situ measurements.
I want to thank Prof. Dr. António Lopes from ITQB-UNL for DLS measurements.
I would also like to thank Prof. Dr.Ana Viana and Doctor Joaquim Marquês from Centro de Química e
Bioquímica, Faculdade de Ciências, Universidade de Lisboa, for their fruitful collaboration and atomic force microscopy in situ and ellipsometry measurements.
I want to thank Prof. Dr. Ana Botelho do Rego from Centro de Química Física Molecular, Instituto
Superior Técnico, Universidade de Lisboa, for her collaboration and discussion with the measurements made on the x-ray photoelectron spectroscopy facility.
I want to thank Doctor Søren Vrønning Hoffmann from Institute for Storage Ring Facilities, University
of Aarhus, Denmark, for providing the facilities to carry out VUV measurements.
I want to thank Prof. Dr. Benachir Bouchikhi from Sensor Electronic & Instrumentation Group, Moulay
I want to thank to Dr. Marco Salerno from Istituto Italiano di Tecnologia of Italy for his help in statistical
analysis of atomic force microscopy images.
I also thank Prof. Dr. Osvaldo Novaes Jr. and Dr. Marli Moraes from Grupo de Física de Polímeros do
Instituto de Física São Carlos for collaboration on several developed projects.
I want to acknowledge Mestre Ana Carapeto for the valuable suggestions in quartz crystal
microbalance technique.
Many thanks to all, Mr. Arez, Mrs. Fátima, Mrs. Helena, Mrs. Ana Cruz and Mrs. Luiza Oliveira, from Physics Department and CeFiTec, for their help in my administrative adventures.
Special thanks to all elements that belong to Novo Núcleo Teatro from FCT-UNL, for the contribution
in my personal and interpersonal development, for the fantastic opportunities experienced in the university theater world, but above all for their dedication and friendship.
To my friends, I will not point names but you know who you are, who accompanied me throughout these years thanks for being part of my journey.
Naturally and not less important, I must thank my parents Carlos Duarte and Rosinda Arrimar for their
constant support and encouragement who selflessly supported me during my graduate education and my entire life.
I want to express my gratitude to my sister Neuza Arrimar Duarte for being an example of dedication
and perseverance and for the scientific and artistic inputs.
I also thank to Departamento de Física, Universidade Nova de Lisboa, for providing the logistic
conditions.
Abstract
The development of devices based on heterostructured thin films of biomolecules conveys a huge contribution on biomedical field. However, to achieve high efficiency of these devices, the storage of water molecules into these heterostructures, in order to maintain the biological molecules hydrated, is mandatory. Such hydrated environment may be achieved with lipids molecules which have the ability to rearrange spontaneously into vesicles creating a stable barrier between two aqueous compartments.Yet it is necessary to find conditions that lead to the immobilization of whole vesicles on the heterostructures. In this work, the conditions that govern the deposition of open and closed liposomes of 1.2-dipalmitoyl-sn-Glycero-3-[Phospho-rac-(1-glycerol)] (sodium Salt) (DPPG) onto
polyelectrolytes cushions prepared by the layer-by-layer (LbL) method were analyzed. Electronic transitions of DPPG molecules as well as absorption coefficients were obtained by vacuum ultraviolet spectroscopy, while the elemental composition of the heterostructures was characterized by x-ray photoelectron spectroscopy (XPS). The presence of water molecules in the films was inferred by XPS and infrared spectroscopy. Quartz crystal microbalance (QCM) data analysis allowed to conclude that, in certain cases, the DPPG adsorbed amount is dependent of the bilayers number already adsorbed. Moreover, the adsorption kinetics curves of both adsorbed amount and surface roughness allowed to determine the kinetics parameters that are related with adsorption processes namely, electrostatic forces, liposomes diffusion and lipids re-organization on surface. Scaling exponents attained from atomic force microscopy images statistical analysis demonstrate that DPPG vesicles adsorption mechanism is ruled by the diffusion Villain model confirming that adsorption is governed by electrostatic forces. The power spectral density treatment enabled a thorough description of the accessible surface of the samples as well as of its inner structural properties. These outcomes proved that surface roughness influences the adsorption of DPPG liposomes onto surfaces covered by a polyelectrolyte layer. Thus, low roughness was shown to induce liposome rupture creating a lipid bilayer while high roughness allows the adsorption of whole liposomes. In addition, the fraction of open liposomes calculated from the normalized maximum adsorbed amounts decreases with the cushion roughness increase, allowing us to conclude that the surface roughness is a crucial variable that governs the adsorption of open or whole liposomes. This conclusion is fundamental for the development of well-designed sensors based on functional biomolecules incorporated in liposomes. Indeed, LbL films composed of polyelectrolytes and liposomes with and without melanin encapsulated were successfully applied to sensors of olive oil.
Resumo
A criação de dispositivos baseados em filmes finos heteroestruturados de biomoléculas podem contribuir em larga escala para o desenvolvimento da área da biomedicina. No entanto, a eficácia destes dispositivos está dependente das condições que permitem manter as moléculas biológicas hidratadas e, portanto, é necessário que estas heteroestruturas armazenem água. Um ambiente hidratado pode ser obtido a partir de moléculas lipídicas que têm a capacidade de se reorganizar espontaneamente em vesículas criando uma barreira estável entre dois compartimentos aquosos. Contudo, é necessário encontrar as condições que levam à imobilização de vesículas intactas sobre heteroestruturas. Neste trabalho foram analisadas as condições que levam à deposição de lipossomas abertos e fechados de 1.2-dipalmitoyl-sn-Glycero-3-[Phospho-rac-(1-glycerol)] (sal de
sódio) (DPPG) em almofadas de polieletrólitos, preparados pelo método de camada-sobre-camada (LbL). As transições eletrónicas das moléculas de DPPG bem como os coeficientes de absorção foram obtidos por espectroscopia de ultravioleta de vácuo (VUV), enquanto a composição elementar das heteroestruturas foi caracterizada por espectroscopia de fotoeletrão de raios-X (XPS). A presença de moléculas de água nos filmes foi inferida por XPS e espectroscopia de infravermelho. A análise de dados obtidos por microbalança de cristal de quartzo (QCM) permitiu deduzir que, em alguns casos, a quantidade de DPPG adsorvida depende do número de bicamadas previamente absorvidas. Além disso, as curvas de cinética de adsorção, tanto da quantidade adsorvida como da rugosidade da superfície, permitiram determinar os parâmetros de cinética relacionados com os processos de adsorção em causa, ou seja, forças electrostáticas, difusão de lipossomas e reorganização dos lípidos sobre a superfície. Os expoentes de escala calculados a partir da análise estatística de imagens obtidas por microscopia de força atómica demonstraram que a adsorção das vesículas de DPPG é regida pelo modelo de difusão de Villain confirmando que a adsorção é regida por interações eletrostáticas. O tratamento da densidade espectral de potência permitiu uma descrição minuciosa da superfície das amostras, bem como das suas propriedades estruturais internas. Estes resultados provaram que a rugosidade da superfície influencia a adsorção dos lipossomas de DPPG em superfícies cobertas por uma camada de polieletrólito. Assim, uma baixa rugosidade provoca a ruptura dos lipossomas originando uma bicamada lipídica, enquanto uma elevada rugosidade induz à adsorção de lipossomas inteiros. Mais ainda, a quantidade máxima adsorvida normalizada obtida por QCM, uma medida de fracção de lipossomas abertos, mostra um decréscimo com o aumento da rugosidade, permitindo concluir que a rugosidade da superfície é uma variável crucial que regula a absorção de lipossomas abertos ou inteiros. Esta conclusão é de interesse fundamental no desenvolvimento de sensores com base em biomoléculas funcionais incorporadas em lipossomas. De facto, filmes LbL compostos por polieletrólitos e lipossomas com e sem melanina encapsulada foram aplicadas com sucesso para sensores de azeite.
CONTENTS
Acknowledgements ... IX Abstract... XI Resumo ... XIII CONTENTS ...XV FIGURES ...XIX TABLES ... XXV Acronyms ... XXIX Symbology ... XXXI
1 INTRODUCTION ... 1
2 LIPID BARED HETEROSTRUCTURES ... 5
2.1 Cell membrane ... 5
2.2 Cell membrane models ... 6
2.2.1 Phospholipids ... 6
2.2.2 Liposomes ... 8
2.3 Supramolecular structures production techniques ... 10
2.3.1 Langmuir-Blodgett technique ... 11
2.3.2 Layer adsorption techniques ... 12
2.4 Liposomes immobilization onto solid supports ... 14
2.4.1 Solid-supported phospholipid bilayers ... 15
2.4.2 Polymer-supported liposomes ... 16
2.5 Water ... 18
3 EXPERIMENTAL SECTION AND CHARACTERIZATION TECHNIQUES ... 21
3.1 Materials ... 21
3.1.1 Organic polyelectrolytes ... 21
3.1.2 Lipid ... 22
3.1.3 Melanin ... 23
3.1.4 Olive oils ... 23
3.1.5 Solid supports ... 24
3.2 Methods ... 25
3.2.1 DPPG Liposomes suspension ... 25
3.2.2 Thin films preparation ... 26
3.3 Characterization techniques ... 30
3.3.1 Quartz Crystal Microbalance ... 30
3.3.2 Atomic Force Microscopy ... 35
3.3.3 Dynamic Light Scattering ... 46
3.3.4 Ultra-Vacuum Ultraviolet Spectroscopy ... 48
3.3.6 Fourier Transform Infrared Spectroscopy ... 54
3.3.7 Scanning electron microscope ... 56
3.3.8 Ellipsometry ... 57
3.3.9 Voltammetric electronic tongue ... 58
4 IMMOBILIZATION OF LIPOSOMES ON SURFACES ... 63
4.1 DPPG suspension analysis ... 63
4.2 Characterization of DPPG cast films ... 65
4.3 Improving Quartz Crystal Microbalance measurements accuracy in liquids ... 71
4.3.1 Testing QCM setups sensor ... 71
4.3.2 QCM comparison setups summary ... 75
4.3.3 Analysis of PEI and DPPG Kinetics... 77
4.3.4 Analysis of topographic surfaces ... 79
4.4 Growth analysis of PEI/DPPG LbL films ... 83
4.4.1 (PAH/PSS)10 LbL Film Cushion ... 83
4.4.2 Growth of the (PEI/DPPG)10 LbL films ... 83
4.4.3 DPPG adsorption kinetics ... 86
4.5 Growth analysis of PAH/DPPG LbL films ... 89
4.5.1 VUV characterization of DPPG and PAH molecules ... 89
4.5.2 PAH/DPPG LbL Films ... 93
4.5.3 Surface Characterization of a DPPG layer ... 96
4.5.4 Effects from ultraviolet (UV) irradiation on a PAH/DPPG film ... 97
4.5.5 XPS characterization of (PAH/DPPG)5 and (PEI/DPPG)5 LbL films ... 98
4.6 Conclusions ... 100
5 STORAGE OF WATER MOLECULES ON LbL FILMS ... 103
5.1 Adsorption of intact DPPG liposome layer on rough polyelectrolyte multilayers (PEMs) ... 103
5.1.1 QCM measurements ... 103
5.1.2 AFM characterization ... 105
5.2 AFM in situ surface analysis of Au/DPPG and Au/PAH/DPPG films ... 107
5.2.1 Amplitude parameter analysis ... 108
5.2.2 Fractal Analysis ... 117
5.3 AFM in situ surface analysis of Au/PEI/(PSS/PAH)4 and Au/PEI/(PSS/PAH)4/DPPG films 124 5.3.1 Amplitude parameter analysis ... 124
5.3.2 Fractal analysis ... 127
5.4 Adsorption Kinetics of DPPG Liposome Layers: A Quantitative Analysis of Surface Roughness ... 131
5.4.1 QCM measurements ... 131
5.4.2 AFM topographic images ... 134
5.4.4 Roughness as a measure of surface hydrophobicity at its contribution for rupture or
maintenance of intact liposomes ... 138
5.5 Adsorption of DPPG liposome on different roughness cushions: analysis of adsorbed amount, surface composition and topography ... 139
5.5.1 DPPG Adsorption Kinetics ... 140
5.5.2 XPS Characterization ... 143
5.5.3 AFM analysis ... 144
5.5.4 Grain analysis ... 147
5.5.5 Initial roughness - the key for opening the charged liposomes ... 152
5.6 (PAH/DPPG)3, (PEI/DPPG)3 and (PEI/(DPPG+melanin))3 LbL films used as sensors ... 153
5.6.1 XPS characterization of PEI/(DPPG+melanin) LbL films ... 153
5.6.2 Geographical classification of olive oils by a portable hybrid electronic tongue ... 154
5.6.3 HE-tongue responses and radar plots ... 155
5.6.4 Principal Component Analysis ... 156
5.7 Conclusions ... 157
6 CONCLUSION ... 161
6.1 Conclusions ... 161
6.2 Future remarks ... 164
6.3 Developed work ... 164
6.3.1 Papers published in international journals ... 164
6.3.2 Papers published in proceedings ... 165
6.3.3 Submitted papers... 165
6.3.4 Papers to be submitted ... 165
6.3.5 Atas communications ... 165
6.3.6 Oral communications ... 166
6.3.7 Poster communications ... 166
FIGURES
Figure 2.11.(A) Diagram of a reverse micelle with water trapped. (B) Schematic showing the various regions of the reverse micelle structure [104]. ... 19 Figure 3.1.Polyelectrolytes molecular structures used in LbL self-assembly technique. ... 21 Figure 3.2. Chemical structure of 1.2-dipalmitoyl-sn-Glycero-3-[Phospho-rac-(1-glycerol)] (Sodium Salt) (DPPG). ... 22 Figure 3.3. Chemical structure of melanin. ... 23 Figure 3.4. Schematic representation of MLVs and SUVs preparation by the lipid film hydrating method. 1) Lipids dissolution into a suitable organic solvent. 2) Lipid film formation on the walls of the flask by evaporation of the organic solvent. 3) Film hydration by adding an aqueous solution. 4) Agitation and obtaining of MLVs. 5) SUVs or LUVs obtained by sonication or extrusion (adapted from [53]). ... 25 Figure 3.5.Typical quartz resonator (a) front gold and (b) back gold electrodes, (c) quartz crystal. ... 30 Figure 3.6. Scheme illustrating the experimental procedure for measuring the mass variation analysis of the solutions using a QCM200 (adapted from [137]). ... 31 Figure 3.7. (a) Stationary Horizontal Closed (SHC), (b) Stationary Horizontal Open (SHO), (c) Continuous Vertical Closed (CVC), (d) Stationary Vertical Closed (SVC) and (e) Stationary Vertical Open (SVO) experimental configurations. 1 – crystal holder; 2 – quartz crystal; 3 – crystal holder head; 4 – solution; 5 – Pasteur pippete; 6 – support; 7 – acrylic protection chamber; 8 – flow cell; 9 – inject
cell. ... 33 Figure 3.8. Schematic representation of the inject cell apparatus. ... 34 Figure 3.9. Schematic representation of the atomic force microscope (AFM) technique. The tip is fixed under a cantilever focused by a light beam which is reflected and is used to detect the cantilever movement across the four quadrant photodetector [174]. ... 36 Figure 3.10. Schematic representation of the Edwards-Wilkinson model. It is possible to observe the random diffusion of particles A and C to a local with a minimum height that can be either to the left or
to the right. The particle B can spread only to one side, since it has only a minimum location [201]. .. 44
Figure 3.11. Schematic representation of the Kardar-Parisi-Zhang (KPZ) model. The particles A and B
can spread to its local minimum, the particle D can adhere laterally to the column without having to
have a position immediately below, thereby forming an aggregate. Any particle may be subjected to desorption [201]. ... 44 Figure 3.12. Scheme of the deposition of particles by the Villain model. The particle A will connect to
one of its neighboring particles and the particle B will connect with the particle which is at the top of
Figure 3.15. Schematic representation of the energy levels. Adapted from [207] . ... 50
Figure 3.16. Scheme ASTRID synchrotron accelerator [209]. ... 51
Figure 3.17. The typical experimental arrangement of the XPS technique [211]... 53
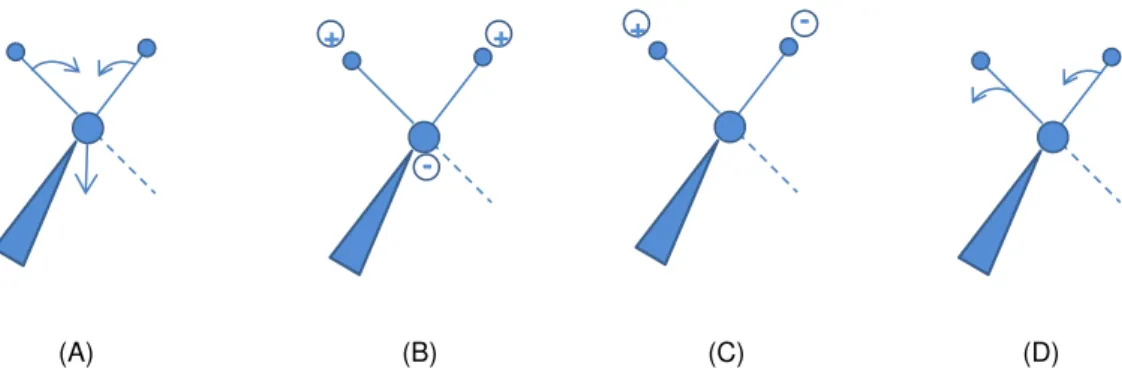
Figure 3.18. Stretching vibration modes: (A) antisymmetric and (B) symmetric. ... 54
Figure 3.19. Schematic representation of the four modes of bending vibrations: (A) scissoring, (B) twisting, (C) rocking and (D) wagging. ... 55
Figure 3.20. Schematic representation of a FTIR spectrometer [216]. ... 55
Figure 3.21. Schematic representation of the SEM technique [222]. ... 57
Figure 3.22. Schematic illustration of the principle of ellipsometry, from [223]. ... 58
Figure 3.23. Portable HE-tongue setup for the evaluation of olive oils [235]. ... 60
Figure 4.1. Size distribution by volume of the DPPG vesicles obtained by the extrusion method in a mini-extruder containing polycarbonate membranes with 0.1 m pores. The Gaussian fit curve (red color) presents a single peak centered at 169±3 nm showing a monomodal distribution... 64
Figure 4.2. Size distribution by volume of the DPPG vesicles obtained by the sonication method using an ultrasonic processor over 30 seconds and repeated 15 times with 1 minute delay between cycles. It should be referred that the high values of hydrodynamic diameter (around 1000 nm) probably correspond to titanium particles released from the ultrasonic probe during sonication. ... 65
Figure 4.3.Topographic AFM images a) and b) with 0.50.5 µm2 area of DPPG cast films deposited onto a silica substrate. c) The height profile obtained from topographic image b) shows a liposome, on left, with a diameter of ~100 nm and two levels, on right, with about 5 nm corresponding two to DPPG lipid bilayers deposited one above the other. ... 67
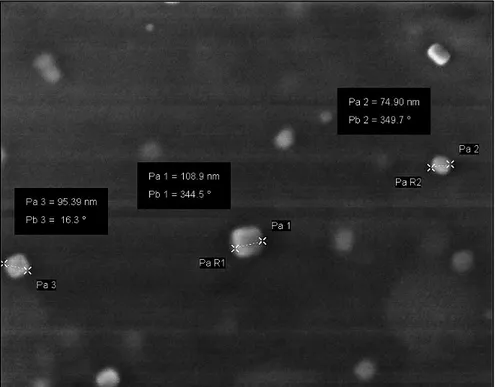
Figure 4.4. SEM image of a DPPG cast film showing vesicles with diameters between 75 and 109 nm. ... 68
Figure 4.5. EDS spectrum of DPPG cast film with a concentration of 5mM deposited onto a silicon substrate. ... 68
Figure 4.6. Infrared spectrum of DPPG cast film prepared onto a CaF2 substrate. ... 69
Figure 4.7. Frequency shift as a function of time corresponding to PEI/DPPG bilayer assembling measured in the (a) Stationary Horizontal Open (SHO), (b) Stationary Horizontal Closed (SHC), (c) Stationary Vertical Open (SVO), (d) Continuous Vertical Closed (CVC) and (e) Stationary Vertical Closed (SVC) experimental configurations. The inset in graph d) displays the stabilization frequency in liquid before the PEI/DPPG assembly in the CVC system. ... 74
Figure 4.9. Topographic images with 22m2 area of a) Au-coated quartz crystal, b) Au/PEI and c)
Au/PEI/DPPG surfaces. ... 80 Figure 4.10. Profiles obtained from 22m2 surface images of Au (squares), Au/PEI (circles) and Au/PEI/DPPG (up triangles). ... 81 Figure 4.11. Height distribution of Au (squares), Au/PEI (circles) and Au/PEI/DPPG (triangles) obtained from the AFM images. The respective Au/PEI/DPPG height distributions Gaussian fits are represented in green. ... 82 Figure 4.12. a) QCM frequency shift due to the successive adsorption of PEI/DPPG bilayers with water rinsing between deposition steps. b) Accumulated frequency shift of the assembly of ten PEI (open squares), DPPG (up triangles) and PEI/DPPG layers (circles). ... 84 Figure 4.13. Adsorbed amount of PEI and DPPG layers and PEI/DPPG bilayers plotted as a function of the number of bilayers. ... 86 Figure 4.14. Adsorbed amount of DPPG-liposome on a LbL film (PAH/PSS)10/PEI as a function of
immersion time. The first-order kinetics showed a characteristic time of 0.49 minutes and the second process showed a characteristic time of 4.7 minutes. The inset shows 𝜏(min) of the first (circles) and second (squares) order kinetics as afunction of bilayers number. ... 87 Figure 4.15. Schematic representation of the adsorption of (PEI/DPPG)6 LbL film onto a rough
polyelectrolytes cushion. The numbers correspond to the PEI successive layers adsorbed and the letters are concerned to the DPPG liposome layers adsorbed. ... 88 Figure 4.16. a) Absorption coefficient spectrum obtained from VUV absorption measurements for a DPPG cast film. Green curves depict the fitting of the absorption spectrum with Gaussian curves with bands at 138.2±0.4 nm, 145.8±0.4 nm, 169.8±0.3 nm and 192±2 nm. In the inset is shown the VUV spectra of DPPG cast film and of DPPG dispersion. b) Absorption coefficient spectrum obtained from VUV absorption measurements for DPPG and PAH cast films. The green lines correspond to the fitting of PAH spectrum with Gaussian functions with bands at 172.9±0.1 nm and 203.8±0.8 nm. ... 90 Figure 4.17. a) VUV Absorption spectra for LbL PAH/DPPG films with distinct numbers of bilayers. In the inset is shown the VUV spectrum of the (PAH/DPPG)10 film. The green lines in the inset indicate
the fitting with Gaussian functions, with bands at 136±2 nm, 147.2±0.2 nm, 168±3 nm and 194.4±0.7 nm. b) Maximum absorbance (142 nm) with baseline correction versus the number of bilayers in the PAH/DPPG LbL film. ... 94 Figure 4.18. a) AFM topographic image and b) A topographic profile of a 1-bilayer PAH/DPPG LbL film. ... 97 Figure 4.19.VUV spectra of a (PAH/DPPG)10 biomimetic membrane before and after being irradiated
Figure 5.1. Adsorbed DPPG-liposome amount on a LbL film PEI/(PAH/PSS)5 as a function of
immersion time (grey) and the fit (black) obtained using equation 4.1, where nJMA is equal to the unit.
... 104
Figure 5.2. AFM 3D topographic images of 2x2μm2 areas obtained from the a) template
PEI(PSS/PAH)5 and b) PEI(PSS/PAH)5/DPPG LbL films. ... 105
Figure 5.3. Height distribution of PEI/(PSS/PAH)5 (closed triangles) and PEI(PSS/PAH)5/DPPG
(closed circles) obtained from the AFM images. The respective Gaussian fits of the height distributions are represented with open symbols. ... 107 Figure 5.4. AFM in situ images with 2m of scan size of DPPG suspension deposited on Au surface
obtained in ultra-pure water at room temperature: a) and b) Au surface; c) and d) Au/DPPG at 3 minutes; e) and f) Au/DPPG at 5 minutes; g) and h) Au/DPPG at 10 minutes; and finally i) and j) Au/DPPG at 120 minutes, of heights and phases, respectively. ... 109 Figure 5.5. AFM in situ images with 2m of scan size of kinetics adsorption of DPPG liposome
deposited on a Au/PAH surface, at room temperature: a) and b) 0 seconds (Au/PAH surface); c) and d) 3 minutes; e) and f) 5 minutes; g) and h) 10 minutes; and i) and j) 60 minutes. The first and seconds images correspond to heights and phases, respectively. ... 111 Figure 5.6. a) DPPG adsorbed amount per unit of area onto a PAH layer measured by QCM (green circles) and Rq values obtained from 22m2 topographic images of DPPG liposomes adsorbed onto PAH at 3, 5, 10, 30 and 60 minutes (red squares). b) Height distribution curves obtained by treatment of 1D AFM topographic images in situ of Au and Au/DPPG films at 3, 5, 10 and 120 minutes and c)
Au/PAH and Au/PAH/DPPG at 3, 5, 10 and 60 minutes. ... 116 Figure 5.7. Power spectra density evolution of the of the a) Au/DPPG and b) Au/PAH/DPPG LbL films. ... 119 Figure 5.8. AFM in situ topographic images with 22 m2 of a) and b) Au/PEI/(PSS/PAH)4 and c) and
d) Au/PEI/(PSS/PAH)4/DPPG LbL films, heights and phases, respectively. ... 125
Figure 5.9. a) Au/PEI/(PSS/PAH)4 and Au/PEI/(PSS/PAH)4/DPPG height profiles with 2 m of scan
length obtained from the topographic images showed in figures 5.9 a) and c). b) Height distribution curves and respective gaussian fitted curves obtained by treatment of 1D AFM topographic images in situ of Au/PEI/(PSS/PAH)4 and Au/PEI/(PSS/PAH)4/DPPG. ... 126
Figure 5.10. Power spectra density of the Au/PEI/(PSS/PAH)4 and Au/PEI/(PSS/PAH)4/DPPG
surfaces. ... 127 Figure 5.11. Schematic representation of the proposed model for Au/PEI/(PSS/PAH)4
/DPPG-liposomes heterostructure, where Au substrate, PEI/(PSS/PAH)4 cushion and DPPG liposomes are
displayed in yellow, blue and red colors, respectively. The arrows symbolize the size obtained for each surface feature represented by numbers: 1) lateral size of the superstructures or aggregates of DPPG liposomes achieved by the PSDsh model; 2) size of the DPPG liposomes acquired by the PSDABC
Figure 5.12. Adsorbed amount kinetics of DPPG-liposomes onto PAH and PEI/(PAH/PSS)4 cushions.
The inset displays the DPPG adsorbed amount kinetics plotted as a function of t1/2. ... 132
Figure 5.13. Topographic images with 22m2 area of a) Au/PAH, b) Au/PAH/DPPG c) Au/PEI/(PSS/PAH)4 and d) PEI/(PSS/PAH)4/DPPG surfaces. The adsorption time of DPPG in b) and d) was 5 minutes. ... 135 Figure 5.14. DPPG adsorbed amount per unit of area and roughness values obtained from 0.50.5m2
(triangles) and 22m2 (circles) topographic images of DPPG liposomes adsorbed during different periods of time onto: a) PAH and b) PEI/(PSS/PAH)4 cushions. ... 137
Figure 5.15. Mean grain size values of topographic images PEI/(PSS/PAH)4/DPPG with 22m2 area
versus DPPG time adsorption on PEI/(PSS/PAH)4. ... 138
Figure 5.16. a) Kinetics of the adsorbed amount Γ of DPPG-liposomes onto PEI/(PAH/PSS)b cushions.
b) Maximum adsorbed amount Γ𝑚𝑎𝑥 and characteristic time 𝜏 as a function of the number of bilayers in the cushion, b. c) The evolution of parameter n with the number of bilayers in the cushion. ... 142 Figure 5.17. Topographic images with 22m2 area of a) PEI/(PSS/PAH)
1; b) PEI/(PSS/PAH)1/DPPG;
c) PEI/(PSS/PAH)2; d)PEI/(PSS/PAH)2/DPPG; e) PEI/(PSS/PAH)3; f) PEI/(PSS/PAH)3/DPPG; g)
PEI/(PSS/PAH)4 and h) PEI/(PSS/PAH)4/DPPG surfaces. The adsorption time of DPPG was of 15
hours. ... 146 Figure 5.18. Height distribution of AFM topographies before and after adsorption of DPPG onto PEI/(PSS/PAH)b cushion; with b=1 and b=4. ... 147
Figure 5.19. Plot of the PSD functions versus spatial frequency, corresponding to: a) cushions with different number of bilayers, b, and b) same cushions as in a), but after adsorption of DPPG. ... 148 Figure 5.20. Schematic representation of the proposed model for Au/PEI/(PSS/PAH)4
/DPPG-liposomes heterostructure, where Au substrate, PEI/(PSS/PAH)4 cushion and DPPG liposomes are
displayed in yellow, blue and red colors, respectively. The arrows symbolize the size obtained for each surface feature represented by numbers: 1) lateral size of the superstructures or aggregates of DPPG liposomes achieved by the PSDsh model; 2) size of the DPPG liposomes acquired by the PSDABC
model; 3) size of the PEM grains obtained by the PSDABC and PSDsh models. ... 150
Figure 5.21. Normalized adsorbed amount as a function of the cushion roughness where the liposomes are adsorbed. ... 152 Figure 5.22. Voltammetric responses of PEI/DPPG electrode immersed in (a) Portuguese olive oil samples, and in (b) Moroccan olive oil samples. ... 155 Figure 5.23: Radar plots of the response of the HE-tongue for the Moroccan and Portuguese olive oil
TABLES
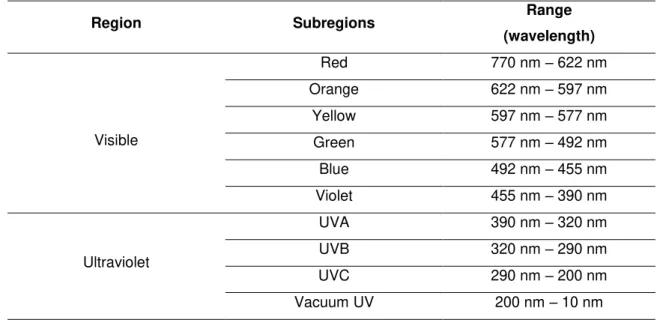
Table 3.1. One-dimensional roughness amplitude parameters used to characterize the AFM topography surfaces. ... 38 Table 3.2. Critical exponents values of different surface growth models. ... 43 Table 3.3. Visible and Ultraviolet subregions and the respective radiation wavelength ranges. ... 48 Table 3.4. Electronic transitions for each region of the electromagnetic spectrum. Adapted from [205]. ... 49 Table 4.1. Volume and Intensity distributions characteristic of DPPG liposomes obtained from DLS measurements: HD (hydrodynamic diameter) associated with peak position, peak intensity and peak width. ... 65 Table 4.2. Atomic Concentrations (%), Binding Energies (BE), eV, and respective assignments of the DPPG cast films deposited on silicon substrates. ... 70 Table 4.3. PEI/DPPG final frequency shifts measured with Stationary Horizontal Open (SHO), Stationary Horizontal Closed (SHC), Stationary Vertical Open (SVO), Continuous Vertical Closed (CVC) and Stationary Vertical Closed (SVC) experimental configurations. ... 75 Table 4.4. Comparison between the different tested QCM systems, namely Stationary Horizontal Open (SHO), Stationary Horizontal Closed (SHC), Stationary Vertical Open (SVO), Continuous Vertical Closed (CVC) and Stationary Vertical Closed (SVC) experimental configurations. ... 76 Table 4.5. AFM 1D statistical parameters of Au-coated quartz crystal, Au/PEI and Au/PEI/DPPG surfaces. Topographic data were obtained from a measured area of 22 µm2. ... 81
Table 4.6. Peak position and FWHM parameters for the peaks obtained from fitting the VUV spectra and corresponding assignments of DPPG and PAH cast films and PAH/DPPG LbL films. The absorption coefficients (𝜀) and partial absorption coefficients (𝜀p) were calculated for each peak
position. ... 92 Table 4.7. Properties of PAH/DPPG LbL films, where is the adsorbed amount per layer. ... 95 Table 4.8. Element composition in percentage and the respective Binding energies (eV), obtained
from XPS spectra taken at 0◦ and 60 of ejection relative to the normal surface of (PAH/DPPG)5 and
(PEI/DPPG)5 LbL films. Relative error not exceed ±10%. ... 99
Table 5.1. AFM statistical parameters obtained from topographic images of PEI/(PSS/PAH)5 and
PEI(PSS/PAH)5/DPPG surfaces with 2x2μm2 scan area. ... 107
Table 5.2. AFM 1D Statistical parameters calculated from topographic images with 22m2 areas of
Table 5.4. Slopes (𝛾) and the respective scaling exponents (𝛼) acquired from the subregions a and b
and the correlation lengths (𝜉) attained for the transition of the ab and bI zones of the PSD curves of
figure 5.7 a). ... 121 Table 5.5. Slopes (𝛾) and the respective scaling exponents (𝛼) acquired from the subregions a and b
and the correlation lengths (𝜉) attained for the transition of the ab and bI zones of the PSD curves of
figure 5.7 b). ... 121 Table 5.6. Spectral index (𝜈) obtained by fitting the PSD curves of figures 5.7 a) and b) with equation 3.8, and the respective fractal dimension calculated using the equation 3.9. ... 122 Table 5.7. PSDABC model parameters given by equations 3.10 and 3.11 applied to the region II of the
PSD curves of Figures 5.7 a). The correlation coefficient (CC) was obtained from the fit of experimental data to equation 3.10. ... 123 Table 5.8. PSDABC model parameters given by equations 3.10 and 3.11 applied to the region II of the
PSD curves of Figures 5.7 b). The correlation coefficient (CC) was obtained from the fit of experimental data to equation 3.10. ... 123 Table 5.9. AFM 1D Statistical parameters calculated from topographic images with 22m2 areas of Au/PEI/(PSS/PAH)4 and Au/PEI/(PSS/PAH)4/DPPG. ... 125
Table 5.10. Slopes (𝛾) and the respective scaling exponents (𝛼) acquired from the subregions a and b and the correlation lengths (𝜉) attained for the transition of the ab and bI zones of the PSD curves of
figure 5.10. ... 128 Table 5.11. Spectral index (𝜈), spectral strength (K) and correlation coefficient (CC) parameters obtained by fitting the PSD curves of figure 5.10 with equation 3.8 and the respective fractal dimensions calculated by equation 3.9. ... 129 Table 5.12. PSDABC model parameters given by equations 3.10 and 3.11 applied to the region II of the
PSD curves of figure 5.10. The correlation coefficient (CC) was obtained from the fit of experimental data to equation 3.10. ... 130 Table 5.13. Superstructure contribution components (PSDsh). Parameter 𝜏𝑠ℎ describes the mean size
of aggregates (superstructures). CC is the correlation coefficient. ... 130 Table 5.14. Kinetics parameters for DPPG liposomes adsorption onto PAH and PEM (PEI/(PSS/PAH)4) cushions. The correlation coefficient (CC) parameter was obtained from the fit of
experimental data to equation 4.1. ... 133 Table 5.15. Surface parameters obtained from statistical treatment of the AFM images. Topographic data was obtained from a measured area of 22 µm2 and the roughness was also calculated in scan areas of 0.50.5 µm2. ... 136
Table 5.18 Root-mean-square roughness (Rq) values obtained from surface topographies of PEI/(PSS/PAH)1b4 and PEI/(PSS/PAH)1b4/DPPG imaged by AFM. Topographic data was obtained
from a measured area of 22 µm2. ... 146 Table 5.19. Data calculated from PSDfractal, PSDABC and PSDsh models. ... 151
Table 5.20. Elemental composition in percentage and the respective Binding energies (eV), obtained from XPS spectra taken at 0 and 60 of electron ejection relative to the normal surface of the (PEI/DPPG+melanin)8 LbL films. Also atomic percentage and BE of PEI and DPPG+melanin casted
Acronyms
ACS Acoustic Vibration AFM Atomic Force Microscope
ASTRID Institute For Storage Ring Facilities BE Binding Energy
CEC Capillary electrochromatography
CEFITEC Centro de Física e Inovação Tecnológica CV Cyclic voltammetry
CVC Continuous Vertical Closed
Df Fractal Dimension
DLS Dynamic Light Scattering
DMPC 1.2-dimyristoyl-sn-glycero-3-phosphocholine DNA Deoxyribonucleic acid
DPPG 1.2-dipalmitoyl-sn-Glycero-3-[Phospho-rac-(1-glycerol)] (Sodium Salt) EDS Energy Dispersive X-ray Spectroscopy
EL Electronic language
ESCA Electron Spectroscopy for Chemical Analysis EW Edwards-Wilkinson
FAT Fixed Analyzer Transmission FCT Faculdade de Ciências e Tecnologia FTIR Fourier Transform Infrared
FWHM Full Width at Half Maximum
GC-MS Gas chromatography coupled with mass spectroscopy HA Hyaluronic acid
HD Hydrodynamic Diameter HE-tongue Hybrid Electronic Tongue
HVE-tongue Hybrid Voltammetric Electronic Tongue HPLC High performance liquid chromatography IR Infrared
IUPAC International Union of Pure and Applied Chemistry JMA Johnson-Mehl-Avrami
KPZ Kardar-Parisi-Zhang LB Langmuir-Blodgett LbL Layer-by-layer LCD Liquid crystal display LUV Large Unilamellar vesicles MLV Multilamellar Vesicles
PC Principal components PCA Principal component analysis PEI Poly(ethyleneimine)
PEM Polyelectrolyte multilayer PG Phosphatidylglycerol
PSL Polymer-supported liposomes
PLB Polymer-supported phospholipid bilayer PLL Poly-L-lysine
POPC 1-Palmitoyl-2-oleoyl-sn-glycero-3--phosphocholine
PSD Power Spectral Density PSDABC ABC or K-correlation model
PSDfractal Fractal model
PSDsh Superstructures model
PSL Polymer-supported liposome PSS Poly(sodium 4-styrenesulfonate) QCM Quartz Crystal Microbalance RDS Respiratory Distress Syndrome RNA Ribonucleic acid
SAM Self-assembled monolayer SEM Scanning Electron Microscope SFM Scanning Force Microscopy SHC Stationary Horizontal Closed SHO Stationary Horizontal Open SLB Supported lipid bilayer
SPB Solid-supported phospholipid bilayer SPM Scanning Probe Microscopy
SPR Surface Plasmon Resonance SR Synchrotron radiation
SRS Stanford Research Systems STM Scanning Tunneling Microscopy SUV Small Unilamellar Vesicles SVC Stationary Vertical Closed SVM Support vector machines SVO Stationary Vertical Open TVS Thermal Vibrations
UNL Universidade Nova de Lisboa UV Ultraviolet
UV-Vis Ultraviolet-visible VUV Vacuum Ultraviolet
Symbology
A Absorbance 𝐴𝑏𝑠 Absorbance
𝐴𝑏𝑠168𝑛𝑚 Absorbance at 168 nm of wavelength
𝐴𝑏𝑠𝑝138𝑛𝑚 Partial Absorbance at 138 nm of wavelength A1 Peak 1 area, fitted with Gaussian curve
𝛼 Roughness exponent b Optical path
𝛽 Growth exponent c Concentration
c Vacuum speed light
CC Correlation coefficient
𝜉 Correlation length
𝐷𝑇 Coefficient difusion
Δ Phase difference
Δ𝐸 Adsorbed energy
Δ𝑓 Frequency shift
Δ𝐼 Current change
Δ𝑚 Adsorbed amount
𝜌𝑞 Quartz density
𝜌𝑓 Film density
𝜀 Absorption/extinction coefficient
𝜀𝑝 Partial absorption coefficient
𝜀𝑝138𝑛𝑚 Partial absorption coefficient at 138 nm of wavelength
𝜀𝐷𝑃𝑃𝐺168𝑛𝑚 DPPG Absorption coefficient at 168 nm of wavelength
𝜀𝑃𝐴𝐻168𝑛𝑚 PAH Absorption coefficient at 168 nm of wavelength F Average number of particles that deposit on the surface Fol Fraction of open liposomes
𝑓 Frequency
𝑓𝑞 Quartz fundamental resonant frequency
𝑓𝑡 Transition frequency
𝛾 Fit linear slope h Surface grains height
ℎ Planck constant Imax Maximum current
Imin Minimum current
𝐼0 Intensity of the incident light
𝐼𝑠 Intensity of the scattered light
𝜂𝑖 Noise L Length scale
𝜆 Wavelength K Spectral strength
𝑘𝐵 Boltzmann constant
𝜉 Correlation Length M Matrix columns
𝑀𝑓 Film mass Mw Molecular weight
N Matrix lines
𝑛 Bilayers number
𝑛𝐽𝑀𝐴 Exponent of the JMA equation
𝑛 − 𝜋∗ Electronic transition from an orbital 𝑛 to an orbital 𝜋∗
𝑛𝑂− 𝜋𝐶𝑂∗
Electronic transition from the lone-pair of the carbonyl group to the antibonding
𝜋𝐶𝑂- valence orbital
𝑛𝑂′ − 𝜋∗
Electronic transition from the second lone-pair of the carbonyl group to the orbital 𝜋∗
𝑛𝑂− 𝜎∗
Electronic transition from the carboxyl group of the atomic orbital n to the
orbital 𝜎∗
N Constant frequency of the specific crystal cut 𝜈 Spectral index
P1 Gaussian position of the peak 1
pk Dissociation constant Ψ Amplitude angle
𝜋 − 𝜋∗ Electronic transition from an orbital 𝜋 to an orbital 𝜋∗
Ra Average roughness
𝑅𝐻 Hydrodynamic radius
Rku Kurtosis
Rms Root-mean-square roughness Rp Parallel reflection coefficient
Rpm Average maximum profile peak height Rq Root-mean-square roughness
Rs Perpendicular reflection coefficient
Rsk Skewness
Rt Maximum height of the profile
Rtm Average maximum height of the profile Rv Maximum profile valley depth
Sox Maximum slope of the current curve in the oxidation phase
Sred Maximum slope of the current curve in the reduction phase
t time
T Absolute temperature
𝜏 Characteristic time
𝜏𝑠ℎ Lateral size of surface aggregates
Γ Adsorbed amount per unit area
Γ𝐷𝑃𝑃𝐺 DPPG adsorbed amount per unit area
Γ𝑚𝑎𝑥 Maximum adsorbed amount per unit area
Γ𝑃𝐴𝐻 PAH adsorbed amount per unit area V Particle volume
W1 Gaussian width of peak 1
1 INTRODUCTION
The growing interest in developing molecular devices for electronics, photonics and sensors based on biological molecules is due essentially to their ability to interact with dedicated and located chemical species. The creation of devices can be achieved condensing biomolecules in heterostructured thin films assembled onto solid supports making sure that these molecules have an adequate environment in order to maintain its specificity. Among others, the main factors that influence biomolecules functionality are ionic strength, pH, ionization degree, hydrogen bonds and especially water content. However, at room conditions, thin films lose water molecules that are bound to the biological molecules, the so-called structural water, compromising the biomolecular structure and stability, and consequently its own functionality. Therefore, it is mandatory an aqueous environment inside these heterostructures in order to provide well-designed biomimetic supramolecular devices. Such environment may be achieved with lipid molecules, which are the building blocks of all living cells, representing 50% of mass of the cell membranes. Lipids can be used to prepare simplified membrane models intra-layered with biomolecules or to obtain “water bags”, liposomes, due to their poor solubility in water which causes a spontaneous rearrangement into vesicles creating a stable barrier between two aqueous compartments. Both, lipid membrane models or liposomes immobilized on surfaces, allow the creation of a biological compatible environment.
Besides other physicochemical surface properties which are determinants for the adsorption of biomolecules and the conformational state of the adsorbent, such as chemical nature, charge, hydrophilicity, or structure; the role of the surface roughness in the adsorption phenomena is poorly characterized. Roughness imposes local geometrical constraints on the adsorbents that can be crucial for self-assembly processes, particularly when the sizes of self-assembled domains exceed the characteristic dimensions of the surface features. Thus, roughness is expected to influence the formation and organization of the self-assembled biomolecules.
As a first approach, the adsorption phenomena should be characterized in order to find the adequate parameters that lead to liposomes immobilization on surfaces. One of the main parameters to be exploited, e.g. by Quartz Crystal Microbalance (QCM) or by spectrophotometries, is the mass per unit area of the adsorbed layers on solid supports as a function of different adsorption parameters.The measurements with QCMs at the solid-liquid interface was introduced in the eighties when a suitable oscillator circuit for operation in liquids was developed [7] and it is often used to discriminate between systems with a low amount of water, e.g., supported-lipid bilayers (SLBs), in opposition to those with higher volume of water storage such as liposomes. However, in situ QCM measurements require
improvements in order to overcome limitations associated to experimental setups configurations. In order to improve the QCM technique at solid/liquid interface a homemade cell was designed and implemented, providing a new successful experimental setup. Since lipids absorb in the ultraviolet region, the vacuum ultraviolet (VUV) spectroscopy technique, available in Synchrotron Radiation facilities and vastly used for macromolecules characterization which allows identifying their electronic transitions, was found to be an adequate method to analyse the amount of lipid bilayers or liposomes adsorbed onto solid supports.
The surface morphology characterization of the heterostructures can provide information about the liposomes immobilization mechanism on a surface. The surface analysis is usually associated to the concept of surface roughness which has a huge influence on many physical phenomena acting with higher effectiveness as the size of the objects decreases (to microscale). The present reduction of the devices, e.g., microelectromechanical systems, requires an improved grasp of the role of surface roughness, e.g., in contact mechanics and adhesion. Surface roughness is also of great importance for the function of many biological systems as cell adhesion in different microorganisms [8] and tumor growth [9]. Some animal species such as flies, bugs, crickets and lizards are able to attach and move on both very smooth and rough vertical solid walls, e.g. stone walls or leaves, due to the presence of very soft layers on their feet. On the other hand, plant surfaces developed non-wetting coatings, based on surface roughness on many different length scales, the so-called lotus effect, in order to reduce
surface roughness is important to understand the adsorption mechanisms as well as the inner structure of the films.
Bearing in mind the goal of this work, the presence of water molecules inside the heterostructures can be analyzed by infrared (IR) and X-ray photoelectron (XPS) spectroscopies. IR spectroscopy is a method used to determine the fundamental vibrations and the associated rotational-vibrational structures of the molecules and XPS probes the surface region allowing the chemical qualitative and quantitative characterization of the heterostructures.
Therefore to achieve the proposed main goal, this work is focused on LbL films composed by polyelectrolytes such as poly(ethylenimine) (PEI), poly(allylamine hydrochloride) (PAH) and poly(sodium 4-styrenesulfonate) (PSS) and by the synthetic lipid 1.2-dipalmitoyl-sn-Glycero-3-[Phospho-rac-(1-glycerol)] (Sodium Salt) (DPPG). This lipid is widely studied since the natural phosphatidylglycerol (PG) is present in biological membranes of many organisms showing a crucial role in vital functions, e.g., induction of DNA replication in E. coli [10] and increase of the gases
diffusion efficiency in pulmonary alveolus [11]. Melanin was used to be incorporated in DPPG liposomes and was selected to this work since is an important bio-macromolecule present in different organs of animals and plants [12-14], but also because it has different physicochemical properties including piezoelectricity and photoconduction being its main functions: photoprotection, photosensitization and thermoregulation [15]. Different types of supramolecular heterostructures were produced using the Layer-by-Layer technique such as: i) LbL films composed by polyelectrolytes interspersed with whole liposomes or lipid bilayers; ii) LbL films composed by a cushion of polyelectrolyte multilayers with intact liposomes and/or lipid bilayers adsorbed on top; iii) in certain cases, LbL films composed by polyelectrolytes interspersed with liposomes having melanin encapsulated or with lipid bilayers intra-layered with melanin. The adsorbed layers growth processes were monitored by the QCM technique in situ and by VUV spectroscopy. Kinetic characteristic
parameters as a function of adsorption time and layers number were extracted by fitting the data with the Johnson-Mehl-Avrami equation [16]. The surface morphology of the LbL films was characterized by AFM imaging ex situ and in situ before and after polyelectrolytes multilayers assembly and lipid
vesicles immobilization. Roughness amplitude parameters and dynamic scaling exponents were obtained from AFM data treatment. QCM and AFM imaging were combined to gather information of the layers growth mechanisms. Spectroscopic techniques, such as FTIR, VUV and XPS were used to find the composition, ionization and vibrational energy states of the organic molecules, but also to validate QCM and AFM interpretations.
This thesis is divided into 5 chapters. Chapter 2 describes cell membrane models and the techniques used to produce supramolecular heterostructures based on biological molecules onto solid supports. Chapter 3 presents the experimental section, such as the materials and the methods used to prepare the thin films, as well as the techniques used to characterize the heterostructures. The results and the discussion of the work are present in chapters 4 and 5. The characterization of DPPG liposomes suspension and DPPG cast films; the advances in instrumentation and experimental details developed for measurements in situ with a Quartz Crystal Microbalance; as well as the growth analysis of
2 LIPID BARED HETEROSTRUCTURES
An overview of the cell membranes models and the techniques used to produce supramolecular structures with biological molecules immobilized onto solid supports is presented in this chapter. Furthermore, a review of the experimental conditions that lead to adsorption of intact liposomes on solid supports or formation of lipid bilayers is also reported.
2.1 Cell membrane
In a sense, life is defined by membranes, because they delimit the barrier between the living cells and its surroundings. The cell membrane structure model currently accepted, fluid mosaic model, was
proposed by Singer and Nicholson [17] in 1972. According to this model, see figure 2.1, the biological membrane is a dynamic and fluid structure whose basic constitution is a phospholipid bilayer (lipid bilayer) with incorporated proteins. The hydrophilic polar heads of the phospholipids bilayer are outer disposed occupying the two surfaces (intra and extracellular) and the hydrophobic tails are thus oriented to each other. The lipids of the bilayer are movable, often changing their position within a layer [18].
Figure 2.1. Schematic representation of a cell membrane [19].
Lipid membranes structures are extremely difficult to study because of the polymorphic nature of the lipid arrangement, which presents a considerable variety of lipids, with different physical properties such as cross section, fluidity, electrical charge, molecular weight, among others. Furthermore, the covalent bonds of proteins and carbohydrates increases the complexity of the membrane structure [21]. The in vivo lipids role extends beyond structural division, involving also those molecules in cell
signaling pathways [21] and in maintenance of the differences in electrolyte concentration and electrical field gradient between the extracellular environment and the cytoplasm. Biomembranes are essential to life mechanisms of regulation throughout many interfaces of the cell. Moreover, cell membranes composition can change quickly to respond to environmental stimuli [22]. Due to the complexity and heterogeneity of cell membranes, mechanisms and functions of lipid-biomolecule interactions have been often investigated using simplified models called biomimetic systems.
2.2 Cell membrane models
2.2.1 Phospholipids
Figure 2.2. The lipid bilayer (A), structure (B and C) and composition (D) of a phosphatidylcholine molecule is shown as example of a glycerophospholipid. As shown in (C), the hydrophilic head is composed of a choline structure (blue) and a phosphate (orange); this polar head is connected to a glycerol (green) with two hydrophobic tails (purple) called fatty acids. View (D) shows the specific atoms within the various subregions of the phosphatidylcholine molecule. Note that a double bond between two of the carbon atoms in one of the hydrocarbon (fatty acid) tails causes a slight kink on this molecule, so it appears bent [23].
When phospholipids are mixed with water, a self-organization of the molecules occurs, where the hydrophobic portion is directed toward the center and may form various types of systems, as disposed on figure 2.3, including:
i) Micelles: aggregates with hydrophobic chains oriented inwards and the remaining hydrophilic groups at the surface in contact with water molecules, creating an environment without water. Essentially spherical, micelles can be also disc-shaped, cylindrical, ellipsoidal, among others;
Figure 2.3. Schematic illustration of liposome, micelle and lipid bilayer sheet [24].
These features can be used to mimic biological membranes that are present in the organelles of living cells, e.g. mitochondria, golgi apparatus, nucleus cell, lysosomes, endoplasmic reticulum, amongst others.
2.2.2 Liposomes
Liposomes can be formed by sonication or mechanical dispersion of phospholipids in an aqueous solution and may be composed of one or more concentric lipid bilayers separated by an aqueous medium. These systems are often used to encapsulate active drugs or to incorporate proteins [25-27] and have proved to be useful as controlled models increasing the knowledge of the permeability properties of biological membranes [28]. Phospholipid vesicles were first described in 1965 by Alec Bangham and coworkers [27]. Immediately after the Bangham work, liposomes showed up as simplified systems for biological membranes research. Since Gregory Gregoriadis studies, in 1971, liposomes have been widely investigated [26, 29-31] in what concerns their physical properties [32-34], preparation [35, 36], formation and fusion mechanisms [37, 38], membrane transport [39] and characterization methods. Apart from its utility in physical chemistry, these biomimetic models have been extended to the medicine field [40, 41], such as for encapsulate bioactive agents [42] or to interact with living cells [43], for vaccines [44] and for veterinary goods [45] production, for erythrocytes substitution [46, 47] and for cosmetic applications [48]. The liposomes may also be used as pharmaceutical transporters, e.g. in cancer therapy [25], by introducing exogenous molecules which are carried in their “water bags” or within the lipid bilayer, into living cells, i.e., liposomes containing soluble molecules that after fusion with the cell membrane release their contents into the cell cytoplasm [49]. In 2005, Michel et al. have successfully assembled intact vesicles interlayered with
Liposomes can be prepared from natural or synthetic phospholipids. The first can be extracted from biological material of living cells; e.g. phosphatidylcholine (lectin) phospholipid can be removed from egg yolk or soybeans. These natural phospholipids are used as the main lipid components for the production of liposomes because they are quite abundant in cell membranes. They may vary concerning the length, composition and saturation of the hydrocarbon chains. Synthetic lipids, despite having a well-defined lipid composition of their hydrocarbon chains, may have greater or lesser number of carbon atoms, equal or different and saturated or unsaturated fatty acid chains. Besides, they possess a greater homogeneity allowing a better understanding, characterization and manipulation of their behavior in opposition to natural phospholipids.
Currently, liposomes are not only applied to the biomedical field (e.g. diagnostic tests, blood transfusion in the absence of an appropriate donor, or detoxification through the use of chelating agents), but their applications have been extended to industry, cosmetics, agriculture (fertilizer stabilization), livestock (dairy maturation of milk), purification, recovery, catalysis and energy conversion processes [51].
Summarizing, liposomes can be defined as a colloidal association of amphipathic lipids that spontaneously organize themselves in closed concentric structures or vesicles. They can be extracted from natural lipid mixtures or extracted and purified from synthetic lipids that are commercially available. These vesicles can be classified by their size, lamellae number, lipid
Figure 2.4. Schematic representation of multilamellar vesicles (MLV), small unilamellar vesicles (SUV) and large unilamellar vesicles (LUV) preparation methodologies [53].
The key factors for vesicles’ characterization are size, lamellae number and lipid bilayers constitution.
Various parameters such as charge, stability, curvature of the bilayer or bilayers, phase membrane and formation of lipid domains depend on the phospholipid composition, the presence of sterols, the proportion of these components and the insertion of exogenous molecules into their bilayers [51]. The true conformation of the liposomes may be crucial for specific applications.
2.3 Supramolecular structures production techniques
2.3.1 Langmuir-Blodgett technique
Langmuir-Blodgett technique was designed in the 30s by Irving Langmuir and Katharine Blodgett. Langmuir was responsible for the equipment development of monomolecular films adsorbed at the air-water interface and also for their theoretical models. Katherine Blodgett contributed primarily for the
film’s transfer methods from the water surface to a solid substrate. The films adsorbed onto solid surfaces are named Langmuir-Blodgett (LB), while films spread on water are called Langmuir [55]. A schematic representation of these techniques is displayed in figure 2.5. Molecules used to manufacture Langmuir and LB films are amphiphilic, generally having a hydrophilic head and a hydrophobic apolar tail [56]. Due to its polar head the molecules have affinity for water, spreading out the surface without dissolving due to the presence of a nonpolar tail. These materials are immiscible with water and can only be dissolved in volatile solvents which evaporate rapidly, leaving the amphiphilic molecules dispersed over the water surface. Examples of amphiphilic materials are fatty acids, such as stearic acid, and esters and ethers with long hydrocarbons chains. The steps to produce Langmuir and LB films are the following: i) a small amount of solution containing amphiphilic molecules is spread on the water surface, allowing the formation of a monomolecular film; ii) thereafter, movable barriers are used to compress the monolayer, causing rearrangement of the molecules with their heads anchored on the aqueous surface and the tails facing the air; iii) at maximum packing, molecules reach a condensed state, and if the compression continues the film collapses [55]; iv) this monolayer can be transferred to a solid substrate by dipping through it. Each dipping cycle transfers two additional monolayers to the substrate.
Figure 2.5. Schematic diagram of Langmuir and Langmuir-Blodgett films procedures: a) a small amount of a suspension with amphiphilic molecules is spread on the water surface and a monomolecular film is formed; b) movable barriers compress the monolayer, leading to rearrangement of the molecules, with their heads anchored on the aqueous surface and the tails facing the air, until a maximum packing is reached and the condensed state is attained; c) the condensed monolayer can be transferred into a solid substrate by dipping through it; d) another monolayer can be added by pulling the solid surface from water. This process can be repeated in order to obtain various multimolecular layers [57].
a)
b)
c)
2.3.2 Layer adsorption techniques
2.3.2.1 Self-assembled monolayers
Self-assembly monolayer (SAM) technique is a process used to produce well-organized structures obtained from the spontaneously adsorption of molecules onto solid supports or substrates (polymers, metals, semiconductors, ceramics) upon chemical interactions (see figure 2.6). In 1978, Sagiv reported the first results of irreversible adsorption of organic solutions on solid surfaces through covalent bonding as a method to produce monolayers holding a controllable in-plane molecular organization [58, 59]. SAM is a model system used to investigate organic and biological interfaces comprising a technical interest for the fabrication of sensors, transducers and protective layers for lubrication and is a pattern able for lithography applications with nanometer precision. For example, SAM arrays of immobilized single-stranded deoxyribonucleic acid (DNA), the so-called DNA chips, have revolutionized the genetic analysis for disease detection, toxicology, forensics, industrial processing and environmental monitoring [60].
Figure 2.6. Scheme of the self-assembly monolayer technique. Due to chemical interactions the molecules are spontaneously adsorbed on a substrate resulting in a well-organized structure [60].
2.3.2.2 Layer-by-layer technique
An alternative method to produce functional biomolecular heterostructures was developed in 1992, by Decher et al. [61], named the layer-by-layer (LbL) technique [1] and is based on the electrostatic
interactions between oppositely charged molecules. The experimentally procedure to produce the LbL films is shown in figure 2.7, where a negatively charged solid substrate is immersed, for example, in a cationic solution, until a polycationic layer is adsorbed on the substrate surface. Then, the sample is immersed in an anionic solution, promoting the adsorption of the polyanionic layer onto the polycationic layer previously adsorbed, creating a bilayer. The desired number of bilayers is achieved by repeating the explained method [62]. After each layer deposition the sample is washed in order to remove any weakly adsorbed molecules. Finally, the LbL films can be dried with a nitrogen flow or at
Substrate (metals, semiconductors, ceramics, polymers, etc.)
Chemical reaction
Inter-molecular interaction
room temperature. This technique allows the assembly of alternately cationic and anionic species on solid substrates of any shape or size. Regarding to LbL films growth, it is known that the major driving forces are the ionic attraction between the electrically charged layers, although other interactions such as hydrogen bonding and hydrophobic interactions can also conduce the LbL films assemblage [16].
Figure 2.7. Scheme LbL technique procedure. The desired number of bilayers is achieved by repeating the method represented.
The LbL technique offers experimental simplicity, it is a low cost method and is suitable for aqueous solutions [1]. Furthermore, the absorption of each layer is dependent on the following parameters: polyelectrolyte solution molarity, pH of the polyelectrolyte and washing solutions, ionic strength, room temperature, adsorption time, substrate affinity, surface roughness, polyelectrolyte volume solution with respect to substrate area, and drying procedures. All these variables can contribute to adsorption or desorption phenomena of the layers when immersed in a solution or subjected to vacuum [1]. Studies done by Lourenço et al. [6, 63] allowed to verify that the amount of water molecules in LbL thin
films is influenced by the salt concentration in the solution, drying procedures, as well as the type of materials used in the heterostructures assembly.
2.4 Liposomes immobilization onto solid supports
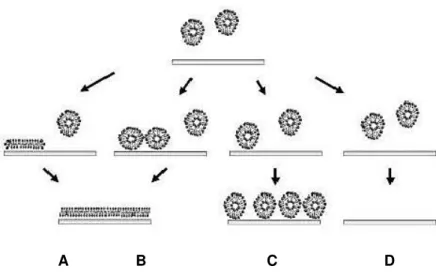
Liposomes formed from self-assembly of lipids are important cell membrane models since lipids are the basic building blocks of the living cells, representing approximately 50% of their membrane mass. The liposomes immobilization on LbL films is suitable to exploit important characteristics of these heterostructures when functional biological materials are combined, especially the ability to preserve bioactivity and to serve as template for surface functionalization, e.g. in tissue engineering. In fact, the effectiveness of LbL assemblies has been proved for several other biological materials such as proteins, enzymes, DNA and viruses [54]. Aiming to mimic cell membranes, liposomes have been immobilized on solid supports, called supported-lipid bilayers (SLB). However, during liposome adsorption three situations may occur, as explained in figure 2.8: they may adsorb as intact vesicles (C); or the vesicles can adhere, break and spread creating a planar lipid bilayer (A and B); or adsorption could not occur at all (D) [64].
A B C D
Figure 2.8. Schematic representation of the pathways of vesicle deposition and SLB formation: (A) Formation of an SLB generated at low vesicular coverage; (B) Formation of an SLB produced at high vesicular coverage; (C) Formation of a liposome layer; (D) Inhibited adsorption [64].


![Figure 3.6. Scheme illustrating the experimental procedure for measuring the mass variation analysis of the solutions using a QCM200 (adapted from [137])](https://thumb-eu.123doks.com/thumbv2/123dok_br/16539955.736678/65.892.239.657.488.806/figure-illustrating-experimental-procedure-measuring-variation-analysis-solutions.webp)
![Table 3.4. Electronic transitions for each region of the electromagnetic spectrum. Adapted from [205]](https://thumb-eu.123doks.com/thumbv2/123dok_br/16539955.736678/83.892.123.771.826.997/table-electronic-transitions-region-electromagnetic-spectrum-adapted.webp)
![Figure 3.23. Portable HE-tongue setup for the evaluation of olive oils [235].](https://thumb-eu.123doks.com/thumbv2/123dok_br/16539955.736678/94.892.116.777.128.295/figure-portable-tongue-setup-evaluation-olive-oils.webp)