Article
J. Braz. Chem. Soc., Vol. 25, No. 8, 1355-1364, 2014. Printed in Brazil - ©2014 Sociedade Brasileira de Química 0103 - 5053 $6.00+0.00
A
*e-mail: [email protected]
Multiresidue Determination of Pesticide Residues in Honey by Modified
QuEChERS Method and Gas Chromatography with Electron Capture Detection
Débora Orso, Manoel L. Martins, Filipe F. Donato, Tiele M. Rizzetti,
Magali Kemmerich, Martha B. Adaime and Renato Zanella*
Departamento de Química, Universidade Federal de Santa Maria (UFSM), 97105-900 Santa Maria-RS, Brazil
O mel pode apresentar resíduos de pesticidas devido à contaminação das abelhas durante a coleta de pólen e néctar ou por tratamento das colmeias. Assim, a determinação de resíduos de pesticidas em mel é de grande importância, apesar da dificuldade devido à complexidade da matriz. Neste estudo, um novo método para a determinação de pesticidas de diferentes grupos químicos em mel foi desenvolvido e validado. Amostras de mel foram extraídas pelo método QuEChERS modificado e analisados por cromatografia gasosa com detecção por captura de elétrons (GC-ECD). Os resultados de recuperação, avaliados em três níveis de fortificação, foram entre 71 e 119% para a maioria dos compostos, com valores de desvio padrão relativo (RSD) < 20%. O método proposto permite a determinação com limites de detecção entre 3 e 6 µg kg-1, combinando a extração e limpeza do extrato de forma efetiva, com boa sensibilidade e seletividade, e foi aplicado com sucesso na análise de amostras comerciais de mel.
Honey can present pesticide residues due to the contamination of bees during the collection of pollen and nectar or by treatment of hives. Thus, the determination of pesticide residues in honey is of great importance, despite the difficulty due to the complexity of the matrix. In this study a new method for the determination of pesticides from different chemical groups in honey was developed and validated. Honey samples were extracted by modified QuEChERS method and analyzed by gas chromatography with electron capture detection (GC-ECD). Recovery results, evaluated at three spike levels, were between 71 and 119% for most of the compounds, with relative standard deviation (RSD) < 20%. The proposed method enables the determination at limits of detection between 3 and 6 µg kg-1, combining effective extraction and clean-up steps with good sensitivity and selectivity, and was successfully applied to the analysis of commercial honey samples.
Keywords: gas chromatography, honey, pesticide residues, sample preparation
Introduction
The analysis of pesticide residues in honey is a considerable analytical challenge, since honey is a mixture of over 300 substances identified mainly as sugars and waxes, subject to variations arising from the type of plant where bees collect nectar from.1 The monitoring of
pesticide residues is important because honey is a route of human intake of pesticides, since it is a food and an alternative medicine, and serves as a way to evaluate the dispersion of pesticides in the environment and can be associated with the global phenomenon of disappearance of hives.2
According to the Council Directive 2001/110/EC,3
honey is considered a viscous, aromatic, natural and sweet fluid produced by Apis mellifera bees4,5 from nectar
of flowers or secretions of live parts of certain plants or excretions of insects. It has been used in medicine since remote times for treatment of burns, gastrointestinal disorders, asthma, infected wounds and skin ulcers.6World
production of honey showed a growing trend in the last 20 years attributed to an expansion in the number of hives and production per colony.7
Nevertheless, there are two forms of contamination of honey: during pollen and nectar collection by bees, characterizing cross-contamination, and through treatment of hives in which pesticides can migrate into honey8 as
25,000 honeybee workers make an average of 10 journeys to explore roughly 7 km2 in the area near their hive.10Thus,
the determination of the maximum residue limits (MRLs) has become necessary due to the risks offered by residues to human health, to ensure food safety. Established maximum residue limits of pesticides in honey (Royal jelly, pollen, comb honey) by the European Union (EU)11 are generally at
the limit of quantification of the analytical methods. In the same way, this monitoring provides information about the use of pesticides in crop fields and in their neighborhoods as well as trends due to bioaccumulation and toxicity caused by pesticides.12
Gas chromatography with electron capture detection (GC-ECD) responds selectively and with very good sensitivity to organic compounds containing especially halogens,13,14 and has been employed with success in the
study of compounds present at trace level, such as pesticide residues in food.15-17 However, the GC determination of
pesticide residues in honey can be severely affected by co-extractives, requiring effort in the method development.
For the extraction of pesticides from honey samples, several methods have been proposed employing solid-phase extraction (SPE)18,19 solid-phase microextraction
(SPME),20 pressurized liquid extraction (PLE),18 solvent
extraction (SE),10 matrix solid-phase dispersion (MSPD),13
liquid-liquid extraction and low temperature purification (LLE-LTP)21 and QuEChERS method.18,22 The latter is the
acronym for “Quick, Easy, Cheap, Effective, Rugged and Safe” and has been introduced in 200323 for the analysis of
fruits and vegetables. This analytical approach was further modified and extended to a greater number of pesticides in diverse food matrices,24 reducing some common problems
presented in the extraction steps, like extraction time, volume of generated waste and interferences from matrix, as well as ease of operation. The extraction of pesticides from honey samples can be performed by modified QuEChERS method, because this method is efficient for a wide range of compounds, including highly polar pesticides, with acid and basic features.25 The clean-up step, called dispersive solid
phase extraction (d-SPE), used in QuEChERS methods, allows for quick and simultaneous clean-up with water removal. A final extraction with less polar solvents facilitates the precipitation of polar co-extractives.26
Due to the complexity of the honey matrix, which can contain a great amount of sugars and other substances, such as phenolic compounds,26 these interferences, mainly waxes and
pigments,6 should be removed before the chromatographic
analysis in order to reduce the limit of quantification of the method.27 An inappropriate clean-up can lead to adverse
effects related with the quality of the generated results and to the contamination of the GC system.
This paper describes an effective multiresidue method using a modified QuEChERS method for the extraction of pesticide residues from honey samples, including a clean-up step to remove mainly waxes, sugars and pigments, with determination by GC-ECD. Pesticides from different chemical groups, like organophosphates (bromophos methyl, trichorfon, chlorpyrifos methyl, chlorpyrifos ethyl, malathion), organochlorines (hexachlorobenzene, lindane, heptachlor, endosulfan alpha + beta, dieldrin, endrin I + II), pyrethroids (lambda-cyhalothrin, bifenthrin), strobins (trifloxystrobin, kresoxim methyl), triazoles (tetradifon), chloronitrile (chlorothalonil), dinitroanilines (trifluralin) and pyrazole (fipronil), including also important metabolites (endosulfan sulfate from endosulfan, heptachlor epoxide from heptachlor and 4,4-DDE from DDT) were evaluated.
Experimental
Chemicals and preparation of standard solutions
The standards were purchased from Dr Ehrenstofer (Germany), with purity between 92.0 and 99.5%. Acetonitrile (MeCN) high-performance liquid chromatography (HPLC) grade was obtained from J. T. Baker (USA) and disodium
ethylenediaminetetraacetic (Na2EDTA) from Merck
(Brazil). Anhydrous magnesium sulfate p.a. was obtained from J. T. Baker (Japan), sodium chloride p.a. from Merck (Brazil) and the sorbent Bondesil primary secondary amine (PSA), cartridges for SPE Strata C18 500 mg per 3 mL
(Phenomenex, EUA), florisil 60-100 mesh (Mallinckrodt, EUA) with particles size of 40 µm, from Agilent (USA). Purified water was provided by a Direct UV3 system from Millipore (France).
Individual analytical stock solutions (1000 mg L-1)
of each pesticide were prepared in acetonitrile HPLC grade, considering the purity of each pesticide standard. These analytical solutions were diluted in acetonitrile to 100 mg L-1. Afterwards, a mixture with the concentration
of 10 mg L-1 containing all pesticides was prepared, that
was diluted to 1 mg L-1. All solutions were stored in amber
flasks at –18 °C. For the injection in the GC-ECD system, the analytical solution mixture at 1 mg L-1 was diluted
at the concentrations 5, 10, 20, 50, 75 and 100 µg L-1 in
acetonitrile and, also, in the matrix blank extract (matrix matched calibration) prepared by the QuEChERS procedure in order to evaluate the matrix effect.
Honey samples and physicochemical characterization
do Sul (Brazil). Blank samples were classified by the absence of compounds of interest, with prior injection into chromatographic system. Physicochemical characterization of honey samples showed the presence of 19.6% moisture, being within the allowable limit (< 20%), and 23 mEq kg-1
of acidity, that is within the allowable limit (< 50 mEq kg-1).
The reactions of Lund and Fiehe showed the presence of nitrogenous substances, amino acids, proteins and enzymes, indicating that this honey is classified as pure honey according to Brazilian legislation.28
To evaluate the applicability of the proposed method, four composed honey samples were obtained in the Santa Maria (Brazil) region from a local producer. Each sample consisted of portions collected from 12 different hives. The sampling was made in the years of 2011 and 2012, from spring to summer, the higher production period for honey in south of Brazil. The hives were located close to eucalyptus, peach, orange, grape and soybean cultivation areas. The samples were stored in 1 L glass containers, maintained at room temperature and analyzed before 30 days.
Instrumentation
For sample preparation the following instrumental apparatus was used: vortex Biomixer, model QL-901 (Brazil); analytical balance precision AND, model SV-200 (Japan); centrifuge Thermo Fisher Scientific, model IEC CENTRA CL2 (USA); centrifuge Centribio 12 × 15 mL
(Brazil); automatic micropipette Brand with variable capacity (Germany) and thermostated water bath De Leo (Brazil). Chromatographic analyses were performed using a GC-ECD system Varian CP 3800 (USA), equipped with CP 8410 autosampler; injector model 1079 with electronic pneumatic control (EPC); capillary column DB-5MS (30 m × 0.25 mm × 0.25 µm); electron capture detector
and data acquisition system through the Star Workstation 6.0 software.
Chromatographic conditions
In order to obtain the best chromatographic conditions, retention times and separation profile of the compounds in study were monitored. Thus, the conditions utilized for the GC-ECD system were: injector model 1079 operating with programmed temperature vaporization (PTV) under the following temperature conditions: 100 ºC for 0.1 min and then increased at 200 °C min-1 to 280 °C which was
held for 28 min. After that the injector heating was turned off and the temperature was decreased to 100 ºC for the next injection. This injector temperature program was used
to improve the analyte transference to the column and to avoid thermolysis of sugars from the extracts. An injection volume of 1 µL (splitless) was used. After 2.0 min a split ratio of 20:1 was used to clean the injector for the next injection. Column oven temperature program was: 50 °C (1.0 min), heating at 10 °C min-1 to 65 °C (0 min), heating
at 25 °C min-1 to 180 °C (0 min) and at 5 °C min-1 until
280 °C, remaining at this temperature until 35 min. The soft warm-up at 10 °C min-1 from 1 to 2.5 min of runtime
was the best condition to produce higher signal for the selected analytes in acetonitrile extracts. The carrier gas (helium 99.999%) was maintained at constant flow-rate of 1.0 mL min-1; make-up gas (nitrogen 99.999%) at
28 mL min-1 and detector temperature set at 300 °C.
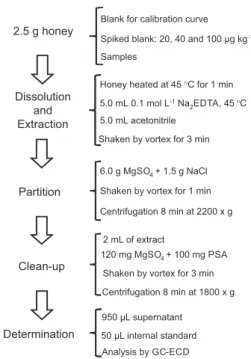
Extraction method
The procedure for sample preparation, according to Figure 1, consisted of weighing 2.5 g of honey in a 50 mL polypropylene tube with cap, then heating this sample, in water bath at 45 °C, during 1 min for better homogenization. After this, 5.0 mL of aqueous 0.1 mol L-1 Na
2EDTA, also
heated at 45 °C, and 5.0 mL of acetonitrile were added. The tube was shaken for 3 min on vortex and then 6.0 g
of anhydrous MgSO4 and 1.5 g of NaCl were added,
following 1 min of vortex shaking. After this, the tube was centrifuged at 2,200 × g for 8 min to obtain good separation of the phases and 2 mL of the supernatant (organic phase) was used for the clean-up step by d-SPE. This step was performed in a 15 mL polypropylene tube with cap,
containing 120 mg of anhydrous MgSO4 and 100 mg
of the sorbent PSA, which was vortexed for 3 min and centrifuged for 8 min at 1,800 × g to obtain a clean extract (upper phase). The extract was filtered through a syringe filter of polyvinylidene fluoride (PVDF) with 0.2 µm of porosity, then 0.95 mL was transferred to a 2 mL vial and 50 µL of the internal standard quintozene was added, for a final concentration of 50 µg L-1, before injection in the
GC-ECD system.
Method validation
The proposed method was validated evaluating analytical curves and linearity, matrix effect, limits of detection (LOD) and of quantification (LOQ), accuracy (in terms of recovery) and precision (in terms of repeatability and intermediate precision) in accordance to international regulations for the analysis of pesticides by chromatographic analysis.29 Calibration curves were obtained for the levels of
concentration 5, 10, 20, 50, 75 and 100 µg L-1 in acetonitrile
and in the matrix blank extract, corresponding to a range of 10 to 200 µg kg-1 in the sample (method factor of 2) with
six replicates each (n = 6). To evaluate the matrix effect in the chromatographic analysis the slopes of the curves in acetonitrile and in matrix blank extract were compared and the results expressed as percentage of matrix effect.30
The real method LOQ was based on the lowest spike level that meets the requirements of accuracy (recovery from 70 to 120%) and precision (relative standard deviation (RSD) ≤ 20%). The method LOD was calculated dividing this value by 3.3. The trueness of the method was evaluated by carrying out extraction and analysis of six replicates of blank samples spiked at 20, 40 and 100 µg kg-1, to estimate
the accuracy, expressed as recovery (%), and precision, in terms of repeatability (RSDr). Due to the complexity of
the studied matrix, the same experiment at three spiked levels was repeated in different days in order to estimate the intermediate precision (RSDip).
Results and Discussion
Chromatographic analysis
Pesticide residue determination in honey samples by GC presents challenging analytical problems because of their high sugar content, typically 77% (m/m) of fructose + glucose,31 that is transferred to the extracts. Deposition
of matrix components in the GC liner causes severe cross-contamination by carryover, signal intensity changes and progressive tailing of chromatographic peaks takes place, with a reduction of the capillary column lifetime.32 Also, the
presence of carbohydrates in the liner at high temperatures may induce Maillard reactions with consequent formation of artifacts. These reactions are typical of thermal treatment and produce a variety of brown pigments due to the condensation of amino acids with sugars.33
Honey also contains residual waxes with long linear carbon chains and high boiling points, and therefore, hard to elute from the column with common temperature programs. Another hundreds of substances from the matrix with lower boiling points should be chromatographically resolved from analytes because they tend to co-elute with them or increase the background of the chromatogram.
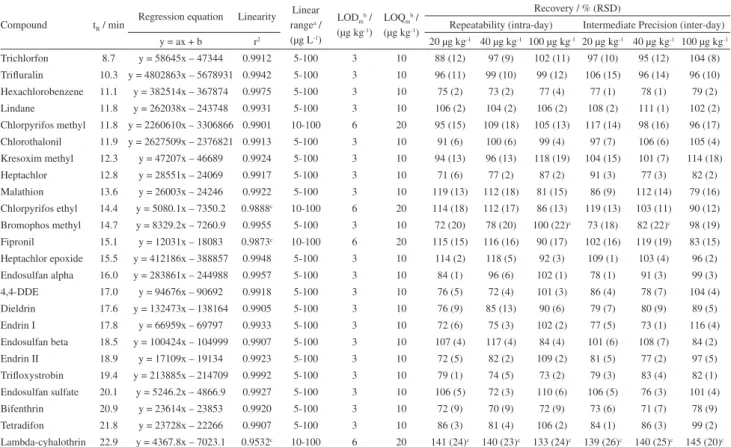
The GC-ECD system presented a suitable response for the studied compounds in this work. The identification of pesticides was made by the retention time (tR), presented
in Table 1.
Development of the extraction method
For the honey it was possible to efficiently extract the pesticides and minimize co-extractives by optimization of relevant variables in the solvent partition step and by adequate choice of type and amounts for sorbents in the clean-up step, in order to minimize matrix effects. The use of MeCN in modified QuEChERS offers several advantages, including the ability of water removal from the phase containing analytes, good compatibility with the d-SPE clean-up and with chromatographic techniques.23
Therefore, MeCN without acidification was selected for the method, showing good recovery results for selected pesticides.
The first step for sample preparation is the dissolution of honey to allow the extraction of analytes. Dissolution with water is the most usual way to obtain a homogeneous solution of honey, amenable for solvent extraction. An important aspect of this process is the buffering of added water to help analyte extraction, promoting a broken colloidal state (undissolved waxes) and metal complexation.34,35 The transition metals ions present in the
matrix are complexed by EDTA, which increase sample homogenization, improving compound extraction and decreasing matrix effect.34 There are studies indicating
a higher amount of pesticides extracted with appropriate recoveries in the presence of Na2EDTA solution.
35,36 In the
proposed method, honey samples were firstly dissolved in a 0.1 mol L-1 Na
2EDTA aqueous solution (pH 5.0), heated
at high temperatures. In the extraction medium, HMF releases formic acid by hydrolysis, changing the pH level and consequently the partition equilibrium of pesticides.37
The ionic strength is controlled by salt addition (NaCl) in the partition step. Due to the complex nature of the honey/ water mixture, the addition order of the salts (MgSO4,
NaCl, others) can interfere in the partition process. For the partition step, the salts MgSO4 (first) and NaCl (second)
were added separately in order to obtain a greater separation of aqueous and organic phases, reducing the variability between extractions.
The clean-up can be considered the critical step for the determination of pesticide residues in honey samples. Thus, some sorbents were tested using the SPE technique with different cartridges containing 500 mg of C18 and 100 mg
of diol without MgSO4 addition. The tests using 500 mg
of florisil and 100 mg of silica were made by d-SPE in the presence of 120 mg of MgSO4. Like for other food
matrices, a widely used sorbent for the removal of free fatty acids, sugars and other polar compounds present in extracts of food samples is the ethylenediamine-N-propyl, a primary and secondary amine (PSA) that acts as a weak anionic exchanger and can interact with other compounds
through hydrogen bonds or dipole-dipole interactions. As a polar sorbent, PSA can form hydrogen bonds with polar compounds from the matrix, but retention of more polar analytes can also occur and therefore the amount of this sorbent was tested in the method development.23,38 The
best results were obtained with MgSO4 and PSA, being
an effective clean-up step to obtain cleaner extracts with smaller amounts of co-extractives. Thus, an aliquot of 2 mL of extract was transferred for the clean-up step using
120 mg MgSO4 and 100 mg PSA, to remove undesired
components present in the matrix extract, such as pigments, lipids, sugars and wax, confirmed by the lower matrix effect and less unknown peaks in the chromatograms.
Method validation
The linearity of the instrument was evaluated from the response of the analytical curves, in area, obtained by injection of the analytical solutions prepared in matrix blank extracts containing all the pesticides in study. The linear range (Table 1) was from 5 or 10 to 100 µg L-1 with
coefficients of determination (r2) higher than 0.99 for
most of the studied compounds. The obtained values of
Table 1. Validation parameters obtained for pesticide multiresidue method in honey
Compound tR / min
Regression equation Linearity Linear rangea /
(µg L-1)
LODmb /
(µg kg-1)
LOQmb /
(µg kg-1)
Recovery / % (RSD)
Repeatability (intra-day) Intermediate Precision (inter-day) y = ax + b r2 20 µg kg-1 40 µg kg-1 100 µg kg-1 20 µg kg-1 40 µg kg-1 100 µg kg-1
Trichlorfon 8.7 y = 58645x – 47344 0.9912 5-100 3 10 88 (12) 97 (9) 102 (11) 97 (10) 95 (12) 104 (8)
Trifluralin 10.3 y = 4802863x – 5678931 0.9942 5-100 3 10 96 (11) 99 (10) 99 (12) 106 (15) 96 (14) 96 (10) Hexachlorobenzene 11.1 y = 382514x – 367874 0.9975 5-100 3 10 75 (2) 73 (2) 77 (4) 77 (1) 78 (1) 79 (2)
Lindane 11.8 y = 262038x – 243748 0.9931 5-100 3 10 106 (2) 104 (2) 106 (2) 108 (2) 111 (1) 102 (2)
Chlorpyrifos methyl 11.8 y = 2260610x – 3306866 0.9901 10-100 6 20 95 (15) 109 (18) 105 (13) 117 (14) 98 (16) 96 (17) Chlorothalonil 11.9 y = 2627509x – 2376821 0.9913 5-100 3 10 91 (6) 100 (6) 99 (4) 97 (7) 106 (6) 105 (4) Kresoxim methyl 12.3 y = 47207x – 46689 0.9924 5-100 3 10 94 (13) 96 (13) 118 (19) 104 (15) 101 (7) 114 (18)
Heptachlor 12.8 y = 28551x – 24069 0.9917 5-100 3 10 71 (6) 77 (2) 87 (2) 91 (3) 77 (3) 82 (2)
Malathion 13.6 y = 26003x – 24246 0.9922 5-100 3 10 119 (13) 112 (18) 81 (15) 86 (9) 112 (14) 79 (16)
Chlorpyrifos ethyl 14.4 y = 5080.1x – 7350.2 0.9888c 10-100 6 20 114 (18) 112 (17) 86 (13) 119 (13) 103 (11) 90 (12)
Bromophos methyl 14.7 y = 8329.2x – 7260.9 0.9955 5-100 3 10 72 (20) 78 (20) 100 (22)c 73 (18) 82 (22)c 98 (19)
Fipronil 15.1 y = 12031x – 18083 0.9873c 10-100 6 20 115 (15) 116 (16) 90 (17) 102 (16) 119 (19) 83 (15)
Heptachlor epoxide 15.5 y = 412186x – 388857 0.9948 5-100 3 10 114 (2) 118 (5) 92 (3) 109 (1) 103 (4) 96 (2) Endosulfan alpha 16.0 y = 283861x – 244988 0.9957 5-100 3 10 84 (1) 96 (6) 102 (1) 78 (1) 91 (3) 99 (3)
4,4-DDE 17.0 y = 94676x – 90692 0.9918 5-100 3 10 76 (5) 72 (4) 101 (3) 86 (4) 78 (7) 104 (4)
Dieldrin 17.6 y = 132473x – 138164 0.9905 5-100 3 10 76 (9) 85 (13) 90 (6) 79 (7) 80 (9) 89 (5)
Endrin I 17.8 y = 66959x – 69797 0.9933 5-100 3 10 72 (6) 75 (3) 102 (2) 77 (5) 73 (1) 116 (4)
Endosulfan beta 18.5 y = 100424x – 104999 0.9907 5-100 3 10 107 (4) 117 (4) 84 (4) 101 (6) 108 (7) 84 (2)
Endrin II 18.9 y = 17109x – 19134 0.9923 5-100 3 10 72 (5) 82 (2) 109 (2) 81 (5) 77 (2) 97 (5)
Trifloxystrobin 19.4 y = 213885x – 214709 0.9992 5-100 3 10 79 (1) 74 (5) 73 (2) 79 (3) 83 (4) 82 (1)
Endosulfan sulfate 20.1 y = 5246.2x – 4866.9 0.9927 5-100 3 10 106 (5) 72 (3) 110 (6) 106 (5) 76 (3) 101 (4)
Bifenthrin 20.9 y = 23614x – 23853 0.9920 5-100 3 10 72 (9) 70 (9) 72 (9) 73 (6) 71 (7) 78 (9)
Tetradifon 21.8 y = 23728x – 22266 0.9907 5-100 3 10 86 (3) 81 (4) 106 (2) 84 (1) 86 (3) 99 (2)
Lambda-cyhalothrin 22.9 y = 4367.8x – 7023.1 0.9532c 10-100 6 20 141 (24)c 140 (23)c 133 (24)c 139 (26)c 140 (25)c 145 (20)c aFrom matrix matched calibration curves; bLOQ method was obtained considering the lower spike level that resulted recovery from 70 to 120% and RSD < 20%. LOD was
LODm of 3 or 6 µg kg-1 and LOQm of 10 or 20 µg kg-1 were
comparable with EU MRLs (10 to 50 µg kg-1) and Brazil
MRLs (10 to 20 µg kg-1), except for fipronil with a MRL of
10 µg kg-1 that is below the LOQ
m of 20 µg kg
-1. However,
the LODm for fipronil (6 µg kg-1) is suitable for detection
in honey samples. It can be concluded that the proposed method allows good detectability, enabling the application of this method in real samples.
Figure 2 shows the chromatographic separation of the 24 pesticides and the internal standard quintozene in the matrix extract. For each extract and standard solution injected the internal standard was added for monitoring instrument response, but not for correction of peak areas.
From the validation evaluation the recovery results for the concentration levels of 20, 40 and 100 µg kg-1, presented
in Table 1, were between 71 and 118%, with RSD lower than 20%, for 22 compounds, which is considered suitable for pesticide residue analyses.29,39 For method precision,
in terms of repeatability (RSDr), 5 groups of compounds
with distinct behaviors can be identified: (i) recoveries near 100% and low RSD (near 10%): trichlorfon, trifluralin, chlorothalonil, and lindane; (ii) recoveries near 100% but with high RSD (10 to 20%): malathion, chlorpyrifos methyl, chlorpyrifos ethyl, fipronil, kresoxim methyl and bromophos methyl; (iii) recoveries between 70-120% with high RSD (< 10%): endrin I, 4,4-DDE, endrin II, tetradifon, endosulfan alpha, endosulfan beta and endosulfan sulfate, heptachlor epoxide; (iv) recoveries between 70-120%, near the lower limit of 70%, with low RSD (< 10%): bifenthrin, hexaclorobenzene, trifloxistrobin, heptachlor and dieldrin; (v) recoveries above the upper limit of 120% and high RSD (> 20%): lambda-cyhalothrin. The evaluation of the obtained RSD values, under repeatability and intermediate
precision conditions leads to the conclusion that the method of determination by GC-ECD is stable and that the major source of variation among the recovery values arises from the extraction step.
Table 1 presents the method intermediate precision (RSDip) evaluated by spiked matrix blank samples in the
same three levels of 20, 40 and 100 µg kg -1 during different
days. It was observed that RSDr and RSDip were above
20% for lambda-cyhalothrin and bromophos methyl. It demonstrates the difficulty in analyzing these compounds, due to the presence of residual interferences from the matrix affecting GC-ECD system, as well as variations in the extraction step.
The matrix effect is usually caused by matrix components that avoid the susceptibility of certain analytes of being adsorbed in the GC system, mainly on the insert of the injector. Moreover, the phenomenon took place when certain active sites were covered by the matrix of the sample, which decreased the interactions between the analytes and the active sites.40,41On the other hand, the
honey extract consists basically of carbohydrates, such as monosaccharide glucose and fructose, that provide matrix effect which is dependent of the endogenous components of the matrix, such as: size of molecules, polarity and thermal stability, presence of significant amount of endogenous components, that can result in reduction of the chromatographic response for some pesticides.42
In this work, a negative matrix effect was observed for chlorpyrifos ethyl (–34%), endosulfan beta (–44%) and endosulfan sulfate (–74%), 4,4-DDE (–54%), dieldrin (–46%), endrin II (–73%) and tetradifon (–31%). Still, polysaccharides present in honey extract caused positive matrix effect for the pesticides chlorpyrifos methyl
(+109%), chlorothalonil (+20%), malathion (+117%), lambda-cyhalothrin (+171%), bifenthrin (+133%), bromophos methyl (+341%), endosulfan alpha (+19%), endrin I (+75%), fipronil (+78%), heptachlor (+29%), heptachlor epoxide (+36%) hexachlorobenzene (+80%), lindane (+140%), trifloxystrobin (+31%), trifluralin (+23%) and lower than 10% for kresoxim methyl and trichlorfon. So, it can be observed in this study that the matrix effect was significantly high even after d-SPE clean-up, using PSA and MgSO4, therefore analytical curves were prepared in matrix
blank extracts in order to compensate for this effect.43
In general, it can be concluded that compounds with higher values of partition coefficient between organic carbon and water (Koc), like bifenthrin (2.4 × 10
5), trichlorfon
(1.2 × 10⁵), trifluralin (1.6 × 10⁴) and hexaclorobenzene
(5.0 × 10⁴) presented lower variation for recoveries. On the
other hand, for compounds with low Koc, such as bromophos
methyl (17), endrin (0.22 to 0.26), 4,4-DDE (0.024) and tetradifon (100), these variations were greater. Compounds with higher octanol:water coefficient values (log Kow from
5.4 to 6.2), such as bifenthrin, hexachlorobenzene, dieldrin and heptachlor, showed lower recovery values when compared with compounds with lower log Kow (0.43-4.8),
like trichlorfon, trifluralin, chlorothalonil, chlorpyrifos methyl, lindane, malathion, endosulfan beta, chlopyrifos ethyl, fipronil and kresoxim methyl. Thus, the recovery variations is related to the processes of releasing the compounds to the aqueous phase during the dissolution step, indicated by the respective log Kow and solubility, and
therefore by the pesticide adsorption affinity with sorbent at the clean-up step, determined by the Koc values.
From the studied compounds, only lambda-cyhalothrin presented results higher than the acceptable for recovery and RSD and the main factor that can explain these results are that changes in injector, liner and chromatographic column deposition of co-extractives are more intense due to late retention of lambda-cyhalothrin, increasing background effect, reflecting in low signal and poor linearity (r2 = 0.95), which may have resulted in the high
recovery values obtained, even with the use of matrix matched calibration standards.
Determinations of pesticides in honey by GC-ECD have been described in the literature employing different sample preparation methods. Barakat et al.44developed a
QuEChERS method for determination of 36 pesticides in honey, using GC-ECD and GC with nitrogen-phosphorus detector (NPD) with good recovery (70 to 120%), RSD between 1 and 22% and method limit of quantification (LOQ) ranged from 20 to 50 µg kg-1. Albero et al.13 used
MSPD for the determination of 15 pesticides in honey by GC-ECD. This method presented recoveries between
80 and 113%, RSD < 10% for all compounds and method LOD values from 0.5 to 15 µg kg-1. The same authors
used SPE with GC-MS and achieved recoveriesof > 86%, RSD < 10% and method LOD from 0.1 to 6.1 µg kg-1.26
Dispersive liquid-liquid microextraction method (DLLME) was used by Zacharis et al.14 for determination of 15
organochlorine pesticides in honey by GC-ECD and GC-mass spectrometry (MS) obtaining recoveries from 75 to 119%, RSD < 20% and method LOQ from 0.07 to 0.5 µg L-1 for analysis by GC-ECD and from 0.04 to
0.66 µg L-1 for GC-MS. Recently, Janov et al.45 published a
method for the determination of residues of neonicotinoids, including imidacloprid, acetamiprid, nitenpyram, tiacloprid, thiamethoxam, clotianidin and dinotefuran in honey, using DLLME and liquid chromatography (LC)-MS/MS. Recovery results ranged from 74 to 114%, RSD from
7 to 16% and method LOQ from 1.5 to 2.5 µg kg-1.
Likewise, Blasco et al.12 developed a method based on
SPE extraction for the determination of 42 pesticides in honey samples by GC-MS, for organochlorines, and by LC-atmospheric pressure chemical ionization (APCI)-MS, for organophosphates and carbamates. The recoveries were between 73 and 98%, with RSD from 3 to 19%, except for dimethoate which showed 40% of recovery. The method LOQ ranged from 3 to 100 µg kg-1.
The proposed method presented some advantages when compared with other methods. Sample preparation using SPE and MSPD presents good LOQ values, however, they have some disadvantages such as long extraction time, requires previous training of the analyst and large volume of solvent. The DLLME technique uses small volume of solvent but is not applied to a wide range of compounds. Thus, the QuEChERS method proposed in this work is simpler and when compared with another work44
that also used QuEChERS, it presented similar values of recovery and RSD, but better LOQ values. In sum, the proposed method proved to be quick and effective for the determination of pesticide residues in honey samples.
Applicability of the proposed method in real samples
The results shown in Table 2 demonstrate that the insecticides and acaricides (bifenthrin, chlorpyrifos ethyl, endosulfan sulfate, fipronil, lindane, malathion), and the fungicides (chlorothalonil, hexachlorobenzene and kresoxim methyl) were found in concentrations above the MRL values established for honey, according to the Brazilian Program of Controlled Residues and
Contaminants (PNCRC)46 and the European Union
legislation.11 Lindane, kresoxim methyl, fipronil and
The presence of pesticide residues in the analyzed honey samples can be attributed to environment contamination, because the producers did not report any application of pesticides directly or near the hives.
Results indicated the presence of chlorpyrifos ethyl and chlorothalonil both at 0.03 mg kg-1, and malathion
at 0.09 mg kg-1 in three of the samples, concentrations
above the MRLs allowed by the Brazilian and European legislations. These pesticides are applied to orange crops, chlorpyrifos ethyl on soybeans and chlorothalonil on grapes and soybeans, characterizing an indirect contamination by bees that pollinate these crops located in other nearby properties.
The relatively high concentrations of endosulfan sulfate and hexachlorobenzene compared with other values, are a matter of concern in terms of environmental contamination, but they are in agreement with values reported most frequently worldwide in the literature, such as the survey made by Rodrigues-Lopez, et al..47Endosulfan sulfate is
the main metabolite or degradation product of endosulfan (alpha + beta). Endosulfan was progressively restricted in Brazil in 2010, but remained in use, especially in soybeans. From 2011, the product can no longer be imported, and manufacturing in the country was banned from July 2012. This substance cannot be marketed in Brazil, as of July 2013. The banishment was based on toxicological studies involving the use of this pesticide, highly toxic, associated with endocrine and reproductive problems in farm workers and the general population.48
The results obtained by the application of the proposed method are similar to those reported in the literature and summarized in Table 2, where Rissato et al.,10 employing
GC-MS determination, found residues of chlorothalonil (< LOD), endosulfan sulfate (0.027 and 0.024 mg kg-1),
hexachlorobenzene (0.018 and 0.016 mg kg-1), chlorpyrifos
ethyl (0.010 and 0.015 mg kg-1) and malathion (0.243 and
0.209 mg kg-1) in honey samples from the ecological
reserve of Bauru (Brazil). Blasco et al.12 analyzed
honey samples from Portugal and Spain and detected hexachlorobenzene in 32% of them, and other pesticides, such as gamma hexachlorocyclohexane and its isomers, DDT and metabolities, methiocarb, carbofuran, pirimicarb and methyl-parathion in concentrations from 0.003 to 4.31 mg kg-1. Zhen et al.40 also found malathion
(6.2 µg kg-1), bifenthrin (1.0 and 2.5 µg kg-1), besides
other 21 compounds detected in different honey samples, using GC-MS.
Table 3 shows the pesticides authorized in Brazil for the cultures cultivated near the sampled hives, pesticides not authorized for these cultures, but that can be used in others, as well as banned pesticides in Brazil and metabolites included in this study. Compounds followed by an uppercase letter “b” were found above the LOQ and those with an uppercase letter “a” were detected in the samples.
Furthermore, the contamination of bees by pesticides influences in their ability and capacity to return to the hive and pollinize.15 This factor, combined with the presence Table 2. Pesticide concentrations in honey samples, using the proposed method, MRL values and results from other studies
Pesticide
MRL / (mg kg-1) Residue / (mg kg-1) Results from literature
Brazil33 EU11 Sample 1 Sample 2 Sample 3 Sample 4 Concentration /
(mg kg-1) Ref.
Organophosphates – – – – – – 0.0024 to 0.243 47
Chlorpyrifos ethyl 0.02 – nd 0.03 nd 0.03 0.015 10
Malathion – 0.02 nd nd 0.09 0.09 0.243, 0.025 10,40
Organohalogens – – – – – – 0.001 to 4.31 47,12
Chlorothalonil – 0.01 nd 0.03 nd nd <LOQ 10
Endosulfan sulfate – 0.01 nd 0.9 nd nd 0.027 10
Hexachlorobenzene – – nd 0.2 nd nd 0.018 10
Lindane 0.01 0.01 < LOQ nd nd nd – –
Pyrazoles – – – – – – – –
Fipronil – 0.01 nd nd < LOQ nd – –
Pyrethroids – – – – – – 0.001 to 0.092 47
Bifenthrin – 0.01 nd < LOQ nd nd 0.062 40
Strobilurin – – – – – – – –
Kresoxim methyl – 0.05 nd nd < LOQ nd – –
of pesticide residues in the flower nectar,results in a big concern about environmental and human health, requiring studies based on monitoring with reliable analytical methods.2
Conclusions
Results obtained in this work showed a suitable method for the determination of trichlorfon, trifluralin, hexachlorobenzene, lindane, chlorpyrifos methyl, chlorothalonil, kresoxim methyl, heptachlor, malathion, chlorpyrifos ethyl, fipronil, heptachlor epoxide, endosulfan alpha, 4,4-DDE, dieldrin, endrin I, endosulfan beta, endrin II, trifloxystrobin, endosulfan sulfate, bifenthrin and tetradifon in honey samples, employing modified QuEChERS method allied with GC-ECD analysis with recoveries from 70 to 120% and RSD < 20%. The sensitivity of the chromatographic analysis permitted the achievement of method LOD values between 3 and 6 µg kg-1.
Extraction by QuEChERS method, despite the high levels of sugar and other interferences in honey, provides an adequate clean-up for determinations with simpler equipment, such as GC-ECD, when compared to mass spectrometry. Due to the simplicity of the developed method, it can be applied in routine analysis, taking into account the increased demand for this type of determination, since bees are constantly exposed to chemical contaminants.
The occurrence of pesticide residues in relatively high concentrations, even considering the small number of
Table 3. Relationship between studied pesticides, cultures located near the sampled hives and residues found in the method application
Crop Pesticides
Eucalyptus trees fipronil,a trifluralin
Peach tetradifon, trichlorfon
Orange bifenthrin,a chlorothalonil,b chlorpyrifos ethyl,b
lambda-cyhalothrin, malathion, tetradifon, trifloxystrobin, trifluralin
Grape bifenthrin,a chlorothalonil,b kresoxim methyl,a
lambda-cyhalothrin, trichlorfon
Soybean bifenthrin,a chlorothalonil,b chlorpyrifos ethyl,b
fipronil,b lambda-cyhalothrin, trichlorfon,
trifloxystrobin, trifluralin
Not authorized bromophos methyl, chlorpyrifos methyl
Banned dieldrin, endosulfan alpha, endosulfan beta, endrin (I + II), hepachlor, hexachlorobenzene,b lindanea
Metabolites Endosulfan sufalte (endosulfan),b 4,4-DDE (DDT),
heptachlor epoxide (heptachlor)
a< LOQ; b> LOQ. Source: AGROFIT.49
samples analyzed in this work, is a matter of concern, and was clearly related to the pesticides applied in cultures near the hives.
Acknowledgments
The authors gratefully acknowledge the financial support from CNPq (Brazil) and fellowship grants from CNPq and CAPES (Brazil).
References
1. Tomasini, D.; Sampaio, M. R. F.; Caldas, S. S.; Buffon, J. G.; Duarte, F. A.; Primel, E. G.; Talanta2012, 99, 380.
2. Lozowicka, B.; Ecotoxicol. Environ. Saf.2013, 97, 210. 3. European Union Council Directive 2001/110/EC; Off. J. Eur.
Commun. 2002, L10, 47.
4. Skerl, M. I. S.; Bolta, S. V.; Cesnik, H. B.; Gregorc, A.; Bull. Environ. Contam. Toxicol. 2009, 83, 374.
5. Forsgren, E.; J. Invertebr. Pathol.2010, 103, S5.
6. Silva, L. R.; Videira, R.; Monteiro, A. P.; Valentão, P.; Andrade, P. B.; Microchem. J.2009, 93, 73.
7. http://sistemasdeproducao.cnptia.embrapa.br/FontesHTML/ Mel/SPMel/comercializacao.htm accessed in May 2014. 8. Erdogrul, O.; Food Control2007, 18, 866.
9. Rial-Otero, R.; Gaspar, E. M.; Moura, I.; Capelo, J. L.; Talanta
2007, 71, 503.
10. Rissato, S. R.; Galhiane, M. S.; Almeida, M. V.; Generutti, M.; Apon, B. M.; Food Chem.2007, 101, 1719.
11. EU Pesticides Database, 2014. http://ec.europa.eu/sanco_ pesticides/public/?event=commodity.selection, accessed in May 2014..
12. Blasco, C.; Fernández, M.; Pena, A.; Lino, C.; Silveira, M. I.; Font, G.; Picó, Y.; J. Agric. Food Chem.2003, 51, 8132. 13. Albero, B.; Sánchéz-Brunete, C.; Tadeo, J. L.; J. AOAC Int.
2001, 84, 1171.
14. Zacharis, C. K.; Rotsias, I.; Zachariadis, P. G.; Zotos, A.; Food Chem.2012, 134, 1665.
15. Tapparo, A.; Giorio, C.; Soldà, L.; Bogialli, S.; Marton, D.; Marzaro, M.; Girolami, V.; Anal. Bioanal. Chem.2013, 405, 1007.
16. Presta, M. A.; Kolberg, D. I. S.; Wickert, C.; Pizutti, I. R.; Adaime, M. B.; Zanella, R.; Chromatographia2009, 69, 237. 17. Kurz, M. H. S.; Gonçalves, F. F.; Adaime, M. B.; Costa, I. F. D.;
Primel, E. G.; Zanella, R.; J. Braz. Chem. Soc.2008, 19, 1129. 18. Blasco, C.; Vazquez-Roig, P.; Onghena, M.; Masia, A.; Picó, Y.;
J. Chromatogr. A2011, 30, 4892.
19. Pang, G. F.; Fan, C. L.; Liu, Y. M.; Cao, Y. Z.; Zhang, J. J.; Fu, B. L.; Li, X. M.; Wu, Y. P.; Food Addit. Contam.2006, 23, 777. 20. Bianchin, J. N.; Nardini, G.; Merib, J.; Dias, A. N.;
21. Pinho, G. P.; Neves, A. A.; Queiroz, M. E. L. R.; Silvério, F. O.; Food Control2010, 21, 1307.
22. Schwarz, T.; Snow, T. A.; Santee, C. J.; Mulligan, C. C.; Class, T.; Wadsley, M. P.; Nanita, S. C.; J. Agric. Food Chem.
2011, 59, 814.
23. Anastassiades, M.; Lehotay, S.; Stajnbaher, D.; Schenck, F. J.;
J. AOAC Int.2003, 83, 412.
24. Prestes, O. D.; Friggi, C. A; Adaime, M. B.; Zanella, R.; Quim. Nova2009, 32, 1634.
25. Blasco, C.; Lino, C. M.; Picó, Y.; Pena, A.; Font, G.; Silveira, M. I. N.; J. Chromatogr. A2004, 1049, 155.
26. Albero, B.; Sánchéz-Brunete, C.; Tadeo, J. L.; J. Agric. Food Chem.2004, 52, 5828.
27. Caldas, S. S.; Bolzan, C. M.; Cerqueira, M. B.; Tomasini, D.; Furlong, E. B.; Fagundes, C.; Primel, E. G.; J. Agric. Food Chem.2011, 59, 11918.
28. Ministério da Agricultura, Pecuária e Abastecimento (MAPA); Instrução normativa 11, de 20 de Outubro de 2000; Diário Oficial da União: Brasília, 2000, section I, p. 16.
29. http://ec.europa.eu/food/plant/protection/pesticides/docs/ qualcontrol_en.pdf accessed in May 2014.
30. Ferrer, C.; Lozano, A.; Aguera, A.; Girón, A. J.; Fernández-Alba, A. R.; J. Chromatogr. A2011, 1218, 7634.
31. Fernández, M.; Picó, Y.; Mañez, J.; Chromatographia2002,
56, 577.
32. Stajnbaher, D.; Zupancic-Kralj, L.; J. Chromatogr. A2003,
1015, 185.
33. Turkmen, N.; Sari, F.; Poyrazoglu, E. S.; Velioglu, Y. S.; Food Chem. 2006, 95, 653.
34. Vidal, J. L. M.; Aguilera-Luiz, M. M.; Romero-González, R.; Frenich, A. G.; J. Agric. Food Chem. 2009, 57, 1760. 35. Li, J.; Chen, L.; Wang, X.; Jin, H.; Ding, L.; Zhang, K.;
Zhang, H.; Talanta2008, 75, 1245.
36. Pérez, M. L. G.; Bolaños, P. P.; Romero-González, R.; Martínez-Vidal, J. L.; Garrido-Frenich, A.; J. Chromatogr. A2012, 1248, 130.
37. Bevilaqua, D. B.; Rambo, M. K. D.; Rizzetti, T. M.; Cardoso, E. L.; Martins, E. F.; J. Cleaner Prod.2013, 47, 96.
38. Prestes, O. D.; Adaime, M. B.; Zanella, R.; Scientia Chromatographica2011, 3, 51.
39. Ribani, M.; Bottoli, C. B. G.; Collins, C. H.; Jardim, I. C. S. F.; Melo, L. F. C.; Quim. Nova2004, 27, 771.
40. Zhen, J.; Zhuguang, L.; Meiyu, C.; Yu, M.; Jun, T.; Yulan, F.; Jiachen, W.; Zhaobin, C.; Fengzhang, T.; Chin.J. Chromatogr.
2006, 24, 440.
41. Kwon, H.; Lehotay, S. J.; Geis-Asteggiante, L.; J. Chromatogr. A2012, 1270, 235.
42. Pinho, G. P.; Silvério, F. O.; Neves, A. A.; Queiroz, M. E. L. R.;
Quim. Nova2012, 35, 742.
43. Park, J. H.; Mamun, M. I. R.; Choi, J. H.; El-Aty, A. M. A.; Assayed, M. E.; Choi, W. J.; Yoon, K. S.; Han, S. S.; Kim, H. K.; Park, B. J.; Kim, K. S.; Kim, S. D.; Choi, H. G.; Shim, J. H.;
Biomed. Chromatogr.2010, 24, 893.
44. Barakat, A. A.; Badawy, H. M. A.; Salama, E.; Attallah, E.; Maatook, G.; J. Food Agric. Environ.2007, 5, 97.
45. Janov, P.; Guzsvány, V.; Franko, M.; Lazic, S.; Sakac, M.; Saric, B.; Banjac, V.; Talanta2013, 111, 125.
46. Ministério da Agricultura, Pecuária e Abastecimento (MAPA),
Plano Nacional de Controle de Resíduos em Produtos de Origem Animal; Instrução Normativa SDA No. 11, May 7, 2014. 47. Rodrigues-Lopez, D.; Ahumada, D. A.; Díaz, A. C.; Guerrero,
J. A.; Food Control2014, 37, 33.
48. Rastogi, D.; Narayan, R.; Saxena, D. K.; Chowdhuri, D. K.;
Chemosphere2014, 94, 104.
49. http://agrofit.agricultura.gov.br/agrofit_cons/principal_agrofit_ cons, accessed in May 2014.