Article
Printed in Brazil - ©2014 Sociedade Brasileira de Química0103 - 5053 $6.00+0.00A
*e-mail: [email protected]
CO and Ethanol Electro-Oxidation on Pt-Rh/C
Alfredo Calderón-Cárdenas,a John E. Ortiz-Restrepo,a Nelson D. Mancilla-Valencia,a
Gerardo A. Torres-Rodriguez,b Fabio H. B. Lima,c Alberto Bolaños-Rivera,a
Ernesto R. Gonzalezc and William H. Lizcano-Valbuena*,a
aDepartamento de Química, Universidad del Valle, Calle 13 No. 100-00,
Ciudad Universitaria “Meléndez”, Cali, Colombia
bDepartamento de Biología, Universidad del Cauca, Calle 5 No. 4-70,
Santo Domingo, Popayán, Colombia
cInstituto de Química de São Carlos - USP, CP 780, 13560-970 São Carlos-SP, Brazil
Neste trabalho foi estudado o efeito da composição e tratamento térmico em H2, de materiais de
Pt-Rh/C com proporções atómicas Pt:Rh de 3:1, 1:1 e 1:3 e 40% em massa de metal com relação a carbono, para a oxidação de COads e a oxidação de etanol. Os catalisadores foram preparados utilizando redução química com ácido fórmico e caracterizados fisicamente pelas técnicas de energia dispersiva de raios-X (EDX), retroespalhamento de elétron (EBS) e microscopia eletrônica de transmissão (TEM), mostrando relações Pt:Rh muito próxima às previstas, tamanhos de partícula médios similares e uma apropriada distribuição do metal sobre o suporte de carbono na micro e nano escala. Experimentos de voltametria cíclica mostraram um enriquecimento da superfície em Pt, devido à instabilidade termodinámica do sistema na temperatura experimental. A normalização das correntes foi feitas utilizando a carga de dessorção oxidativa de CO permitindo observar as diferenças entre os níveis atuais gerados exclusivamente pelos efeitos eletrônicos do Rh na Pt. O tratamento térmico dos catalisadores de Pt-Rh em uma atmosfera de H2, mostrou grande estabilidade dos materiais e também um notório incremento nos níveis de corrente para as reações de eletro-oxidação de CO e etanol. Isto sugere a necessidade de melhor explorar os efeitos dos tratamentos térmicos na eletrocatálise da reação de oxidação do etanol.
In this work we studied the effect of the composition and thermal treatment in H2 of Pt-Rh/C materials with atomic ratios close to Pt:Rh 3:1, 1:1 and 1:3 and metal loading of 40 wt.%, for the COads and ethanol oxidation. Catalysts were prepared by chemical reduction with formic acid and
physically characterized by energy dispersive X-rays spectroscopy (EDX), electron backscattering (EBS) and transmission electron microscopy (TEM), showing Pt:Rh ratios close to the nominals values, similar average particle sizes and an appropriated distributions of metal on carbon support at micro and nano scale. Cyclic voltammetry experiments showed a surface enriched in Pt due to the termodinamically unstable Pt-Rh system at the experimental temperature. The currents were normalized using the charge of oxidative desorption of CO allowing to observe differences among the current levels generated exclusively by the Rh electronic effects on the Pt. The thermal treatments of the Pt-Rh catalysts in a hydrogen atmosphere showed greater stability of the materials and notorious increases of the current levels for CO and ethanol electro-oxidation reactions. This suggests the necessity of better exploring the effects of thermal treatments in the electrocatalysis of the ethanol oxidation reaction.
Introduction
Nowdays, ethanol presents considerable interest for its use in direct alcohol fuel cells (DAFCs) due to its low toxicity, high energy density compared to methanol and available technology for its industrial production.1
However, several problems have to be solved in a cell fed with ethanol (DEFC) as follows: i) slow electrochemical
oxidation of fuel on the anode,2ii) slow electro-reduction
of oxygen on the cathode,3 and iii) the crossover of fuel
through the polymeric membrane from anode to cathode.4
Regarding the first item, it is well known that electro-oxidation of ethanol on Pt is slow because it occurs according to several pathways,5 forming species with one
and two carbon atoms strongly adsorbed on the electrode surface6,7 as CO, acetaldehyde and acetic acid,7,8 species
related to dehydrogenation processes and carbon-carbon bond breaking.9,10
To improve the oxidation of ethanol on the surface of Pt, several reports show that mixing Pt with other metals results in more active catalysts materials, Thus, bi-11
and tri-12 metallic Pt-based catalysts have been tested.
Several studies in alkaline13 and acid media14-16 show that
mixtures of Pt with Ru have more tolerance to poisoning by COads, but complete oxidation is not favored. Likewise,
studies on Pt-Sn catalysts have found a decrease in the overpotential of the reaction,17 which leads to an increase
in the current densities of ethanol oxidation compared to the reaction on Pt and on Pt-Ru catalysts.18 Other Pt-based
materials have been studied, but do not have provided better catalytic activities by comparison with those observed for Pt-Sn and Pt-Ru.19 None of the above catalysts (Pt-Sn
or Pt-Ru) are highly selective towards the production of CO2.20,21 However, as it was observed by de Souza et al.,22
using differential electrochemical mass spectrometry (DEMS) and in situ infrared spectroscopy (FTIR), Pt-Rh electrodeposits show better performance as catalysts towards the complete oxidation of ethanol compared to pure Pt, and the Pt-Rh 77:23 atomic ratio had a better performance. Similar results were reported by Bergamaski
et al.23 using Pt-Rh electrodeposits with 75:25 atomic ratio.
These results were explained by means of destabilization of ethanol molecule on the catalytic surface caused by the dehydrogenation process, which allows dissociation of carbon-carbon bond more easily than on Pt. Studies about Pt-Rh materials supported on carbon,24-26 showed again a
higher efficiency for ethanol oxidation to CO2, without a
significant overall kinetics enhancement of the reaction. However, these electrocatalysts showed a shift to lower potential for oxidation of COads compared to Pt/C. Lima
and Gonzalez,27 attributed this effect to the bi-functional
mechanism and electronic effects caused by the addition of Rh to the structure of Pt, when Pt 5 d-band is modified, as shown by XANES experiments, leadings to a decreased adsorption strength of adsorbates on the Pt atoms. Seeking to correlate the electrochemical activity of the oxidation of COads and the oxidation of ethanol with the electronic
properties of the mixture Pt-Rh, Lima and Gonzalez in a later report,28 showed that monolayers of Pt deposited on
Rh/C nanoparticles, increases the rate of oxidation of COads,
mainly due to the diminution of the strength of adsorption at high potentials, when the Pt-5d band vacancy is increased by the effect of Rh.
On the other hand, several studies have shown that Pt-Ru/C has better catalytic activity in H2/O2 fuel cells29-31
and direct methanol fuel cells32 when the catalysts
were thermally treated in hydrogen atmosphere. The improvement in the catalytic activities can be due to: i)
the decrease of impurities, ii) reduction of metal oxides
on the catalyst surface, iii) an increase of the degree of
alloy between Pt and secondary metals obtaining more stable materials, besides the electronic effects observed and reported by several techniques.31 In a previous report,
Lima et al.25 found that the oxidation of ethanol on Pt-Rh
material at 40 wt.% metal composition in Pt:Rh 1:1 atomic
ratio, showed higher currents when thermally treated. In this paper, we studied the oxidation of COads and ethanol,
on 40 wt.% Pt-Rh/C materials with Pt:Rh 3:1, 1:1 and 1:3
atomic ratios, to determine the effect of composition and the thermal treatment in H2.
Experimental
Pt-Rh/C electrocatalysts were prepared by chemical reduction with formic acid (Mallinckrodt AR®). Briefly, the
procedure involves adding fresh aqueous solutions of H2PtCl6
(Aldrich) and RhCl3 (Alfa Aesar) to a dispersion of Vulcan
XC-72 carbon in 0.5 mol L-1 formic acid at 80 °C, following
the procedure reported by Lizcano-Valbuena et al.33 and
extended to Pt-Rh/C by Lima et al.25 The carbon used was
pre-treated with Ar (850 ºC, 5 h) to remove impurities. Catalyst powders were collected on a cellulose filter, washed repeatedly with deionized water at room temperature and dried in an oven at 80 ºC. To perform the thermal treatment the materials were placed in H2 at 550 ºC for an appropriate
time into a tubular furnace (MAITEC).
The samples for transmission electron microscopy (TEM) analysis were prepared by ultrasonic aqueous dispersion of catalytic powders, and depositing a drop of the dispersion on a copper grid and drying it at oven. The images were taken on photographic film using a JEOL 1200 EX microscope at 80 kV, scanned on an Epson Perfection 4490 scanner and processed using Image Pro Analyzer software 6.3 counting more than 400 particles per item.
Electrochemical experiments were carried out in a three electrode cell using a 0.5 mol L-1 sulfuric acid solution
(Mallinckrodt AR®) as supporting electrolyte. The working
electrodes were prepared depositing appropriate amounts of catalyst powder on a 0.4 cm diameter pyrolytic carbon disc. After the deposition, a drop of Nafion® solution
(Aldrich, 5% in aliphatic alcohols) was added to hold the powder to the substrate, as described by Schmidt et al.34 The
auxiliary electrode was a 1 cm2 geometric area platinum
foil, and a reversible hydrogen electrode (RHE) was used as reference electrode.
Cyclic voltammetric experiments in H2SO4 0.5 mol L-1
were performed at 100 mV s-1 between 0.05 V and 1.40 V vs.
RHE until reproducible profiles were obtained. The same process was carried out for to all materials studied.
To obtain the electrochemical area of the catalyst surfaces it was used a weighted average between 420 µC cm-2 and 442 µC cm-2 corresponding to the
electro-oxidation charge of a monolayer of COads (grade 2.3, AGA)
on Pt and Rh, respectively.
Finally, for the oxidation of ethanol, cyclic voltammetric curves were recorded in a potential range between 0.05 V vs. RHE and 1.10 V vs. RHE at 10 mV s-1 and 30
ºC. Ethanol concentrations of 0.1, 0.5 and 1.0 mol L-1
were used. Ethanol in the experiments was absolute grade (Mallinckrodt AR®) and water was purified in a Milli-Q
system (Millipore).
Results and Discussion
Physical characterization
The composition of the as-prepared Pt-Rh electrocatalysts, was determined by energy dispersive X-ray spectroscopy (EDX), and the results (Table 1) were similar to the nominal Pt:Rh ratios (3:1, 1:1, 1:3), indicating an appropriate preparation procedure. Table 1 summarizes findings of several authors about structural parameters, particle size and composition of Pt-Rh/C materials in accordance the preparation method used. This table shows that the authors who prepared materials with metallic content of 40 wt.% did not test different compositions. The
researchers prepared materials at different Pt:Rh atomic
ratios and obtained higher variations in particle size with increasing Rh content in comparison with those obtained in the present work. This shows that our preparation method is highly efficient to reduce Pt and Rh cations, allowing to obtain materials with reproducible morphologies.
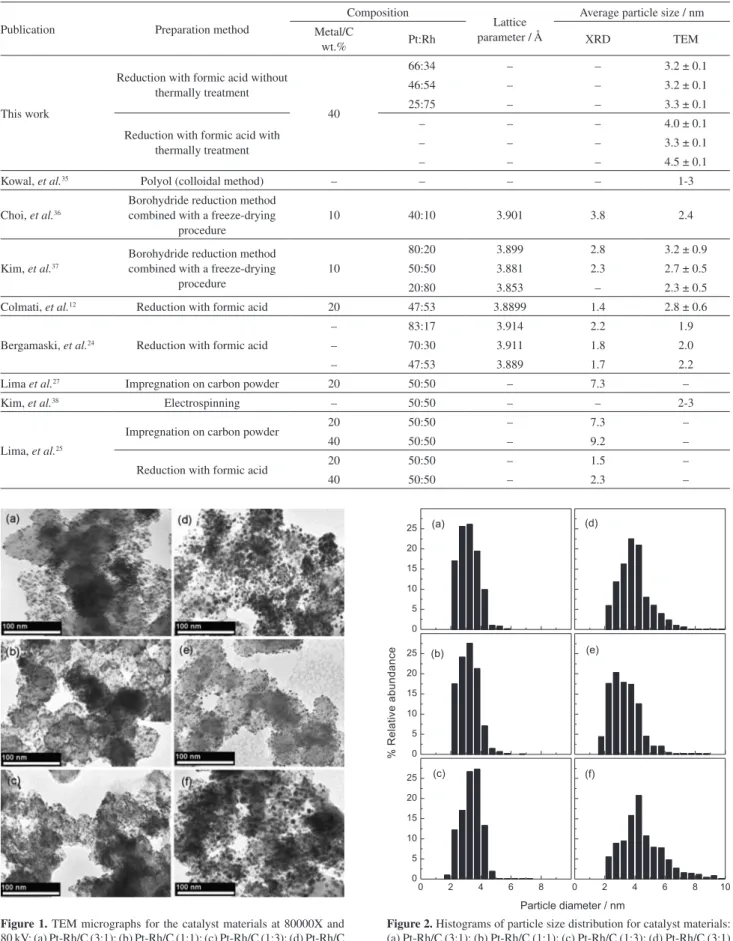
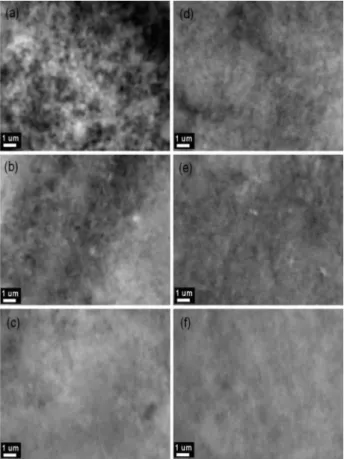
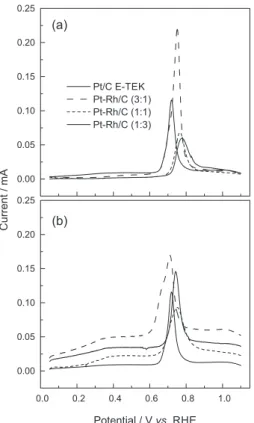
In general, TEM images show a homogeneous distribution of particles and without the presence of agglomerates in any of the images of the as-prepared materials (Figure 1). The average diameters are close to 3 nm for as-prepared materials (see distribution histograms, Figure 2), and the average value is slightly higher than that reported by other authors (Table 1). The thermally treatment materials show wider distributions outcomes (around 4 nm), due to agglomeration and coalescence phenomena. In Figure 3, images of electron backscattering (EBS), show no agglomeration in microscale, therefore there is no formation of metallic clusters in the materials for all compositions, indicating a good dispersion.
Physical characterization results show suitable micro-scale distribution of metal catalysts on carbon support and similar particle size distributions at nanoscale for both materials series (as-prepared and TT); Accordingly, it is possible to attribute I-V response from different cyclic voltammetry experiments (oxidation of COads and oxidation
of ethanol) only to material catalytic activities, without morphology and particle size particle effects.
Electrochemical experiments
Cyclic voltammetry of Pt/C and Pt-Rh/C in sulphuric acid 0.5 mol L-1
A very interesting fact was observed when the cyclic voltammograms, for as-prepared materials were collected. Figure 4, shows CV profiles at 1, 10, 50 and 200 cycles for Pt-Rh/C 1:1 in 0.5 mol L-1 sulphuric acid.
Cycle 1 is very similar to the voltammetric behavior of Pt-Rh electrodes in H2SO4 solution39, where the hydrogen
desorption region in the first cycles on as-prepared Pt-Rh/C 1:1 material has only one peak caused by the effect of Rh on Pt CV profile in this potential range. As the cycles are running, the CV profiles change to the known Pt/C CV profile. This fact is an evidence of surface enrichment in Pt due to the system thermodynamically stable are the phases separated from Pt and Rh40 at 30 °C (the temperature of the
experiment). Similar behavior was observed to Pt-Rh/C 3:1 and 1:3 as shown in Figure 5.
Figure 6 shows cycles 1 and 200 of CVs in 0.5 mol L-1
H2SO4 between 0.05 V and 1.40 V vs. RHE (scan rate:
100 mV s-1) corresponding to the Pt-Rh/C materials for
different atomic compositions thermally treated in H2 and
Table 1. Comparative table of some morphological and structural parameters of Pt-Rh/C catalysts characterized by EDX, XRD and TEM
Publication Preparation method
Composition
Lattice parameter / Å
Average particle size / nm Metal/C
wt.% Pt:Rh XRD TEM
This work
Reduction with formic acid without thermally treatment
40
66:34 – – 3.2 ± 0.1
46:54 – – 3.2 ± 0.1
25:75 – – 3.3 ± 0.1
Reduction with formic acid with thermally treatment
– – – 4.0 ± 0.1
– – – 3.3 ± 0.1
– – – 4.5 ± 0.1
Kowal, et al.35 Polyol (colloidal method) – – – – 1-3
Choi, et al.36
Borohydride reduction method combined with a freeze-drying
procedure
10 40:10 3.901 3.8 2.4
Kim, et al.37
Borohydride reduction method combined with a freeze-drying
procedure
10
80:20 3.899 2.8 3.2 ± 0.9
50:50 3.881 2.3 2.7 ± 0.5
20:80 3.853 – 2.3 ± 0.5
Colmati, et al.12 Reduction with formic acid 20 47:53 3.8899 1.4 2.8 ± 0.6
Bergamaski, et al.24 Reduction with formic acid
– 83:17 3.914 2.2 1.9
– 70:30 3.911 1.8 2.0
– 47:53 3.889 1.7 2.2
Lima et al.27 Impregnation on carbon powder 20 50:50 – 7.3 –
Kim, et al.38 Electrospinning – 50:50 – – 2-3
Lima, et al.25
Impregnation on carbon powder 20 50:50 – 7.3 –
40 50:50 – 9.2 –
Reduction with formic acid 20 50:50 – 1.5 –
40 50:50 – 2.3 –
Figure 1. TEM micrographs for the catalyst materials at 80000X and
80 kV: (a) Pt-Rh/C (3:1); (b) Pt-Rh/C (1:1); (c) Pt-Rh/C (1:3); (d) Pt-Rh/C (3:1) TT; (e) Pt-Rh/C (1:1) TT; (f) Pt-Rh/C (1:3) TT.
Figure 2. Histograms of particle size distribution for catalyst materials:
show intermediate profiles between the voltammetric profiles of pure supported Pt and pure supported Rh materials,41-43 and no changes were observed at cycle 200
possibly due to the higher stability of bimetallic materials with a higher degree of alloy caused by thermal treatment.
The increase of Pt on the as-prepared materials’ surface can be explained by the thermodynamic instability of the Pt-Rh mixture at room temperature,40 or by its smaller
surface energy than Rh in acid solutions.44 Thus, two
situations may have occurred: i) the Rh migration inside
metal nanoparticles, but in our experimental conditions is
not possible to confirm this fact; ii) dissolution of Rh in
H2SO4 solutions, as some authors have shown,41,45,46 where
oxide formation takes place on the electrode surface after repetitive potential cycling, and the metal alloy surface is enriched in the less oxidized component, in this case Pt, but the amounts of Rh released are very small and it was not possible to detect them. Unlike the as-prepared materials, thermally treated materials were less likely to present surface modification, showing stable voltammetric profiles before the cycle 200, with an intermediate character between the profiles of Pt and Rh. This suggests that
Figure 3. EBS micrographs for the catalyst materials, 10000X and 30 kV:
(a) Pt-Rh/C (3:1); (b) Pt-Rh/C (1:1); (c) Pt-Rh/C (1:3); (d) Pt-Rh/C (3:1) TT; (e) Pt-Rh/C (1:1) TT; (f) Pt-Rh/C (1:3) TT.
Figure 4. Voltammetric profiles of Pt-Rh/C electrode (1:1) in 0.5 mol L-1
H2SO4 at different potential cycles, at 100 mV s-1 and 30 ºC for as-prepared
materials.
Figure 5. Cyclic voltammetry of materials Pt-Rh/C at different
compositions in 0.5 mol L-1 H
2SO4 at 100 mV s-1 and 30 ºC for as-prepared
materials: (a) first cycle; (b) cycle 200.
Figure 6. Cyclic voltammetry of materials Pt-Rh/C at different
compositions in 0.5 mol L-1 H
2SO4 at 100 mV s-1 and 30 ºC for thermally
the thermal treatment formed more stable metal alloys, with less Pt surface enrichment on the surface of the nanoparticles.
Electro-oxidation of pre-adsorbed carbon monoxide
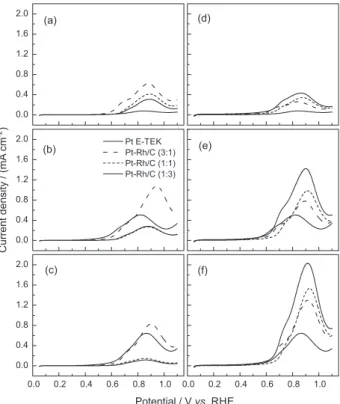
In materials of Pt-Rh/C non-thermally treated, the surfaces of nanoparticles have fewer Rh atoms, as discussed above. This fact suggests that the main effect of Rh atoms on the catalytic activity of Pt-Rh/C materials is to induce electronic effects in Pt atoms exposed in the nanoparticles. Figure 7a shows a variation of the initial potential for the oxidation of COads, of approximately 50-100 mV towards
higher values in materials Pt-Rh/C (1:1) and Pt-Rh/C (1:3) compared to Pt/C, showing that Rh makes it more difficult to oxidize COads compared with pure Pt. Our results are
consistent with those reported by Kim et al.37 who explain
that the Pt-CO bond is strengthened due to the electronic interaction of Rh and Pt, as shown by XANES experiments measurements in the of Pt L3 edge. The changes are detected as changes in the XANES intensity at the absorption edge, corresponding to the electronic transition 2p3/2 → 5d. This
transition is less intense in bimetallic catalysts Pt-Rh/C compared with Pt/C, indicating that there is an increase of electron density in the Pt 5d band when Rh is present,
and also an increase in energy with respect to the Fermi level.47-49 These results indicate that electronic effects of Rh
on Pt, are responsible for the shift in the COads potential
oxidation towards higher values, as observed.
On the other hand, Figure 7b shows the COads monolayer
oxidation of the thermally treated catalysts which shows a different behavior with respect to non-treated materials. Now, there is a decrease in the onset potential for electro-oxidation for the three Rh containing catalysts with respect to Pt/C, indicating that the electro-oxidation of COads on
these catalysts is easier. In these cases, as was explained before, the Rh exposed on the surface could act contributing with oxygenated species for the CO desorption. Moreover, an appropriate morphological distribution may also contribute to the higher current density level for oxidation of COads on thermally treated materials compared to
as-prepared materials; thermally treated catalysts have larger nanoparticles and it is expected that the bond strength of adsorbates that poison the catalytic surface is lower, as has been discussed by several authors.25,33,50-53 In this respect, our
work shows that the rate of CO oxidation increases with the surface content of Rh, as observed by Park et al.52
The electroactive areas from the COads desorption charge
were determined subtracting the CO stripping area and the voltammetric area (using N2) to reduce the contributions of
the double layer region. The results of electroactive areas are summarized in Table 2. It is observed that the thermally treated materials have larger areas than as-prepared materials in spite of the larger particle sizes perhaps due to nucleation. Larger active areas are related to fewer oxides on the surface54
and/or a cleaning process during thermal treatment. Finally, the electroactive areas were used to normalize the currents obtained in the electro-oxidation of ethanol.
Ethanol electro-oxidation
Figures 8a, 8b and 8c correspond to the scan towards positive potential for the electro-oxidation of ethanol at 30 °C on the as-prepared catalysts, at 10 mV s-1 scan rate
and three ethanol concentrations. The higher concentration
Figure 7. Electro-oxidation of a preadsorbed CO monolayer on the
electrode surface. CO adsorption time: 10 minutes. Adsorption potential: 0.05 V vs. RHE. Scan rate: 10 mV s-1. Supporting electrolyte: 0.5 mol L-1
H2SO4: (a) as-prepared materials; (b) thermally treated materials.
Table 2. Active areas of the catalysts Pt-Rh/C determined by striping a single layer of COads
Composition As-prepared materialsActive area / (m2 g-1)
Active area / (m2 g-1)
Thermally treated materials
Pt/C E-TEK 50 –
Pt-Rh/C (3:1) 41 67
Pt-Rh/C (1:1) 47 70
showed an increase of the overall kinetics of the reaction, observed for the catalyst Pt-Rh/C (3:1) at potentials above 0.80 V vs. RHE compared to the electrochemical
response of Pt/C, showing the highest current density with 0.5 mol L-1 ethanol at 0.92 V vs. RHE. For ethanol
concentrations of 0.5 mol L-1 and 1.0 mol L-1, and potentials
below of 0.80 V vs. RHE, the reaction on Pt/C is the one
with the highest levels of current, followed by the reaction on Pt-Rh/C (3:1), and then by Pt-Rh/C (1:1) and Pt- Rh/C (1:3) with similar current densities. As it was expected, the electro-oxidation of ethanol is not favored because the COads is poisoning the catalyst surface at potentials
lower than 800 mV vs. RHE (reported by Lima and
Gonzalez27) where the strength of CO
ads adsorption on Pt
is higher. In 0.1 mol L-1 ethanol concentration, the overall
kinetics of oxidation of the alcohol is higher in Pt-Rh materials compared to Pt/C, even at potentials lower than 0.80 V vs. RHE. The explanation may be found in the low
concentration, where the ratio [ethanol molecules/active sites for adsorption] is lower, the poisoning of the surface by COads is less significant and the overall kinetics imposed
by dehydrogenation processes and breaking of the carbon-carbon bond, which are favored by the electronic effects already discussed. These results are in agreement to the observations of Kim et al..47
Unlike as-prepared materials in thermally treated catalysts (Figures 8d, 8e and 8f), we observed an increase in current density for the catalyst containing Rh at the three concentrations of ethanol used in this work. Pt-Rh/C (1:3) TT showed the highest levels of current density in the whole potential range studied, increasing its value more than three times when current peaks are compared. The combination of electronic effects with the bifunctional mechanism can make more active thermally treated surfaces towards the dehydrogenation of ethanol molecules, C-C bond cleavage, oxidation of COads, and consequently to complete
electro-oxidation of ethanol. The catalysts Pt-Rh/C TT were slightly affected by surface poisoning. Although they tolerated higher concentrations of ethanol where the higher current density was observed with ethanol 1.0 mol L-1.
Conclusions
Predominantly electronic effects of Rh on Pt on the electro-oxidation of CO and ethanol were observed on the prepared materials, due to the good dispersion of the metals on the support in micro and nanoscales with average particle sizes of the order of 3.2 nm. The normalization of the currents using the charge of oxidative desorption of CO allows to detect differences among the current levels generated exclusively by the electronic effects of Rh on Pt in the electrocatalysis of the reactions. The thermal treatments of the Pt-Rh catalysts in a hydrogen atmosphere showed greater stability of the elements and also notorious increases in the current levels. This suggests the necessity of more researches concerning the effects of thermal treatments in the electrocatalysis of the ethanol oxidation reaction.
Acknowledgements
To COLCIENCIAS (Colombia) Project 1106-521-28113, CAPES and FAPESP.
To Dr Oswaldo Morán from Universidad Nacional de Colombia (Medellín) for the composition measurements.
References
1. Lamy, C.; Belgsir, E. M.; Léger, J.-M.; J. Appl. Electrochem.
2001, 31, 799.
2. Lamy, C.; Lima, A.; LeRhun, V.; Delime, F.; Coutanceau, C.; Léger, J.-M.; J. Power Sources2002, 105, 283.
3. Gonzalez, E. R.; Antolini, E. In Encyclopedia of Electrochemical Power Sources; Garche, J., ed.; Elsevier: Amsterdam, Países
Bajos, 2009, vol. 2, pp. 402.
4. Kamarudin, M. Z. F.; Kamarudin, S. K.; Masdar, M. S.; Daud, W. R. W.; Int. J. Hydrogen Energy2013, 38, 9438.
Figure 8. Scan towards positive potential for the electro-oxidation of
ethanol. Scan rate: 10 mV s-1. Supporting electrolyte: 0.5 mol L-1 H 2SO4
T = 30 ºC: (a) 0.1 mol L-1 ethanol, as-prepared material; (b) 0.5 mol L-1
ethanol, as-prepared material; (c) 1.0 mol L-1 ethanol, as-prepared material;
(d) 0.1 mol L-1 ethanol, thermally treated material; (e) 0.5 mol L-1 ethanol,
5. Camara, G. A.; Iwasita, T.; J. Electroanal. Chem.2005, 578, 315.
6. Iwasita, T.; Pastor, E.; Electrochim. Acta1994, 39, 531. 7. Wang, H.; Jusys, Z.; Behm, R. J.; J. Phys. Chem. B2004, 108,
19413.
8. Léger, J.-M.; Rousseau, S.; Coutanceau, C.; Hahn, F.; Lamy, C.;
Electrochim. Acta2005, 50, 5118.
9. Pastor, E.; Iwasita, T.; Electrochim. Acta1994, 39, 547.
10. Shao, M. H.; Adzic, R. R.; Electrochim. Acta2005, 50, 2415. 11. Li, H.; Sun, G.; Cao, L.; Jiang, L.; Xin, Q.; Electrochim. Acta
2007, 52, 6622.
12. Colmati, F.; Antolini, E.; Gonzalez, E. R.; J. Alloys Compd.
2008, 456, 264.
13. Antolini, E.; Gonzalez, E. R.; J. Power Sources2010, 195, 3431.
14. Camara, G. A.; de Lima, R. B.; Iwasita, T.; J. Electroanal. Chem.
2005, 585, 128.
15. Schmidt, V. M.; Ianniello, R.; Pastor, E.; González, S.; J. Phys. Chem.1996, 100, 17901.
16. Ianniello, R.; Schmidt, V. M.; Rodríguez, J. L.; Pastor, E.;
J. Electroanal. Chem.1999, 471, 167.
17. Delime, F.; Léger, J.-M.; Lamy, C.; J. Appl. Electrochem.1999,
29, 1249.
18. Song, S. Q.; Zhou, W. J.; Zhou, Z. H.; Jiang, L. H.; Sun, G. Q.; Xin, Q.; Leontidis, V.; Kontou, S.; Tsiakaras, P.; Int. J. Hydrogen Energy2005, 30, 995.
19. Pacheco Santos, V.; Tremiliosi-Filho, G.; J. Electroanal. Chem.
2003, 554-555, 395.
20. Lamy, C.; Rousseau, S.; Belgsir, E. M.; Coutanceau, C.; Léger, J.-M.; Electrochim. Acta2004, 49, 3901.
21. Wang, Q.; Sun, G. Q.; Jiang, L. H.; Xin, Q.; Sun, S. G.; Jiang, Y. X.; Chen, S. P.; Jusys, Z.; Behm, R. J.; Phys. Chem. Chem. Phys.2007, 9, 2686.
22. De Souza, J. P. I.; Queiroz, S. L.; Bergamaski, K.; Gonzalez, E. R.; Nart, F. C.; J. Phys. Chem. B2002, 106, 9825.
23. Bergamaski, K.; Gomes, J. F.; Goi, B. E.; Nart, F. C.; Eclet. Quím.2003, 28, 87.
24. Bergamaski, K.; Gonzalez, E. R.; Nart, F. C.; Electrochim. Acta
2008, 53, 4396.
25. Lima, F. H. B.; Profeti, D.; Lizcano-Valbuena, W. H.; Ticianelli, E. A.; Gonzalez, E. R.; J. Electroanal. Chem.2008, 617, 121.
26. Li, M.; Zhou, W.; Marinkovic, N. S.; Sasaki, K.; Adzic, R. R.;
Electrochim. Acta2013, 104, 454.
27. Lima, F. H. B.; Gonzalez, E. R.; Electrochim. Acta2008, 53, 2963.
28. Lima, F. H. B.; Gonzalez, E. R.; Appl. Catal. B Environ.2008,
79, 341.
29. Jeon, M. K.; Lee, K. R.; Jeon, H. J.; Woo, S. I.; J. Appl. Electrochem.2009, 39, 1503.
30. Joo, J. B.; Kim, Y. J.; Kim, W.; Kim, P.; Yi, J.; J. Nanosci. Nanotechnol.2008, 8, 5130.
31. Thepkaew, J.; Therdthianwong, S.; Therdthianwong, A.; J. Appl. Electrochem.2011, 41, 435.
32. Lizcano-Valbuena, W. H.; de Souza, A.; Paganin, V. A.; Leite, C. A. P.; Galembeck, F.; Gonzalez, E. R.; Fuel Cells2002, 2, 3.
33. Lizcano-Valbuena, W. H.; Paganin, V. A.; Leite, C. A. P.; Galembeck, F.; Gonzalez, E. R.; Electrochim. Acta2003, 48,
3869.
34. Schmidt, T. J.; Gasteiger, H. A.; Stäb, G. D.; Urban, P. M.; Kolb, D. M.; Behm, R. J.; J. Electrochem. Soc.1998, 145, 2354. 35. Kowal, A.; Gojkovic, S. L.; Lee, K.-S.; Olszewski, P.; Sung,
Y.-E.; Electrochem. Commun.2009, 11, 724.
36. Choi, S. M.; Yoon, J. S.; Kim, H. J.; Nam, S. H.; Seo, M. H.; Kim, W. B.; Appl. Catal. A2009, 359, 136.
37. Kim, H. J.; Choi, S. M.; Nam, S. H.; Seo, M. H.; Kim, W. B.;
Appl. Catal. A2009, 352, 145.
38. Kim, Y. S.; Nam, S. H.; Shim, H.-S.; Ahn, H.-J.; Anand, M.; Kim, W. B.; Electrochem. Commun.2008, 10, 1016. 39. Wasberg, M.; Horányi, G.; J. Electroanal. Chem.1995, 386,
213.
40. Lyman, C. E.; Lakis, R. E.; Stenger Jr, H. G.; Ultramicroscopy
1995, 58, 25.
41. Rand, D. A. J.; Woods, R.; J. Electroanal. Chem.1972, 35, 209.
42. Baker, B. G.; Rand, D. A. J.; Woods, R.; J. Electroanal. Chem. Interfacial Electrochem. 1979, 97, 189.
43. Aston, M. K.; Rand, D. A. J.; Woods, R.; J. Electroanal. Chem.
1984, 163, 199.
44. Luo, H.; Park, S.; Chan, H. Y. H.; Weaver, M. J.; J. Phys. Chem. B2000, 104, 8250.
45. Rand, D. A. J.; Woods, R.; J. Electroanal. Chem.1972, 36, 57. 46. Łukaszewski, M.; Czerwinski, A.; J. Alloys Compd.2009, 473,
220.
47. Hammer, B.; Nørskov, J. K.; Surf. Sci.1995, 343, 211.
48. Hammer, B.; Nørskov, J. K.; Adv. Catal.2000, 45, 71. 49. Greeley, J.; Nørskov, J. K.; Mavrikakis, M.; Annu. Rev. Phys.
Chem.2002, 53, 319.
50. Li, X.; Qiu, X.; Yuan, H.; Chen, L.; Zhu, W.; J. Power Sources
2008, 184, 353.
51. Maillard, F.; Eikerling, M.; Cherstiouk, O. V; Schreier, S.; Savinova, E.; Stimming, U.; Faraday Disc. 2004, 125, 357. 52. Park, J. Y.; Zhang, Y.; Grass, M.; Zhang, T.; Somorjai, G. A.;
Nano Lett.2008, 8, 673.
53. Mukerjee, S.; McBreen, J.; J. Electroanal. Chem.1998, 448,
163.
54. Antonucci, P. L.; Alderucci, V.; Giordano, N.; Cocke, D. L.; Kim, H.; J. Appl. Electrochem.1994, 24, 58.
Submitted: January 4, 2014
Published online: May 27, 2014