www.solid-earth.net/5/1/2014/ doi:10.5194/se-5-1-2014
© Author(s) 2014. CC Attribution 3.0 License.
Solid Earth
Assessing accuracy of gas-driven permeability measurements: a
comparative study of diverse Hassler-cell and probe permeameter
devices
C. M. Filomena1,*, J. Hornung2, and H. Stollhofen1
1GeoZentrum Nordbayern, Friedrich-Alexander-Universität Erlangen-Nürnberg, Erlangen, Germany 2Institut für Angewandte Geowissenschaften, Technische Universität Darmstadt, Darmstadt, Germany *current address: Shell Global Solutions B.V., Rijswijk, the Netherlands
Correspondence to:C. M. Filomena ([email protected]) Received: 1 July 2013 – Published in Solid Earth Discuss.: 2 August 2013
Revised: 26 November 2013 – Accepted: 27 November 2013 – Published: 2 January 2014
Abstract.Permeability is one of the most important petro-physical parameters to describe the reservoir properties of sedimentary rocks, pertaining to problems in hydrology, geothermics, and hydrocarbon reservoir analysis. Outcrop analogue studies, well core measurements, and individual sample analysis take advantage of a variety of commercially available devices for permeability measurements. Very often, permeability data derived from different devices need to be merged within one study (e.g. outcrop minipermeametry and lab-based core plug measurements). To enhance accuracy of different gas-driven permeability measurements, device-specific aberrations need to be taken into account. The appli-cation of simple one-to-one correlations may draw the wrong picture of permeability trends. For this purpose, transform equations need to be established.
This study presents a detailed comparison of permeabil-ity data derived from a selection of commonly used Hassler cells and probe permeameters. As a result of individual cross-plots, typical aberrations and transform equations are elabo-rated, which enable corrections for the specific permeame-ters. Permeability measurements of the commercially avail-able ErgoTech gas permeameter and the TinyPerm II probe permeameter are well-comparable over the entire range of permeability, withR2=0.955. Aberrations are mostly iden-tified in the permeability range <10 mD, regarding the TinyPerm II and the minipermeameter/Hassler-cell combi-nation at Darmstadt University, which need to be corrected and standardized. Applying standardizations which consider these aberration intervals strongly improves the
comparabil-ity of permeabilcomparabil-ity data sets and facilitates the combination of measurement principles. Therefore, the utilization of such correlation tests is highly recommended for all kinds of reser-voir studies using integrated permeability databases.
1 Introduction
Petrophysical properties of sedimentary rocks are decisive parameters for the quantitative and qualitative evaluation of reservoir rocks. One of the most important measurement val-ues is permeability, describing the magnitude of fluid flow through porous media. Reliable permeability values are a prerequisite for the assessment and modelling of hydrocar-bon, carbon dioxide capture and storage, and geothermal reservoir rocks (Li et al., 1995; Branets et al., 2009; Dezayes et al., 2007; Grant and Bixley, 2011; Hurst, 1993; Laughlin, 1982) and their economic and sustainable production (Davies and Davies, 2001; Dutton et al., 1991). They are also crucial for hydrological studies (Huysmans et al., 2008; Todd and Mays, 2005; Al Ajmi et al., 2013) and underground waste disposal, including modelling of fluid flow and potential con-taminant spread.
the sample. A standard laboratory device for gas-driven permeability measurements is a Hassler cell (e.g. Thomas, 1972), allowing permeability measurements of entire core plug samples under steady-state gas flow. However, the reso-lution of permeability values measured (e.g. in a well core section) strongly depends on the plug core sampling rate (Goggin, 1993).
During the last decades, non-destructive and cost-efficient minipermeametry (or probe permeametry) has become an important analytic tool, providing fast and highly resolving permeability data for both laboratory and in situ outcrop ap-plications (Davis et al., 1994; Sharp Jr. et al., 1994; Gog-gin, 1988; Dutton and Willis, 1998; GogGog-gin, 1993; Dreyer et al., 1990; Chandler et al., 1989; Hornung and Aigner, 2002; Fossen et al., 2011; Rogiers et al., 2011; Iversen et al., 2003; Eijpe and Weber, 1971; Huysmans et al., 2008). Most probe permeameters apply a steady-state or unsteady-state gas injection (e.g. Hurst and Goggin, 1995) with gas flowing from the probe tip through the sample rock vol-ume. However, some devices also apply a vacuum, where the gas flows into the probe. Automated laboratory probe permeametry is commonly applied to core slab surfaces oriented perpendicular to sedimentary bedding, referred to as bedding-parallel permeability (Corbett and Jensen, 1992; Robertson and McPhee, 1990). The resulting permeability maps are further enrolled in rock property analysis and reser-voir characterization (Halvorsen and Hurst, 1990; Robertson and McPhee, 1990; Willis, 1998). Minipermeametry has the potential to resolve bedding-, deformation- and diagenesis-dependent permeability heterogeneities in stratified sedimen-tary rocks at centimetre-scale (e.g. Huysmans et al., 2008). However, minipermeameter and Hassler-cell-derived perme-ability data are not directly comparable with one another. Meyer and Krause (2001) document almost constantly higher probe-derived permeability values than those from Has-sler cell measurements. TinyPerm-derived permeabilities ob-tained from the the highly permeable Navajo Sandstone were found to be 1.8 times higher than plug-derived permeability values (Fossen et al., 2011; Torabi and Fossen, 2009). Suther-land et al. (1993) discuss not only the advantages but also limitations of probe permeametry, emphasizing the need of standardized experimental conditions.
The combination of permeability data obtained from dif-ferent approaches (e.g. from a probe permeameter and a Has-sler cell) within one study therefore needs to be treated with caution. Here, it is of crucial importance to be aware of the scaling of rock heterogeneities and possible discrepancies between the measuring results. In this study, four air-driven permeameters are tested for comparability among each other. In order to assess the accuracy of different Hassler cell and miniperm devices, similarities as well as potential discrep-ancies are evaluated. Ultimately, research studies integrating different permeameter devices (e.g. for field and laboratory analysis) shall benefit from a much higher accuracy by
ap-plying transfer functions for a standardization of permeame-ter measurements.
2 Samples, methods, and specifications 2.1 Sample material
For this study we used 51 cylindrical and bedding-parallel sandstone sample plugs of a standardized 1-inch (2.54 cm) diameter and 5 cm length. Prior to permeability measure-ments the sample plugs were oven-dried at 60◦
C for 3 days, until a constant weight was reached. Permeability measure-ments were performed along the long axis of the core plugs to exclude orientation-related anisotropy effects. The data set presented here (Table 1) covers a permeability range over six orders of magnitude, from 10−2 to 103mD. Samples with low and moderate permeabilities of 0.02 to 300 mD are derived from fluvial channel sandstones of the Triassic Buntsandstein (sample numbers 1–13 and 43–48) and Keu-per (sample numbers 14–38) of southern Germany. Highly permeable samples (600 to>2700 mD) have been selected from two reservoir rocks: the Lower Cretaceous shallow ma-rine Bentheim sandstone (sample numbers 40–42), which forms the host rock of a hydrocarbon reservoir in north-west Germany and the Netherlands (cf. Roll, 1972); and the Late Ordovician shallow marine Dibsiyah Formation (sam-ple number 39) of the Wajid Group in the Kingdom of Saudi Arabia (Kellogg et al., 1986; Al Ajmi et al., 2013), which is part of a regional mega-aquifer system (GTZ-DCO, 2007). The three Buntsandstein samples 49–51 also exhibit high permeabilities of 800–1800 mD.
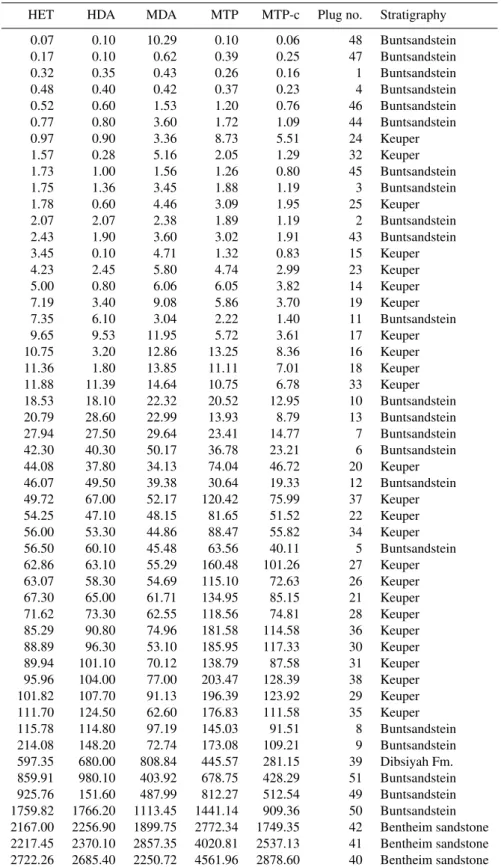
Table 1.Permeability data set of 51 sandstone sample plugs, measured with four different devices: the Hassler cells of the ErgoTech gas per-meameter (HET) and the gas perper-meameter in Darmstadt (HDA), and the miniperper-meameters New England Research TinyPerm II (MTP) and Miniperm Darmstadt (MDA). According to Table 2, MTP permeabilities have additionally been corrected for unconfined sample geometries (MTP-c). Permeability values are given in mD.
HET HDA MDA MTP MTP-c Plug no. Stratigraphy
2.2 Methods and devices
Four gas-driven permeameter devices using three different concepts for permeability determination have been compared within this study:
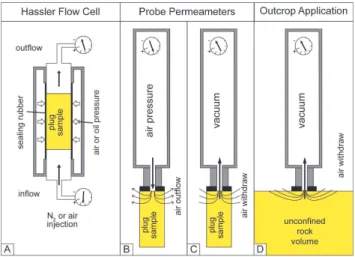
(I) two Hassler cells (Fig. 1a),
(II) a minipermeameter (or probe permeameter) using air injection (Fig. 1b),
(III) a vacuum probe permeameter (Fig. 1c).
2.2.1 Hassler cells
Darcy’s law describes the horizontal, laminar flow of a fluid under steady-state conditions in porous media with the known length and area of the sample. The permeability (K) according to Darcy’s law (Darcy, 1856) is given by
K=QηL/A1P , (1)
with
– K: permeability of the medium in m2 or mD, 1 mD = 9.86923×10⁻¹⁶m2,
– Q: flow rate, discharge volume per second in m2s−1,
– η: viscosity of the fluid in Pa×s,
– L: length of the sample in m,
– A: the cross-sectional area of the sample in m2,
– 1P: pressure difference between injection and outflow in Pa.
Gas slippage at low pressures or high-velocity flow effects, such as turbulence, however, are neglected by this equa-tion. Devices facilitating different pressure stages allow the Klinkenberg correction (Klinkenberg, 1941) and determina-tion of an intrinsic permeability. A minimum of three (bet-ter five) subsequent measurements at equal flow rates but at different back-pressure steps and resulting differential pres-sures can be performed with Hassler cell devices. They are designed for uni-variant sample geometries, allowing a vari-able core plug length but demanding a constant sample diam-eter. Permeability measurements can only be applied in the long-axis direction of the sample plug. Therefore, the sam-ple orientation is of basic importance, especially in hetero-geneous rocks, where reservoir qualities are constrained by those sections with the lowest permeability.
The ErgoTech digital steady-state gas permeameter (Hassler-cell ErgoTech = HET) at the Geological Institute of RWTH Aachen University is a laboratory-based instru-ment with an attached quick-action Hassler cell, hosting stan-dard rock plugs of 1-inch (2.54 cm) diameter and a length of 7.6 cm maximum. The sample is sealed by a rubber sleeve
Fig. 1.Principles of permeability measurements on plug samples:
(A)Hassler cell,(B)minipermeameter using air injection, and(C)
minipermeameter applying a vacuum. Note the difference in rock volume and flow trajectories in(A),(B),(C). Likewise, the differ-ence in rock volume needs to be taken into account when conduct-ing outcrop measurements = unconfined rock volume(D).
under a confining oil pressure of 50 bar. The operating gas temperature is measured with 0.1◦C accuracy. The HET is equipped with three mass flow meters of 20, 200, and 2000 cm3min−1maximum. The applied back-pressure steps in the HET comprise measurement against atmospheric pres-sure, 20, 25, 30, and 35 psi, resulting in a measuring range of 0.01 mD to 10 D.
The gas permeameter at the Institute of Applied Geology at the Technical University of Darmstadt combines a Hassler cell (Hassler-cellDarmstadt = HDA) with a minipermeame-ter (MDA) in one device. The HDA can be operated with Hassler cells of different diameters at a sealing air pressure of 10 bar and with freely selectable back-pressure steps up to 6 bar. Flow rates are sensitive from 0.001 cm3min−1up to 2000 cm3min−1, allowing the measurement of a 1 µD to 6 D permeability range at 2.5 cm plug diameter. Measuring time for medium to highly permeable samples is roughly 5 to 10 min. This device can also be used to determine per-meability for different fluids and automatically corrects for viscosity and temperature effects.
2.2.2 Probe permeameter gas-flow geometry in rock samples
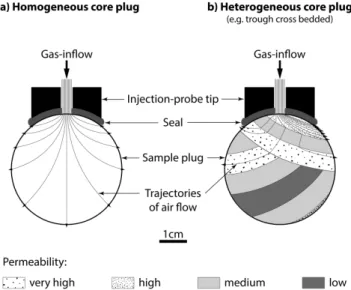
For all kinds of minipermeameter devices, the knowledge about gas-flow geometry is crucial in order to get area (A) and length (L) parameters as input for the Darcy equation (Eq. 1). However, quantifying these parameters represents a major problem as flow trajectories are not parallel, not equally spaced, and not of the same length (Fig. 2a). For absolutely homogenous and anisotropic samples, a so-called geometric factor (L/A) can be modelled and calculated even for different sample geometries to replace the length (L) and area (A) parameters of the Darcy equation (Eq. 1). In geo-science practice, natural samples are investigated which can almost never be considered as isotropic, nor homogenous due to depositional and diagenetic effects. Therefore, a signifi-cantly better accuracy of the results can be achieved when a calculated geometric factor is replaced by an empirical fac-tor, closely adapted to a certain rock type (Fig. 2b). Hence, we recommend measuring a set of samples with both devices: the Hassler cell permeameter and in the same direction (plug faces) with a minipermeameter. From this data set an empiri-cal geometry factor can be determined by balancing averaged minipermeameter values of both plug faces with Hassler cell measures. This set of test samples should cover the whole range of permeabilities of a rock type. Rock types should be chosen so as to represent all types of potential controls affect-ing pore space geometry and sample architecture (e.g. lithol-ogy, detrital grain composition, degree and type of cemen-tation, and sedimentary fabrics). To keep it simple even for non-geologists, such a suite of rock types could be for exam-ple limestone with different visible sedimentary structures, homogenous limestone, and groups of diagenetically over-printed limestone showing leaching, microkarst, fracturing, or patchy cementations. Similarly, such test sets should be established for sandstones.
To be close to the common practice as recommended above, in this study the geometric factor for the MDA was not established at the used 51 samples. On purpose, a com-parable, previous test set for moderately permeable, homoge-nous sandstones was used, and an overall geometric factor for the MDA was determined (0.15 m−1). Using the same 51 samples as a test set, the results would show much bet-ter matching, which is not realistic for common practice. As the geometric factor (A/L) represents a linear relationship in the Darcy equation (see Eq. 1), an error in determination will affect the matching of minipermeameters to Hassler cells in the same range.
2.2.3 Mini permeameters
The minipermeameters (or probe permeameters) have been applied attached to the end faces of the core plug samples, providing bedding-parallel permeability data of the core plug long-axis directions. These measurements can then be
di-Fig. 2. Gas-flow trajectories for (a) homogeneous samples and
(b)for heterogeneous samples (e.g. comprising depositional or dia-genetic anisotropies). Such structures strongly affect flow geometry by inducing preferential flow, which creates serious issues in deter-mining flow length and area for permeability measurements.
rectly compared to Hassler-cell-derived permeability mea-surements. Minipermeameter measurements are governed by seal tightness which is strongly influenced by seal surface pressure, the angle of the probe tip with the sample surface and the roughness of the sample surface. Potential leakage has a large influence on the measuring results. The seal tight-ness of these devices is achieved by a tight contact between nozzle, sealing rubber, and sample surface, and can be fur-ther improved by a ring of putty. For a better comparison of applied probe tip seals, Goggin et al. (1988) use the di-mensionless probe-tip seal size defined asbD= (external seal radius) / (internal seal radius). A minimum size ofbD=1.5 is recommended by Suboor and Heller (1995), whilst Meyer and Krause (2001) apply abDof 2.19.
Minipermeameter Darmstadt
permeability range is almost identical to that of the HDA de-vice. A single measurement takes roughly 30 s for medium to highly permeable samples, and for a complete 3-D survey 12 single measurements are recommended.
The same sensors as in Hassler-cell operation mode are used, but as it releases gas into the atmosphere, no back pres-sure can be applied and all parameters have to be meapres-sured in the upstream branch of the device. Parameter corrections are applied identically to the Hassler-cell operation mode. To test leakages of the tip seal or in the device, samples which are considered to have no permeability are measured. In this case, an alloy plug in the same dimensions as a core plug was used. The results were below the sensitivity of the sensors, so we assume a complete technical tightness. We recommend such a test for any other device.
TinyPerm II probe permeameter
The minipermeameter “TinyPerm II” (Miniperm Tiny
Perm = MTP) of New England Research Inc. was applied at the GeoZentrum Nordbayern, University of Erlangen-Nürnberg. It is a portable handheld air permeameter (Fig. 1c) which can be used in the laboratory or in the field directly on the surface of sample plugs, well cores, hand specimens, and plane, cleaned outcrop walls. The MTP probe tip consists of a 22 mm-sized rubber nozzle with an inlet diameter of 9 mm. To prevent leakage between probe tip and sample surface, the nozzle was additionally equipped with an impermeable ex-panded rubber ring of 9 mm inner diameter (inlet) and 27 mm outer diameter, providing a 9 mm-thick seal around the in-let. The application of this additional seal is highly recom-mended to optimize MTP measurements. As the expanded rubber is very flexible, it tightens the surface roughness of the sample, which prevents leaking and forces the air to tres-pass only the rock sample. Here, the probe-tip seal sizebD according to Goggin et al. (1988) isbD=3.0. To provide reproducible testing conditions and a uniform contact pres-sure during operation, the MTP device was mounted in an upright static position. The probe nozzle is pressed against the rock sample, and subsequently a vacuum is generated in the inner part of the instrument. According to the manufac-turer (New England Research Inc.), a microcontroller moni-tors the volume of withdrawn air from the rock and the tran-sient vacuum. After the vacuum is dissipated, the microcon-troller computes a characteristic value according to the mea-sured parameters. This TinyPerm II value (T) is provided af-ter the measurement of one sample and is linked to air per-meability (K) through Eq. (2) (according to the TinyPerm II operational manual):
T = −0.8206 log10(K)+12.8737, (2) whereKis the permeability in millidarcys (mD).
This equation needs to be applied to all values provided by the MTP device after the measurement of one sample, to calculate the correct permeability in millidarcys. Empirical
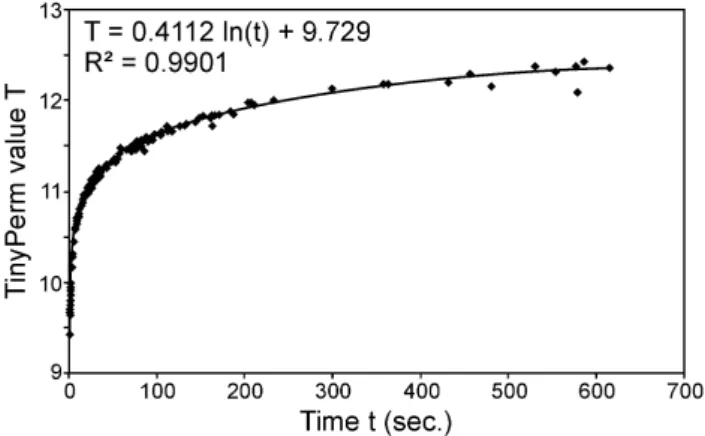
Fig. 3.Cross-plot of TinyPerm II value (T) with needed measuring time (t) in seconds. Note the asymptotic behaviour of the regression line with increasing measuring time.
experiments show that the valueT also correlates with mea-suring time (Fig. 3).
The technical tightness of the MTP device was then tested with a perfectly flat and polished solid aluminium block, sim-ulating a non-permeable sample. In the ideal case, the vac-uum should not dissipate when impermeable materials are measured. Over a measuring period of 4 h, the device in-dicates a slow decay of the vacuum. The extrapolation of this decay delivers a time span of 10 h and 9 min for the en-tire dissipation of the vacuum. Applying the correlation of measuring time versus TinyPerm value (Fig. 3), a measur-ing time of 10 h and 9 min providesT =14.08, which equals an apparent permeability of the solid aluminium block of 0.034 mD (calculated using Eq. 2). This technical tightness defines the lower measuring boundary of the TinyPerm II, limited to 0.034 mD. Since the TinyPerm II device was orig-inally designed for a handheld field application, the manu-facturer indicates a lower measuring boundary of approxi-mately 10 mD, which is equivalent to a measuring time of about 5 min (Fig. 3). Longer measuring times and thereby lower permeabilities may only be realized in the laboratory where the device can be mounted on a static rack.
Table 2.Comparison of TinyPerm measurements (MTP) from four “unconfined” rock blocks (10×10×10 cm) and the corresponding 1-inch sample plugs, representing permeability orders of 100, 101, 102, and 103mD. Measured permeabilities are 34–41 % lower on unconfined samples than on plug samples (mean:−36.9 %).
Block Plug Block (MTP) (MTP) vs. plug
Buntsandstein 4.6 7.2 −36 % Buntsandstein 803.2 1369 −41 % Keuper 60.8 92.6 −34 % Bentheim sandstone. 1285 1999 −36 % Mean −36.9 %
with an average of∼37 % (Table 2). The effect of shorter flow trajectories and apparent higher permeabilities in plug samples can be corrected by reducing MTP plug measure-ments by 37 %. We use this corrected TinyPerm permeability (MTP-c) to compare TinyPerm plug sample with Hassler cell measurements properly.
3 Comparison of Hassler cell and minipermeameter measurements
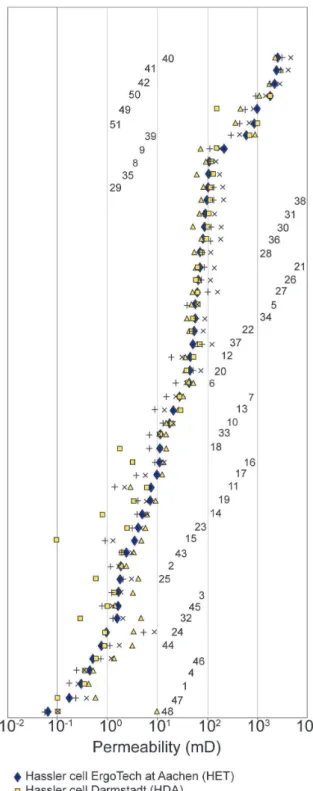
When permeability measurements from different Hassler cells, different minipermeameters or a mixture of Hassler cell and minipermeameter measurements are integrated in one study, system-immanent discrepancies between the ap-plied devices should be taken into account and, where neces-sary, should be corrected. Therefore, transform equations for the used devices need to be determined and applied for com-parison. All permeability measurements conducted with the four devices used in this study are listed in Table 1 and plot-ted in Fig. 4. The results are then cross-plotplot-ted to visualize the correlation of the different permeability devices and, if necessary, to receive transform equations for correction and standardization (Figs. 5 and 6).
3.1 General trends of measuring results
The permeabilities of all 51 core plug samples have been measured with each of the four permeameter devices and are plotted in Fig. 4 for comparison. General permeabil-ity trends and magnitudes, and the aberrations of the re-spective permeability devices are discussed. The most eye-catching aberrations are shown by uncorrected TinyPerm II measurements (MTP), which in the majority of cases deter-mine higher permeabilities than all other devices. Markedly higher values are recorded in 47 % (24 samples), similar val-ues in 37 % (19 samples), and slightly lower valval-ues in 18 % (9 samples) of the cases. TinyPerm measurements have then been corrected for unconfined rock volumes as discussed in Sect. 2.2.3 and presented in Tables 1 and 2. The Hassler cell in Darmstadt (HDA) shows pronounced lower permeabilities
Fig. 5. Comparison of different gas permeameters:(A)the Has-sler cell devices ErgoTech gas permeameter (HET) versus the gas permeameter in Darmstadt (HDA), and(B)the minipermeameters Miniperm Darmstadt (MDA) versus TinyPerm II (MTP). The MTP values are corrected by−37 % (MTP-c) to compensate for reduced flow trajectories. The bisectrix (x=y) indicates positive or negative aberrations of the measuring results, and the dashed line indicates the regression line of the resulting transform equations for standard-ization. Note the bi-logarithmic scales.
mostly limited to permeabilities of<10 mD. Obviously most aberrations, positive and negative, range on the same order of magnitude like the respective measuring results of the other devices.
3.2 Individual comparison of permeability devices
The combination of permeability values obtained from dif-ferent approaches requires a profound understanding of po-tential discrepancies between the applied devices. The in-dividual measurement results of all four permeameters are cross-plotted against each other (Figs. 5 and 6) to obtain par-ticular information on their systematic similarities and dis-crepancies.
3.2.1 Hassler cell measurements: HET versus HDA
The Hassler cells (HET and HDA) generate well-correlated measuring results, with a coefficient of determination of R2= 0.959 (Fig. 5a). Most of the presented Hassler cell mea-surements are almost identical or very close to each other (36 samples = 71 %), plotting near the bisectrix (solid line). In most cases, a one-to-one correlation between the two Hassler cells applies very well. However, major deviations have been observed in the measuring interval between 1 and 10 mD. Here, the HDA shows markedly lower values than the HET. The permeability values of seven samples deviate as much as one order of magnitude. Minor aberrations are within the same order of magnitude.
3.2.2 Minipermeameters: MDA versus MTP-c
The MDA vs. MTP-c cross-plot (Fig. 5b) indicates major aberrations of the two minipermeameter devices from each other. In the lower permeability range (<40 mD), a
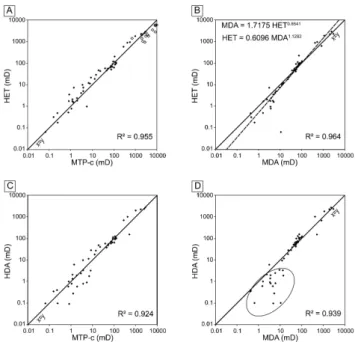
promi-Fig. 6.Comparison of Hassler cell versus minipermeameter mea-surements: ErgoTech gas permeameter (HET) versus TinyPerm II (MTP)(A)and Miniperm Darmstadt (MDA)(B), and the gas per-meameter in Darmstadt (HDA) versus TinyPerm II (MTP)(C)and Miniperm Darmstadt (MDA)(D). The MTP values are corrected by
−37 % (MTP-c) to compensate for reduced flow trajectories. The bisectrix (x=y) indicates positive or negative aberrations of the measuring results, and the dashed line indicates the regression line of the resulting transform equations for standardization. Note the bi-logarithmic scales. Outcrop and Hassler cell data from Fossen et al. (2011) are additionally shown in(A)(open diamonds, unmodi-fied MTP values).
nent offset identifies systematically higher MDA values, ap-proximately 2.4 times higher than TinyPerm measurements. However, at permeability values>40 mD, MTP-c and MDA values are almost identical. A partial regression line can be drawn separately for the lower section (<40 mD) to correct MDA for MTP-c values, and vice versa. In both cases, the coefficient of determinationR2of MDA versus MTP is very good, with 0.968 for the permeability range <40 mD and 0.972 for>40 mD.
3.2.3 Hassler cell versus minipermeameter measurements
to the bisectrix (Fig. 6a, solid diamonds), showing a close match of these two permeameters. However, between 1 and 40 mD, rock-volume-corrected MTP measurements tend to be slightly lower than HET data. TinyPerm outcrop and Hassler cell data with permeabilities>1 D from Fossen et al. (2011) are plotted for comparison (Fig. 6a, open dia-monds).
The MDA minipermeameter and the HET Hassler cell ex-hibit some minor aberrations (Fig. 6b). There, the best-fit line is rotated anticlockwise compared to the bisectrix. Be-low∼40 mD, the MDA indicates higher permeabilities than the HET device. At∼40 mD however, a turn-around point occurs, above which the MDA tends to deliver mostly lower permeability values than the HET.
Cross-plots of the Darmstadt Hassler cell (HDA) with the two minipermeameters indicate high correlation at perme-ability magnitudes >101mD (R2= 0.924 and 0.939), but they show deviations at the permeability range <10 mD (Fig. 6c and d). These aberrations are only minor in the HDA vs. MTP-c cross-plot (Fig. 6c) and are much more pro-nounced in the HDA–MDA cross-plot (Fig. 6d). However, this pronounced deviation may be the combined effect of a slight underestimation of permeability by the HDA device and an overestimation by the MDA minipermeameter at the same time (as documented in Fig. 6b).
3.3 Discussion of measuring results
To enhance accuracy of different gas-driven permeability measurements, device-specific aberrations have been docu-mented from Hassler cell and minipermeameter measure-ments. Permeability over- and underestimations either by minipermeameters or Hassler cells may result from variable factors.
Sealing quality and surface roughness play an important role in leak tightness of minipermeameters. Here, permeabil-ity overestimations of minipermeameter devices (Figs. 4 and 6a–d) may be attributed to suboptimal probe tip sealing, es-pecially when sample surfaces are very rough (e.g. coarse-grained sandstones or irregular (non-sawed) surfaces). Due to shorter flow trajectories and a reduced rock volume, the TinyPerm II device largely overestimates plug sample per-meabilities. Therefore it is proposed correcting them for un-confined rock volumes.
Permeability underestimations, however, require other ex-planations. Covering only a very limited surface, miniper-meameter measurements are susceptible to even small-scale rock heterogeneities. For instance, individual, stronger ce-mented parts may deliver lower permeabilities in punctual minipermeameter measurements. On the other hand, prefer-ential flow in Hassler-cell devices mainly contributes to the overall permeability of the sample, whereas punctual prefer-ential flow in minipermeametry just contributes as only one higher value among many lower (= “normal”) ones; there-fore the preferential flow is underrated when multiple
mea-surements are used to average a sample (e.g. MTP, MDA). A technical explanation for underestimation of minipermeame-ter versus Hassler recordings could be that a strong contact pressure of the minipermeameter probe may slightly force the sealing rubber towards the inner part of the probe tip. This would also narrow the inflow/outflow tube diameter to a certain degree. The effect of a reduced in- or outflow di-ameter then results in an apparent lower permeability. These two reasons may explain the documented underestimations of minipermeameter measurements compared to the Hassler cell devices.
Hassler cell measurements provide a permeability value which is integrated over a given rock volume. Individual and spatially limited sections of enhanced cementation within this rock volume affect bulk permeability only little, whereas they have a much more pronounced effect on point measure-ments (Fig. 2b). Cross-plots further indicate that the HDA Hassler cell tends to provide slightly lower permeability at a permeability range of<10 mD compared to the other de-vices (Figs. 5a, 6c, 6d). This is due to the technical speci-fications of all kinds of ultra-low range gas-flow meters. In general they show a much higher pressure drop compared to mid- or high range sensors, which changes flow conditions in the sample.
For better comparison and for merging permeability data sets which have been generated with different devices, meability measurements need to be standardized for one per-meameter type. The presented cross-plots show that perme-ability measurements from different devices correlate very well, with coefficients of determination (R2) between 0.924 and 0.972. Frequently, they are in good accordance with the bisectrix, indicating that the plotted data sets can roughly be correlated one to one. However, the good correlation is not equally distributed across the entire range of permeabilities. These aberrations need to be considered when data sets gen-erated by variable measurement devices shall be merged.
One-to-one correlations can generally be applied for rock-volume-corrected TinyPerm II (MTP-c) and ErgoTech Has-sler cell (HET) measurements (see Fig. 6a). However, MTP-c values seem to be systematically lower between 1 and 40 mD. The additionally plotted data points of Fossen et al. (2011) indicate significantly higher TinyPerm values at the perme-ability range >1 D. The explanation might be the effect of differently applied sealing rubber sizes, a lower contact pressure during outcrop measurement, or the higher surface roughness of natural outcrops compared to sawed rock sam-ples.
The standardization of MDA minipermeameter and HET Hassler cell measurements requires a correction across the entire range of permeabilities, applying the respective trans-form equations outlined in Fig. 6b. The standardization of MDA measurements for HET permeability follows the trans-form equation HET = 0.6096 MDA1.1282, where “MDA” de-scribes the permeability measured with the MDA device. As a result, the corresponding HET permeability is obtained. Due to the rotation of the best-fit line (Fig. 6b), this transform becomes more effective in very low permeability classes <1 mD or at high permeabilities >1000 mD, and can be largely neglected at a range of 10–100 mD.
In studies where the two minipermeameters MTP and MDA are applied, minor corrections are necessary to stan-dardize for one device. The cross-plot (Fig. 5b) illustrates a very good correlation, but at permeabilities<40 mD the MTP versus MDA permeability measurements are displaced parallel to the bisectrix towards higher MDA values. There-fore, two different transforms need to be applied for stan-dardization of MTP or MDA measurements (Fig. 5b).
All presented cross-plots demonstrate that it is of crucial importance to document major aberrations prior to the use of different permeameters within one study. A general rule for how a specific device will compare to others cannot be established and has to be defined by empirical measurements. The technique to establish empirical equations to make permeability comparable among different devices can also be used to compare gas permeability to water-derived per-meabilities. Examples are given in Jaritz (1999) and Al Ajmi et al. (2013). As a common result intrinsic gas permeabilities are found to be 50 % higher than water permeabilities. As an explanation gas-slippage effects at the rock interface were made responsible.
4 Conclusions
Permeability data of reservoir rocks mainly derive from core plug measurements using Hassler cell devices. On the other hand, probe permeameters have the advantage of provid-ing closely spaced, non-destructive permeability data, which are mostly suitable to gain 3-D permeability, estimates of anisotropy effects, and heterogeneity.
In studies where both techniques are applied, it is of paramount importance to guarantee comparability of the ob-tained data sets. This is particularly important if permeame-ters designed for outcrop application, like the TinyPerm II device, shall be used for laboratory plug measurements. In this case, unconfined samples show on average 37 % lower permeabilities than plug samples.
Permeability measurements derived from four different Hassler cell and minipermeameter devices have been com-pared to document their correlation. As a result of perme-ability cross-plots, device-typical aberrations and transform equations are elaborated, which enable corrections for
spe-cific Hassler cell or probe permeameter data. The application of simple one-to-one correlations is highly critical, as aber-rations and trends may occur across the entire range of per-meabilities or may only be confined to certain permeability intervals.
Only in some cases, one-to-one correlations between dif-ferent permeameters can be applied to the entire range of permeability. Here, the Hassler cell of the ErgoTech gas per-meameter (HET) and the rock-volume-corrected values of the TinyPerm II minipermeameter (MTP-c) show the closest match (R2= 0.955). The combination and standardization of permeability data derived from other devices, however, re-quires various corrections.
With this study we demonstrate that variable device-specific aberrations exist between different permeameter types, and we show a methodology to integrate miniperme-ameter data better with the commonly more widely spaced and more interpolative core plug permeability derived from Hassler cell measurements. Hence, it is possible to benefit from the advantages of both concepts.
Acknowledgements. Peter Kukla is highly appreciated for
provid-ing access to the ErgoTech gas permeameter of the Geological Institute of RWTH Aachen University, Germany. We are grateful for the constructive comments of H. Fossen and a second, anony-mous reviewer, which substantially improved an earlier version of this manuscript.
Edited by: P. Papale
References
Al Ajmi, H., Hinderer, M., Hornung, J., Bassis, A., Keller, M., Rausch, R., and Schüth, C.: Matrix versus fracture permeabil-ity in a regional sandstone aquifer (Wajid sandstone, SW Saudi Arabia), Grundwasser, in press, 2013.
Branets, L. V., Ghai, S. S., Lyons, S. L., and Wu, X.-H.: Chal-lenges and technologies in reservoir modeling, Commun. Com-put. Phys., 6, 1–23, 2009.
Chandler, M. A., Goggin, D. J., and Lake, L. W.: A mechanical field permeameter for making rapid, non-destructive, permeabil-ity measurements, J. Sediment. Petrol., 59, 613–615, 1989. Corbett, P. W. M. and Jensen, J. L.: Variation of reservoir statistics
according to sample spacing and measurement type for some in-tervals in the lower Brent Group, Log Analyst, 33, 22–41, 1992. Darcy, H.: Les fontaines publiques de la ville Dijon, Dalmont, Paris,
674 pp., 1856.
Davies, J. P. and Davies, D. K.: Stress-dependent permeability: characterization and modeling, SPE J., 6, 224–235, 2001. Davis, J. M., Wilson, J. L., and Phillips, F. M.: A portable
air-minipermeameter for rapid in situ field measurements, Ground Water, 32, 258–266, 1994.
Dreyer, T., Scheie, A., and Jensen, J. L.: Minipermeameter-based study of permeability trends in channel sand bodies, AAPG Bul-let., 74, 359–374, 1990.
Dutton, S. P. and Willis, B. J.: Comparison of outcrop and subsur-face sandstone permeability distribution, Lower Creataceous Fall River Formation, South Dakota and Wyoming, J. Sediment. Res., 68, 890–900, 1998.
Dutton, S. P., Laubach, S. E., and Tye, R. S.: Depositional, dia-genetic, and structural controls on reservoir properties of low-permeability sandstone, Travis Peak Formation, East Texas, Gulf Coast Assoc. Geol. Soc. T., 41, 209–220, 1991.
Eijpe, R. and Weber, K. J.: Mini-permeameters for consolidated rock and unconsolidated sand, AAPG Bullet., 55, 307–309, 1971.
Fossen, H., Schultz, R. A., and Torabi, A.: Conditions and impli-cations for compaction band formation in the Navajo Sandstone, Utah, J. Structur. Geol., 33, 1477–1490, 2011.
Goggin, D. J.: Geologically sensible modeling of the spatial distri-bution of permeability in eolian deposits: Page Sandstone (Juras-sic), northern Arizona, PhD, The University of Texas at Austin, 417 pp., 1988.
Goggin, D. J.: Probe permeametry: is it worth the effort?, Mar. Petrol. Geol., 10, 299–308, 1993.
Goggin, D. J., Thrasher, R. L., and Lake, L. W.: A theoretical and experimental analysis of minipermeameter response including gas slippage and high velocity flow effects, In Situ, 12, 79–116, 1988.
Grant, M. A. and Bixley, P. F.: Geothermal reservoir engineering, 2nd Edn., Academic Press Elsevier Burlington, USA, 2011. Halvorsen, C. and Hurst, A.: Principles, practice, and applications
of laboratory minipermeametry, in: Advances in core evaluation: accuracy and precision in reserves estimation, edited by: Wor-thington, P. F., Gordon and Breach, London, 521–549, 1990. Hornung, J. and Aigner, T.: Reservoir architecture in a terminal
al-luvial plain: an outcrop analogue study (Upper Triassic, South-ern Germany). Part 1: Sedimentology and petrophysics, J. Petrol. Geol., 2, 3–30, 2002.
Hurst, A.: Sedimentary flow units in hydrocarbon reservoirs: some shortcomings and a case for high-resolution permeability data, in: The geological modelling of hydrocarbon reservoirs and out-crop analogues, edited by: Flint, S. S. and Bryant, I. D., Spe-cial Publications International Association of Sedimentologists, Blackwell Scientific Publications, 191–204, 1993.
Hurst, A. and Goggin, D. J.: Probe permeametry: An overview and bibliography, AAPG Bullet., 79, 463–473, 1995.
Huysmans, M., Peetersa, L., Moermansa, G., and Dassarguesa, A.: Relating small-scale sedimentary structures and permeability in a cross-bedded aquifer, J. Hydrol., 361, 41–51, 2008.
Iversen, B. V., Moldrup, P., Schjonning, P., and Jacobsen, O. H.: Field application of a portable air permeameter to characterize spatial variability in air and water permeability, Vadose Zone J., 2, 618–626, 2003.
Jaritz, R.: Quantifizierung der Heterogenität einer Sandstein-matrix (Mittlerer Keuper, Württemberg), Tübinger Geowis-senschaftliche Arbeiten (TGA), C48, 1–106, 1999.
Kellogg, K., Janjou, D., Minoux, L., and Fourniguet, J.: Explana-tory Notes to the Geologic Map of the Wadi Tathlith Quadrangle, Sheet 20 G, Kingdom of Saudi Arabia, Ministry of Petroleum and Mineral Ressources, Deputy Ministry of Mineral Resources, 27 pp., 1986.
Klinkenberg, L. J.: The permeability of porous media to liquids and gases, in: API Drilling and Production Practice, American Petroleum Institute, New York, 200–213, 1941.
Laughlin, A. W.: Exploration for geothermal energy, in: Handbook of geothermal energy, edited by: Edwards, L. M., Chilingar, G. V., Rieke, H. H., and Fertl, W. H., Gulf Publishing company, Houston, 1982.
Li, D., Cullick, A. S., and Lake, L. W.: Global scale-up of reser-voir model permeability with local grid refinement, J. Petrol. Sci. Eng., 14, 1–13, 1995.
Meyer, R. and Krause, F. F.: A comparison of plug-derived and probe-derived permeability in cross-bedded sandstones of the Virgelle Member, Alberta, Canada: The influence of flow direc-tions on probe permeametry, AAPG Bullet., 85, 477–489, 2001. Robertson, G. M. and McPhee, C. A.: High-resolution probe per-meability: an aid to reservoir description, in: Advances in core evaluation, volume 1: accuracy and precision in reserves estima-tion, edited by: Worthington, P. F., Gordon and Breach, London, 495–520, 1990.
Rogiers, B., Beerten, K., Smeekens, T., and Mallants, D.: Air per-meability measurements on Neogene and Quaternary sediments from the Campine area: using outcrop analogues for determin-ing hydrodynamic aquifer properties, Belgian Nuclear Research Center, Mol, BelgiumExternal Report SCKCEN-ER-177, 2011. Roll, A.: Bramberge Field, Federal Republik of Germany: Case
His-tories, in: Stratigraphic oil and gas fields – Classification, Ex-ploration Methods, and Case Histories, AAPG Special Volumes, 286–296, 1972.
Sharp Jr., J. M., Fu, L., Cortez, P., and Wheeler, E.: An electronic minipermeameter for use in the field and laboratory, Ground Wa-ter, 32, 41–46, 1994.
Suboor, M. A. and Heller, J. P.: Minipermeameter characteristics critical to its use, In Situ, 19, 225–248, 1995.
Sutherland, W. J., Halvorsen, C., Hurst, A., McPhee, C. A., Robert-son, G., Whattler, P. R., and Worthington, P. F.: Recommended practice for probe permeametry, Mar. Petrol. Geol., 10, 309–317, 1993.
Thomas, R. D.: Effect of overburden pressure and water saturation on gas permeability of tight sandstone cores, J. Petrol. Technol., 24, 120–124, 1972.
Todd, D. K. and Mays, L. W.: Groundwater Hydrology, 3rd Edn., Wiley, Hoboken, USA, 636 pp., 2005.
Torabi, A. and Fossen, H.: Spatial variation of microstructure and petrophysical properties along deformation bands in reservoir sandstones, AAPG Bullet., 93, 919–938, 2009.