Inluence of the column rectangularity index and of
the boundary conditions in the punching resistance
of slab-column connections
Inluência do índice de retangularidade dos pilares e
das condições de contorno na resistência à punção
de ligações laje-pilar
a Universidade Federal do Pará, Belém, Pará, Brasil. b CAMTUC, Universidade Federal do Pará, Belém, Pará, Brasil.
Received: 03 Jun 2014 • Accepted: 12 Dec 2015 • Available Online: 12 Jun 2015
Abstract
Resumo
Experimental evidence indicates that both the column rectangularity index and the boundary conditions of the connection may affect the ultimate punching resistance. This paper presents general aspects of these topics and, through the analysis of experimental results of tests on 131 slabs, evaluates the accuracy and suitability of recommendations presented by ABNT NBR 6118, Eurocode 2, ACI 318 and ib Model Code 2010. Experi-mental results showed that the security level of normative estimates trend to reduce as the column rectangularity increases, and in some cases, the punching resistance was overestimated. Finally, adjustments are suggested in equations presented by NBR 6118 and MC2010 in order to eliminate this trend of unsafe results.
Keywords: lat slab, punching shear, rectangular column, reinforced concrete, codes.
Evidências experimentais indicam que tanto o índice de retangularidade dos pilares quanto as condições de contorno da ligação podem afetar a resistência última à punção. Este artigo apresenta aspectos gerais sobre estas situações e, através da análise de resultados experimentais de en-saios em 131 lajes, avalia a precisão e a adequabilidade das recomendações apresentadas pelas normas ABNT NBR 6118, Eurocode 2, ACI 318 e ib Model Code 2010. Os resultados experimentais mostraram uma tendência de redução do nível de segurança das estimativas normativas, à medida que o índice de retangularidade aumenta, chegando-se em alguns casos a superestimar a resistência à punção. Por im, são sugeridas adaptações nas equações da norma brasileira e do MC2010 buscando eliminar esta tendência de resultados inseguros.
Palavras-chave: lajes lisas, punção, pilar retangular, concreto armado, normas.
O. S. PAIVA a
[email protected] M. P. FERREIRA a
[email protected] D. R. C. OLIVEIRA a
[email protected] A. F. LIMA NETO b
[email protected] M. R. TEIXEIRA b
1. Introduction
The design of pavements with lat slabs involves punching re-sistance check of the slab-column connection. This is a key stage of the project, since the structure can achieve the ultimate limit state due to the exhaustion of the shear resistant capacity in the vicinity of the slab-column connection in a brittle failure mode known as punching shear. This failure mode can lead to ruin the structure through the progressive collapse, as shown in Figure 1, which shows the partial collapse of the loor of a ga-rage building recorded by Middleton [1], after a major earth-quake in the city of Christchurch, New Zealand.
In the absence of a theory capable of explaining and accurately predict the punching shear failure mechanism, taking into ac-count all the variables involved, the design of lat slabs is done by following design standards recommendations. These recom-mendations are essentially empirical and they assume a con-stant resicon-stant shear stress along different control perimeters, where this resistant stress is typically estimated as a function of parameters such as the compressive strength of the concrete, effective depth of the slab, lexural reinforcement ratio, geom-etry and dimensions of the column. In general, the current de-sign rules tend to ignore in its recommendations the inluence of the column rectangularity index and the boundary conditions of the slab-column connection. Both can facilitate the polarization of the shear stresses, as discussed by Ferreira and Oliveira [2], which can signiicantly reduce the punching resistance of the slab-column connection.
This paper presents experimental results of 131 tests in mod-els that represent the region of the slab-column connection of reinforced concrete flat slabs. Were selected cases of one-way and two-way connections supported on rectangular columns without shear reinforcement. These results are compared with theoretical estimates using the Brazilian standard, ABNT NBR 6118 [3], and also recommendations of international standards such as Eurocode 2 [4], ACI 318 [5] and fib Model Code 2010 [6, 7]. Adjustments and additional analyzes are still made,
applying the treatment proposed for rectangular columns by Oliveira [8] in the expressions of Brazilian standard and MC2010 in order to assess the gains if this factor were incor-porated in these rules. The reliability and accuracy of the se-lected standards are assessed according to a scale of demerit proposed by Collins [9].
2. Literature review
2.1 Geometry and column dimensions
and boundary conditions
The geometry and dimensions of the columns, as well as the boundary conditions of the slabs, can significantly influence the punching resistance of concrete flat slabs, since they affect the stress distribution in the slab-column connection. With the exception of ACI, the rules used in this article disregard the influence of these parameters, assuming a uniform distribution of stresses, since the load distribution is symmetrical, indicat-ing that they admit the possibility that, prior to rupture, there is a significant redistribution of stresses in the slab-column connection.
Experimental evidences as presented by Hawkins et al. [10] and Oliveira et al. [11] indicate that in the case of columns with rectangularity index greater than 2, the punching strength does not increase in direct proportion to the increase of the column section or the control perimeter length. This behavior is explained due to the polarization of shear stresses around the corners of the rectangular columns, which can lead to pre-mature punching failures. This can be especially dangerous for the design of buildings with flat slabs because, in practice, it is common to have columns of buildings with rectangularity index 4-5 at least.
The boundary conditions may also change the distribution of shear stresses around the column. One-way slab panels trend to concentrate the shear stresses on the column faces perpen-dicular to the smaller span. This can be easily checke by linear-elastic computational analysis, commonly used in the design of buildings with flat slabs. In these cases, if the connection has columns with high rectangularity index, this can further enhance the polarization stresses, reducing the punching re-sistance of the slab-column connection. No standard presents recommendations to help structural designers in these cases.
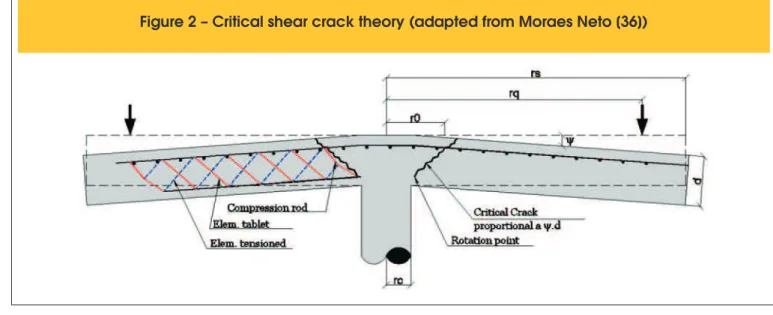
2.2 Critical shear crack theory (CSCT)
The punching resistance is a subject that has always received much attention, with numerous previous studies seeking to under-stand the failure mechanism and how it may be affected by the different variables involved in the practice of the structural design of lat slabs. Recently, ib Model Code 2010 [6, 7] introduced new formulations, based on the Critical Shear Crack Theory (CSCT). This theory was initially developed by Muttoni and Schwartz [12], but has been enhanced in works such as Muttoni [13] Fernandez Ruiz and Muttoni [14] and Sagaseta et al. [15]. It has as funda-mental hipothesys that the punching strength decreases with the increasing of rotation of the slab due to the appearance of a critical shear crack, which propagates along the slab thickness, cutting the concrete strut that transmits the shear force to the column.
The opening of the critical shear crack, which is assumed as pro-portional to the product ψ.d (see Figure 2), reduces the strength of the concrete strut and can lead to the punching failure. The shear transmission in the critical shear crack is assumed to be a function of the surface roughness, which is directly related to the maximum size of coarse aggregate. These concepts led to the development of Equation 1, which deines the punching resistance for a slab without shear reinforcement, expressed as a function of: the length of the control perimeter (u1) taken d/2 away from the column face; the effective depth of the slab (d); the compressive strength of concrete (fc); the product ψ.d, where ψ is the rotation of the slab, calculated according to Equation 2; the maximum aggregate size (dg); and a reference aggregate size (dg0), assumed to be 16 mm. Using the equations 1 and 2 it is possible to make the graph shown in Figure 3, where the punching resistance of the connection is determined at the point of intersection of the two curves.
(1)
1 ,
0
3
4 1 15
cR c
g g
u d
f
V
d
d
d
y
×
= ×
×
+ ×
+
×
(2)
3 21,5
s ys Es flex
f
r
V
d E
V
y
=
× ×
×ç
æ
ç
ö
÷
÷
è
ø
Where:
rs is the distance between column of slab and line of contralexure of moments;
fys is the yield strength of lexural reinforcemen;
Es is the modulus of elasticity of the lexural reinforcement; VE is the applied force;
Vlexis the lexural strength of the slab, calculated by the yield lines theory.
2.3 Flexural factors
(λ)
Oliveira [8] proposed a parameter λ to correct the punching re-sistance estimates for the case of rectangular slabs supported on columns in order to take into account both the lexural behavior of the slabs (boundary conditions) and the rectangularity index and the orientation of the columns. They were developed with refer-ence to experimental results of tests on reinforced concrete slabs under point load.
The bending factors (λ) were initially proposed for correction of the theoretical results from the former CEB-FIP MC90 [16], which are still the basis of the recommendations presented by the Brazilian code for the design of concrete structures. In the proposed method-ology, the slabs were classiied into three groups. For each group,
Figure 2 – Critical shear crack theory (adapted from Moraes Neto [36])
Figure 3 – Graphic representation of the
punching strength determination according
a value of the lexural factor (λ) was proposed for the correction of the theoretical punching resistance, as shown in Figure 4.
In the proposal presented by Oliveira et al. [11], the lexural factors function as a constant to correct the parameter of 0,18, which is the characteristic value if the original equation from MC90, result -ing in Equation 3 . The results of this change were signiicantly better compared with the experimental results and eliminated the tendency to overestimate the punching resistance of lat slabs sup-ported on rectangular columns. Similarly, this methodology will be used in the estimates made with the recommendations from NBR 6118 and ib Model Code 2010, in order to assess the gains from the implementation of this parameter.
(3)
(
´)
1/3,
0,18
1
200
100. .
R c c
V
f
u d
d
æ
ö
=
× +
ç
ç
÷
÷
×
è
ø
r
× ×
l
2.4 Demerit points classiication
Collins [9] presented a scale to classify the reliability of code’s provisions, denominated as Demerit Points Classiication (DPC), which takes into account the safety, accuracy and
scat-tering as a function of the ratio between the ultimate resistance observed in experimental tests (Vexp), and the estimated theo-retical load capacity (Vteo). Table 1 shows an adaptation made in this research to the original values proposed by Collins. Thus, depending on the range of the results of Vexp/Vteo, penalties are stablished to the standard code under analysis. The value of the demerit of each code is calculated by the sum of the products of the number of slabs in each interval, for their corresponding penalty. The higher the value of the total sum is, the worse is considered the code provision.
2.5 Code provisions
2.5.1 NBR 6118
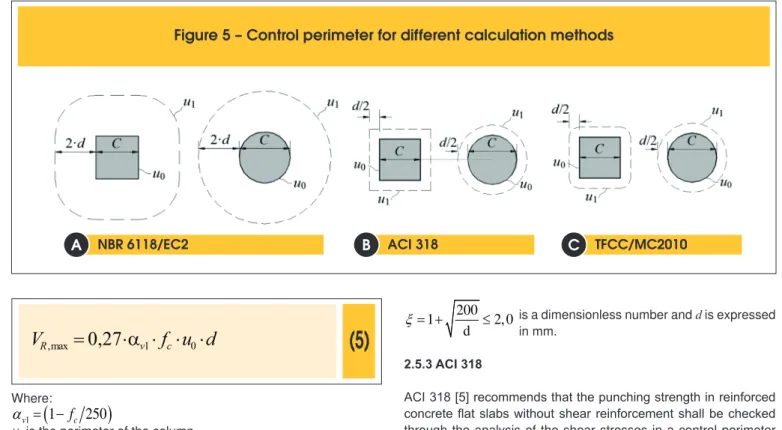
The NBR 6118 [3] assumes that the punching resistance of re-inforced concrete lat slabs without shear reinforcement shall be checked in two regions: the resistance to diagonal tension should be checked at the control perimeter u1, according to Equation 4; the maximum resistance (crushing of the concrete strut close to the column) must be checked in the perimeter u0 around the column using Equation 5. Figure 5a shows details of the control perimeters proposed by the Brazilian standard.
(4)
(
)
(
)
1/3 ,0,18 1
20
0
10
0
1R c c
V
=
× +
d
×
× ×
r
f
×
u
×
d
Where:
ρ is the ratio of lexural reinforcement, calculated as
ρ
=
ρ ρ
x⋅
y ; ρx and ρy are the ratios of lexural reinforcement in two orthogonaldirections, calculated assuming a width equal to the size of the column plus 3d to either side;
fc is the compressive strength of concrete in MPa (fc ≤ 50 MPa); u1 is the control perimeter taken at a distance of 2.d away from the column face;
d is the effective depth of the slab in mm.
Figure 4 – Bending factors for flat slabs (adapted from Oliveira [8])
Table 1 – Classification by demerit points
(Collins [9])
Vexp/Vteo Classification Demerit points
<0,50 Extremely dangerous 10
[0,50-0,85] Dangerous 5
[0,85-1,15] Appropriat and safe 0
[1,15-2,00] Conservative 1
(5)
,max
0,27
1 0R v c
V
=
×
a
× × ×
f u d
Where:
(
)
1
1
250
v
f
cα
= −
u0 is the perimeter of the column.
2.5.2 Eurocode 2
The recommendations made by Eurocode 2 [4] are similar to those given by the Brazilian standard, since both are based on the rec-ommendations of CEB-FIP MC90 [16]. It differs from the Brazilian standard by imposing limits on the value of the Size effect (ξ≤2, 0) and lexural reinforcement ratio (ρ≤2, 0%). This was done trying to eliminate the trend of unsafe results. This has been discussed in other researches like those from Sacramento et al. [17] and Olivei-ra et al. [18]. Therefore, the punching resistance is assumed as the lowest value given by Equations 6 and 7. The control perimeters are equal to those in the Brazilian code (see Figure 5a).
(6)
(
)
11 /3
,
0,18
100 .
.
R c c
V
=
×
x
×
r
f
×
u
×
d
(7)
,
0,3
1
250
c 0R max c
f
V
=
f
× -
æ
ö
÷
×
u d
è
ø
×
ç
×
Where:
fc is the compressive strength of concrete in MPa (fc ≤ 90 MPa); ρ is the ratio of lexural reinforcement of the slab, obtained as
2, 0%
ρ
=
ρ ρ
x⋅
y≤
;ρx and ρy are the rates in the x and y directions, respectively. The
bars are to be considered within a region far from the 3.d sides of the column.
200
1
2, 0
d
ξ
= +
≤
is a dimensionless number and d is expressed in mm.2.5.3 ACI 318
ACI 318 [5] recommends that the punching strength in reinforced concrete lat slabs without shear reinforcement shall be checked through the analysis of the shear stresses in a control perimeter taken at a distance equal to d/2 from the column face or the edges of the loaded area, as shown in Figure 5b using Equation 8.
(8)
1 , 1 1 121
1
6
1
min
2
12
1
3
c c sR c c
c
f u
V
d
d
f u d
u
f u d
b
a
ìæ
ö
+
× ×
×
ïç
÷
è
ø
ï
ïæ
ö
ï
=
íç
+
÷
×
×
×
è
ø
ï
ï
×
×
×
×
×
î
×
ï
ï
Where:βc is the ratio of long side to short side of thecolumn;
αs is a constant taken as 40 for interior columns, 30 for edge
col-umns and 20 for corner colcol-umns;
u1 the length of a control perimeter taken d/2 away from the column face;
fc is the compressive strength of concrete in MPa (fc ≤ 69 MPa).
2.5.4 ib model code 2010
The recommendations presented by the ib Model Code 2010 [6, 7] are based on a physical model fundamented on the Critical Shear Crack Theory, presented briely in section 2.2 of this paper. In this code, the punching resistance should be checked around a control perimeter (bo), admitted at a distance of 0,5.dv from the column faces or edges of the loaded area with the geometry as shown in Figure 5c. The effective depth of the slab, dv, should consider
Figure 5 – Control perimeter for different calculation methods
NBR 6118/EC2 ACI 318 TFCC/MC2010
the level of support, as shown in Figure 6. In the case of lat slabs without shear reinforcement, the punching resistance shall be cal-culated according to Equation 9.
(9)
, c
R c o v
c
f
V
=
k
y×
× ×
b d
g
Where:
fc is the compressive strength of concrete; dv is the effective depth of the slab;
c
γ
is the concrete safety factor with a value of 1.5. For purposes of the calculations it was assumed asequal to 1.kψ is calculated by Equation 10 and depends on the slab rotation in the support region.
(10)
1
0,6
1,5 0,9
dgk
d k
=
£
+
× × ×
yy
(11)
32
0,75
16
dg gk
d
=
³
+
Where:dg is the maximum diameter of the aggregate used in the concrete slab.
ib Model Code 2010 states that the rotation of the slab (ψ) can be calculated with different levels of approximation, depending on the accuracy required. In this case, the precision obtained increases as a function of the complexity of the analysis. The level I of ap-proaximation is recommended for the primary design of new struc-tures. The level II is suitable for both the design of new structures and for checking of existing structures. In special cases, where the characteristics of the strucuture or of the loads are nonconvention-al, the level III of approximation is recommended in order to better estimate the response of the slab. In special cases, it is permitted that the rotation is obtained using non-linear analysis, correspond-ing to the level IV of approximation.
In the practice of the design of concrete structures, level I can be used, for example, in the case of regular lat slabs designed
ac-cording to an elastic analysis without signiicant redistribution of internal forces, and the rotation can be estimated according to Equation 12. In cases where signiicant moment redistribution is considered in design, Equation 13 can be used to estimate the slab rotation, referring to the level II of approaximation.
(12)
1,5
s yss
f
r
d E
=
× ×
y
(13)
1,51,5
s ys ss R
f
r
m
d E
m
æ
ö
=
× ×
×ç
÷
è
ø
y
Where:
fys is the yield strength of the lexural reinforcement; Es is the modulus of elasticity of the lexural reinforcement; rs is the position where the radial bending moment is zero with re-spect to the support axis. The value of rs can be approximated as 0.22 Lx or 0.22 Ly for the x and y directions, respectively, for regular lat slabs where the ratio of the spans (Lx/Ly) is between 0.5 and 2.0.
ms is the average moment per unit length applied in the slab-col-umn connection;
mR is the lexural strength per unit length of the slab-column con-nection.
Both moments are calculated for a strip with width equal to
0,5
, ,
1, 5 (
⋅
⋅
)
≤
=
s s x s y min
b
r
r
L
. In this case, rsx and rsy denotes the point at which the moments are equal to zero, having as refer-ence the axis of the support in x and y directions. The approximate value of mSd depends on the location of the column in the building. The code considers three possible locations for the columns: (1) internal to the building, (2) at the edge; and (3) at the corner. In the case of internal columns, where the slab has equal lexural strength in both directions, ms is calculated by the simpliied ex-pression presented in Equation 14. The average lexural strength per unit length (mR) can be obtained according to Equation 15.(14)
8
=
Es
V
m
(15)
2
1
2
ys ysc R
f
m
d f
f
×
æ
ö
= ×
-×
ø
× ×ç
÷
è
r
r
Where:
ρ is the lexural reinforcement ratio.
In the level III of approximation, the coeficient 1.5 in Equation 13 may be replaced by 1,2 if the values of rs and ms are calculated by a linear-elastic model. In the level IV of approaximation, the
Table 2 – Characteristics of the slabs in the database
Author Slab Type d (mm)
cmin
(mm) cmax
(mm) ρ (%) f´c
(MPa) fys
(MPa) Esf
(GPa) dg (mm)
Pflex
(kN)
Vexp
(kN)
Failure mode
Ferreira [30]
L1a 2 87,0 85 85 0,94 42,4 488 220,0 12,0 255,1 174,0 P
L1b 2 89,0 85 85 1,18 51,4 488 220,0 12,0 264,2 231,5 FP
L1c 2 87,0 85 85 1,48 43,5 488 220,0 12,0 255,8 190,0 P
Lima Neto
[28]
AL1 1 100,0 150 170 1,37 42,0 616 207,0 19,0 472,0 300,0 P
AL2 1 102,0 150 170 1,34 44,0 616 207,0 19,0 485,0 380,0 P
AL3 1 100,0 150 170 1,37 41,0 616 207,0 19,0 472,0 340,0 P
AL4 1 95,0 150 170 1,44 47,0 616 207,0 19,0 452,0 310,0 P
Oliveira
[8]
L1a 1 107,0 120 120 1,09 57,0 750 234,0 15,0 241,2 234,0 FP
L1b 1 108,0 120 120 1,08 59,0 750 234,0 15,0 657,1 322,0 P
L1c 3 107,0 120 120 1,09 59,0 750 234,0 15,0 706,7 318,0 P
L2a 1 109,0 120 240 1,07 58,0 750 234,0 15,0 261,7 246,0 FP
L2b 2 106,0 120 240 1,1 58,0 750 234,0 15,0 644,6 361,0 P
L2c 3 107,0 120 240 1,09 57,0 750 234,0 15,0 735,6 331,0 P
L3a 1 108,0 120 360 1,08 56,0 750 234,0 15,0 277,0 241,0 FP
L3b 2 107,0 120 360 1,09 60,0 750 234,0 15,0 645,2 400,0 P
L3c 3 106,0 120 360 1,1 54,0 750 234,0 15,0 745,8 358,0 P
L4a 1 108,0 120 480 1,08 56,0 750 234,0 15,0 295,3 251,0 FP
L4b 2 106,0 120 480 1,1 54,0 750 234,0 15,0 637,1 395,0 P
L4c 3 107,0 120 480 1,09 56,0 750 234,0 15,0 792,2 404,0 P
L5a 1 108,0 120 600 1,08 57,0 750 234,0 15,0 318,9 287,0 FP
L5b 2 108,0 120 600 1,08 67,0 750 234,0 15,0 655,4 426,0 P
L5c 3 109,0 120 600 1,07 63,0 750 234,0 15,0 857,7 446,0 P
Hawkins et al.
[10]
1 1 117,3 305 305 1,12 30,9 419 200,0 12,0 362,0 391,0 F
2 1 117,3 203 406 1,12 26,9 419 200,0 12,0 384,9 358,0 P
3 1 117,3 152 457 1,12 32,6 419 200,0 12,0 400,0 340,0 P
4 1 117,3 114 495 1,12 31,6 419 200,0 12,0 411,0 337,0 P
5 2 117,3 152 457 1,12 27,4 419 200,0 12,0 489,2 362,0 P
6 2 117,3 152 457 1,12 23,1 419 200,0 12,0 322,6 342,0 F
7 3 117,3 152 457 0,86 26,4 419 200,0 12,0 417,9 326,0 P
8 3 120,7 114 495 0,8 26,6 422 200,0 12,0 416,9 321,0 P
9 3 120,7 152 305 0,76 30,1 422 200,0 12,0 350,0 322,0 P
Regan e Rezai- Jorabi [24]
14R 1 79,0 75 100 1,54 31,0 670 200,0 13,0 236,9 154,0 P
15R 2 79,0 100 150 1,54 30,8 670 200,0 13,0 235,6 172,0 P
19R 2 79,0 100 150 1,51 29,0 670 200,0 13,0 288,1 170,0 P
P is the failure mode by punching; FP is the failure mode by ductile punching; and F is the failure mode by bending.
rotation (ψ) of the slab-column connection is obtained through a non-linear analysis, accounting for cracking, tension-stiffening ef-fects, yielding of the reinforcement and any other non-linear effects relevant for providing an accurate assessment of the structure.
3. Database
supported on square and rectangular columns, with a total of 131 results presented by Forssel and Holmberg [19], Elstner and Hognestad [20], Mowrer and Vanderbilt [21], Hawkins et. al. [10], Regan [22], Regan [23], Regan and Pray-Jorabi [24], Tomaszewicz [25], and Teng Leong [26], Borges [27], Lima Neto [28], Oliveira [8], Al-Yousif and Regan [29], Ferreira [30],
Vilhena et al. [31], Carvalho [32], Moorish [33], Damasceno [34] and Moraes Neto [35]. In the case of the ib predictions, as some authors did not specify the maximum diameter of the aggregates, an average value of 13 mm was assumed. Table 2 shows the characteristics of the slabs.
As the ib Model Code 2010 does not present neither instructions to estimate the punching strength of slabs supported on rectan-gular columns, nor provisions to treat the cases where the slab panels have different spans (rectangular for example), it was nec-essary to make some assumptions in order to allow its use in these analyses. In the case of rectangular panels, the rotations were cal-culated in both directions and the higher values were used to es-timate the punching resistance. The lexural resistance (Vlex) pro-vided by the authors of the tests was used to calculate the rotations
Table 2 – (cont. 1)
Author Slab Type d (mm)
cmin
(mm) cmax
(mm) ρ (%) f´c (MPa) fys (MPa) Esf (GPa) dg (mm) Pflex (kN) Vexp (kN) Failure mode
Teng et al.
[26]
OC11 3 105,3 200 200 1,81 36,0 452 200,0 13,0 604,3 423,0 P
OC13 3 107,3 200 600 1,71 35,8 452 200,0 13,0 676,2 568,0 P
OC15 3 102,8 200 1000 1,76 40,2 452 200,0 13,0 697,8 649,0 P
OC13 3 109,8 200 600 1,67 33,0 470 200,0 13,0 715,5 508,0 P
C11F22 3 155,0 250 250 1,72 35,4 460 200,0 13,0 1306,3 627,0 P
C13F22 3 155,0 250 750 1,66 35,6 460 200,0 13,0 1494,3 792,0 P
C15F22 3 160,0 250 1250 1,64 35,4 460 200,0 13,0 1760,0 1056,0 P
C13F11 3 159,0 250 750 1,07 35,5 520 200,0 13,0 1183,1 769,0 P
Forssel e Holmberg
[19]
10 3 104,0 25 300 0,68 17,6 500 200,0 13,0 221,4 186,0 P
11 3 112,0 140 540 0,63 17,6 500 200,0 13,0 281,8 279,0 P
12 3 108,0 140 340 0,65 17,6 500 200,0 13,0 308,1 265,0 P
Elstner e Hognestad
[20]
A7 1 114,5 254 254 2,48 28,5 321 200,0 13,0 416,7 400,0 P
A8 1 114,5 356 356 2,48 21,9 321 200,0 13,0 423,3 436,0 P
A2a 3 114,5 254 254 2,48 13,7 321 200,0 13,0 586,0 334,0 P
A2b 3 114,5 254 254 2,48 19,5 321 200,0 13,0 655,7 400,0 P
A2c 3 114,5 254 254 2,48 37,4 321 200,0 13,0 741,3 467,0 P
A7b 3 114,5 254 254 2,48 27,9 321 200,0 13,0 711,1 512,0 P
A5 3 114,5 356 356 2,48 27,8 321 200,0 13,0 762,9 534,0 P
Regan [22]
DT1 1 190,0 150 150 1,28 43,6 530 200,0 13,0 847,8 780,0 P
BD2 1 101,0 100 100 1,28 42,2 530 200,0 13,0 299,0 293,0 P
Al-Y
ousif e
Regan [29]
1 1 80,0 100 500 0,98 23,6 472 200,0 13,0 229,6 163,0 P
2 3 80,0 100 500 0,98 23,2 472 200,0 13,0 243,0 209,0 P
3 2 80,0 100 500 0,98 21,2 472 200,0 13,0 225,0 189,0 P
4 3 80,0 300 300 0,98 22,0 472 200,0 13,0 239,6 242,0 P
Carvalho
[32]
1 2 85,0 85 85 1,32 52,0 530 646,0 19,0 220,2 185,0 P
2 2 86,0 85 255 1,32 52,0 530 646,0 19,0 223,8 226,0 P
3 2 85,0 85 425 1,32 50,0 530 646,0 19,0 219,3 239,0 P
P is the failure mode by punching; FP is the failure mode by ductile-punching; and F is the failure mode by bending.
of the slabs. Finally, in case of rectangular columns, a rectangular control perimeter was assumed, taken at a distance of 0,5.dv from the column faces.
In order to improve the provision presented by NBR 6118 [3], the bending factores proposed by Oliveira [8] were incorporated in or-der to check the accuracy of its theoretical estimates. In the case of the Brazilian code, it was also cheched the effect of reducing the coeficient of 0.18 to 0.16 in Equation 4, as suggested by Sacra -mento et al. [17]. The bending factores suggested by Oliveira were also applied in the recommendations presented by ib Model Code 2010, in order to check the possible improvements.
Table 2 – (cont. 2)
Author Slab Type d (mm)
cmin
(mm) cmax
(mm) ρ (%) f´c
(MPa) fys
(MPa) Esf
(GPa) dg (mm)
Pflex
(kN)
Vexp
(kN)
Failure mode
Borges [27]
L42 3 139,0 200 400 1,46 43,2 604 200,0 13,0 1152,6 657,0 P
L42a 3 164,0 200 400 1,23 36,2 604 200,0 13,0 1358,8 693,0 P
L45 3 154,0 200 600 1,31 42,0 604 200,0 13,0 1352,5 798,0 P
L46 3 164,0 200 800 1,23 39,3 604 200,0 13,0 1518,3 911,0 P
L41 3 139,0 150 250 1,46 44,7 604 200,0 13,0 1103,9 563,0 P
L41a 3 164,0 150 250 1,23 38,9 604 200,0 13,0 1304,3 600,0 P
L43 3 164,0 150 450 1,23 38,7 604 200,0 13,0 1369,8 726,0 P
L44 3 164,0 150 600 1,23 40,0 604 200,0 13,0 1435,8 761,0 P
Mowrer e V
anderbilt
[21]
1 3AL 51,0 102 102 1,1 28,6 386 200,0 13,0 75,4 86,0 F
2 3AL 51,0 102 102 2,2 24,9 386 200,0 13,0 136,0 102,0 P
3 3AL 51,0 152 152 1,1 21,1 386 200,0 13,0 77,5 79,0 F
4 3AL 51,0 152 152 2,2 18,0 386 200,0 13,0 132,0 99,0 P
5 3AL 51,0 203 203 1,1 15,5 386 200,0 13,0 78,8 93,0 F
6 3AL 51,0 203 203 2,2 27,2 386 200,0 13,0 154,7 133,0 P
7 3AL 51,0 254 254 1,1 23,3 386 200,0 13,0 87,9 109,0 F
8 3AL 51,0 254 254 2,2 22,9 386 200,0 13,0 158,3 152,0 P
9 3AL 51,0 305 305 1,1 28,0 386 200,0 13,0 95,2 119,0 F
10 3AL 51,0 305 305 2,2 26,4 386 200,0 13,0 171,7 158,0 P
11 3AL 51,0 356 356 1,1 27,8 386 200,0 13,0 101,5 138,0 F
12 3AL 51,0 356 356 2,2 25,0 386 200,0 13,0 183,2 185,0 F
13 3AL 51,0 406 406 1,1 24,9 386 200,0 13,0 107,4 145,0 F
14 3AL 51,0 406 406 2,2 24,6 386 200,0 13,0 194,7 185,0 P
Damasceno
[34]
L1A 2 89,3 85 85 1,22 41,3 600 240,0 13,0 265,5 188,5 P
L2A 2 89,3 85 255 1,22 40,0 600 240,0 13,0 264,6 254,0 FP
L3A 2 99,7 85 425 1,09 39,7 600 240,0 13,0 303,1 297,0 F
L4A 2 98,6 85 595 1,1 40,4 600 240,0 13,0 295,5 325,0 F
L1B 2 98,1 85 85 0,56 41,4 600 240,0 13,0 296,6 172,0 P
L2B 2 90,5 85 255 0,61 42,0 600 240,0 13,0 273,9 194,5 P
L3B 2 92,7 85 425 0,59 41,6 600 240,0 13,0 286,4 232,0 FP
L4B 2 98,1 85 595 0,56 40,5 600 240,0 13,0 292,5 254,5 FP
V
ilhena et.al.
[31]
L1a 2 65,0 85 85 1,2 51,2 518 259,0 12,0 73,0 123,0 P
L1b 2 65,0 85 85 1,4 51,2 518 259,0 12,0 89,0 122,0 P
L3a 2 65,0 85 255 1,2 53,6 518 259,0 12,0 73,0 134,5 FP
L3b 2 67,0 85 255 1,4 53,6 518 259,0 12,0 92,0 134,0 FP
L5a 2 65,0 85 425 1,2 55,2 518 259,0 12,0 73,0 122,0 F
L5b 2 65,0 85 425 1,4 55,2 518 259,0 12,0 89,0 124,5 F
Moraes Neto [35]
L1 3 87,0 85 85 1,4 39,4 602 255,3 13,0 453,0 224,0 P
L2 3 87,5 85 255 1,2 39,8 602 255,3 13,0 422,0 241,0 P
L3 3 86,5 85 425 1,3 40,9 602 255,3 13,0 473,0 294,0 P
the slabs classiied as failing by lexure were not considered in the statistical analysis presented below.
4. Results
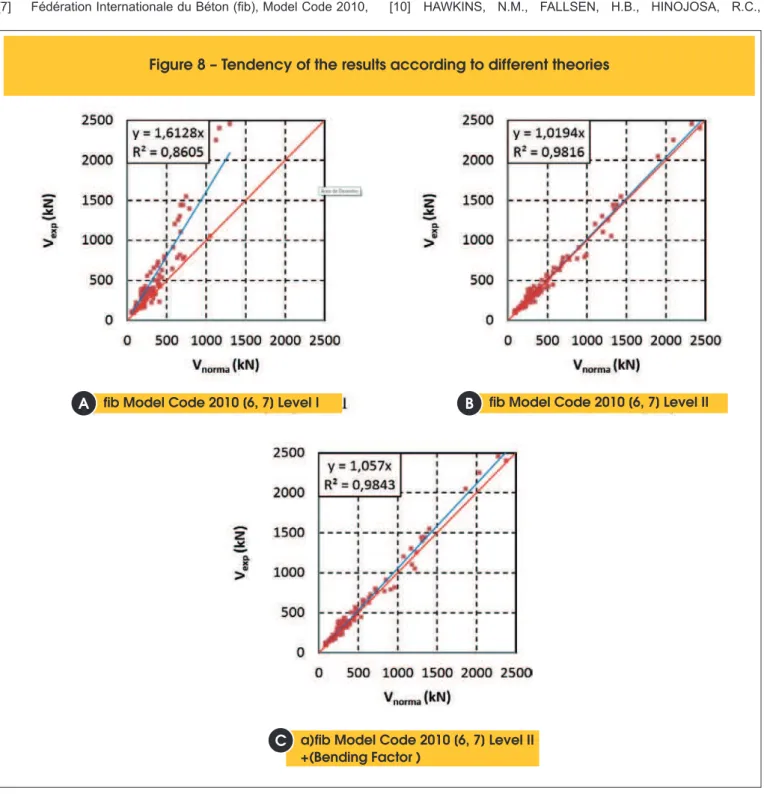
Tables 3a and 3b show comparisons between experimental and theoretical results obtained for each code analyzed and also for the adaptations proposed. Figures 7 and 8 graphically show the accuracy of each code. In these igures, the results of the trend
Table 2 – (cont. 3)
Author Slab Type (mm)d cmin
(mm) cmax
(mm) ρ (%) f´c (MPa)
fys (MPa)
Esf (GPa)
dg (mm)
Pflex (kN)
Vexp (kN)
Failure mode
Mouro [33]
L1 3 94,0 250 250 1,39 29,0 597 215,0 13,0 520,8 375,0 P
L2 3 93,0 230 270 1,4 29,0 597 215,0 13,0 513,2 390,0 P
L3 3 94,0 215 285 1,39 29,0 597 215,0 13,0 520,8 375,0 P
L4 3 90,0 200 300 1,45 29,0 597 215,0 13,0 493,8 395,0 P
L5 3 91,0 165 335 1,43 22,0 597 215,0 13,0 475,3 385,0 P
L6 3 91,0 125 375 1,43 22,0 597 215,0 13,0 479,5 350,0 P
L7 3 91,0 110 390 1,43 22,0 597 215,0 13,0 476,2 300,0 P
L8 3 94,0 100 400 1,39 22,0 597 215,0 13,0 500,0 275,0 P
Regan [23]
I/2 3 77,0 200 200 1,2 23,4 500 200,0 10,0 374,5 176,0 P
I/4 3 77,0 200 200 0,92 32,3 500 200,0 10,0 373,1 194,0 P
I/6 3 79,0 200 200 0,8 21,9 480 200,0 10,0 250,0 165,0 P
I/7 3 79,0 200 200 0,8 30,4 480 200,0 10,0 251,4 186,0 F
II/1 3 200,0 250 250 0,98 34,9 530 200,0 20,0 2171,1 825,0 P
II/2 3 128,0 160 160 0,98 33,3 485 200,0 20,0 812,5 390,0 P
II/3 3 128,0 160 160 0,98 34,3 485 200,0 10,0 811,1 365,0 P
II/4 3 64,0 80 80 0,98 33,3 480 200,0 20,0 198,3 117,0 P
II/5 3 64,0 80 80 0,98 34,3 480 200,0 10,0 198,1 105,0 P
II/6 3 64,0 80 80 0,98 36,2 480 200,0 5,0 198,1 105,0 P
Tomaszewicz
[25]
ND65-1-1 3 275,0 200 200 1,5 64,3 500 200,0 16,0 5694,4 2050 P
ND65-2-1 3 200,0 150 150 1,7 70,2 500 200,0 16,0 3333,3 1200 P
ND95-1-1 3 275,0 200 200 1,5 83,7 500 200,0 16,0 5625,0 2250 P
ND95-1-3 3 275,0 200 200 2,5 89,9 500 200,0 16,0 9600,0 2400 P
ND95-2-1 3 200,0 150 150 1,7 88,2 500 200,0 16,0 3333,3 1100 P
ND95-2-1D 3 200,0 150 150 1,7 86,7 500 200,0 16,0 3333,3 1300 P
ND95-2-3 3 200,0 150 150 2,6 89,5 500 200,0 16,0 5178,6 1450 P
ND95-2-3D 3 200,0 150 150 2,6 80,3 500 200,0 16,0 5208,3 1250 P
ND95-2-3D+ 3 200,0 150 150 2,6 98,0 500 200,0 16,0 5178,6 1450 P
ND95-3-1 3 88,0 100 100 1,8 85,1 500 200,0 16,0 702,1 330 P
ND115-1-1 3 275,0 200 200 1,5 112,0 500 200,0 16,0 5697,7 2450 P
ND115-2-1 3 200,0 150 150 1,7 119,0 500 200,0 16,0 3333,3 1400 P
ND115-2-3 3 200,0 150 150 2,6 108,1 500 200,0 16,0 5166,7 1550 P
P is the failure mode by punching; FP is the failure mode by ductile punching; and F is the failure mode by bending.
lines are indicated in blue and the red line marks the safety limit. Results below this line indicate unsafe theoretical predictions if compared to the experimental evidence.
Table 3a – Comparison between the experimental and theoretical results
Vexp/Vcode
Author (mm)d (%)ρ fc
(MPa)
ACI EC2 NB1
MED COV MED COV MED COV
Forssel e Holmberg [19] 104 - 112 0,63 - 0,68 17 1,58 0,26 1,18 0,09 0,99 0,09
Elstner e Hognestad [20] 114 2,48 13 - 34 1,48 0,11 1,13 0,09 0,90 0,09
Mowrer e Vanderbilt [21] 51 1,1 - 2,2 15 - 28 1,64 0,11 1,32 0,07 0,85 0,07
Hawkins et. al [10] 117 - 120 0,76 - 1,12 23 - 32 1,15 0,08 0,99 0,06 0,85 0,07
Regan [22] 101 - 190 1,28 42 - 43 1,52 0,14 1,14 0,17 1,01 0,05
Regan [23] 64 - 200 0,8 - 1,2 21 - 36 1,34 0,12 1,21 0,10 0,95 0,06
Regan e Rezai-Jorabi [24] 79 1,51 - 1,54 29 - 31 1,50 0,05 1,12 0,01 0,86 0,01
Tomaszewicz [25] 88 - 275 1,5 - 2,6 64 - 119 1,69 0,10 1,13 0,08 1,04 0,07
Teng et al. [26] 102 - 160 1,07 - 1,81 33 - 40 1,38 0,14 1,09 0,14 0,95 0,09
Borges [27] 139 -164 1,23 -1,46 36 - 44 1,29 0,07 1,04 0,05 0,97 0,03
Lima Neto [28] 95 - 102 1,34 -1,44 41 - 47 1,47 0,08 1,26 0,08 1,03 0,09
Oliveira [8] 106 - 109 1,07 - 1,1 54 - 67 1,20 0,06 1,07 0,06 0,89 0,06
Al-Yousif e Regan [29] 80 0,98 21 - 23 1,36 0,12 1,13 0,17 0,86 0,17
Ferreira [30] 87 - 89 0,94 - 1,48 42 - 51 1,39 0,05 1,10 0,05 0,86 0,05
Vilhena et. al. [31] 65 - 67 1,2 - 1,4 51 - 55 1,32 0,01 1,12 0,04 0,80 0,04
Carvalho [32] 85 - 86 1,32 50 - 52 1,29 0,03 1,00 0,06 0,78 0,06
Mouro [33] 90 - 94 1,39 -1,45 22 - 29 1,84 0,11 1,50 0,11 1,20 0,11
Damasceno [34] 89 - 99 0,56 -1,22 39 - 42 1,23 0,13 1,10 0,02 0,88 0,02
Moraes Neto [35] 86 - 87 1,2 - 1,4 39 - 40 1,66 0,08 1,23 0,06 0,97 0,06
Average 1,45 1,15 0,95 101 117 71
COV (%) 17,25 14,06 12,92 8 16 5
case of Eurocode, about 87% of results were found in favor of safety, taking up to 13% of unsafe results. Among all the results against the security, 84% refer to the slabs with rectangular columns. This indi-cates that Eurocode 2 equations require adjustments for these cases. In the case of NBR 6118 [3], the coeficient of variation was of 13%, similar to the one from Eurocode, but with a strong trend of unsafe results. The Brazilian code had a mean of 0.95 and overes-timated the strength of 71% of the slabs of the database, indicating that it would be important to review the current recommendations. About 42% of its unsafe results refer to cases of slabs supported on square columns, which is one of the most basic situations in the design of buildings with lat slabs. This contrasts with the fact that the code was recently reviewed, but the punching shear recom-mendations were maintained, which are still based on CEB-FIP MC90 [16], neither relecting the state of the art nor the advances obtained in the last two decades.
ib Model Code 2010 [6, 7] on its level I approach presented con-servative results, with average of 1.45 and with ther higher coef-icient of variation (26%), but with most of Vexp/Vcode values above the reference value. Their results, compared with ACI 318 [5], were worse, with 11% of the slabs presenting theoretical predic-tions against safety. It should be noted, however, that the level I
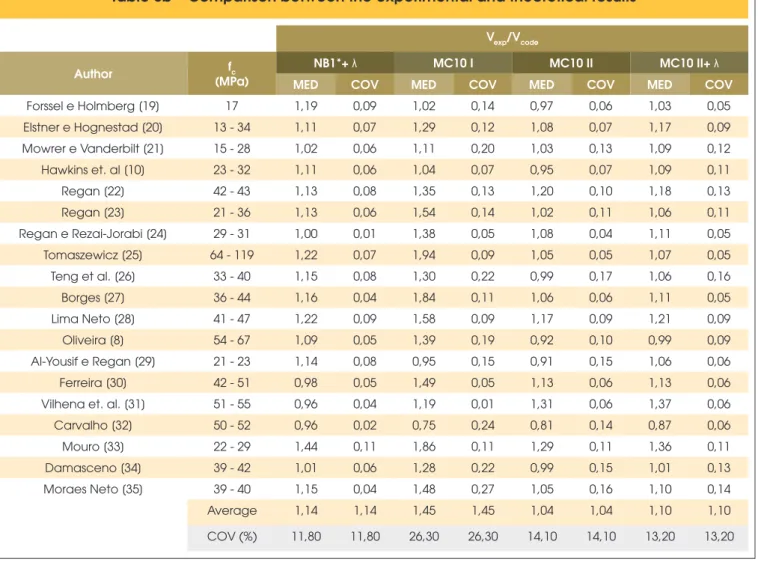
cas-Table 3b – Comparison between the experimental and theoretical results
Vexp/Vcode
Author fc
(MPa)
NB1*+ λ MC10 I MC10 II MC10 II+ λ
MED COV MED COV MED COV MED COV
Forssel e Holmberg [19] 17 1,19 0,09 1,02 0,14 0,97 0,06 1,03 0,05
Elstner e Hognestad [20] 13 - 34 1,11 0,07 1,29 0,12 1,08 0,07 1,17 0,09
Mowrer e Vanderbilt [21] 15 - 28 1,02 0,06 1,11 0,20 1,03 0,13 1,09 0,12
Hawkins et. al [10] 23 - 32 1,11 0,06 1,04 0,07 0,95 0,07 1,09 0,11
Regan [22] 42 - 43 1,13 0,08 1,35 0,13 1,20 0,10 1,18 0,13
Regan [23] 21 - 36 1,13 0,06 1,54 0,14 1,02 0,11 1,06 0,11
Regan e Rezai-Jorabi [24] 29 - 31 1,00 0,01 1,38 0,05 1,08 0,04 1,11 0,05
Tomaszewicz [25] 64 - 119 1,22 0,07 1,94 0,09 1,05 0,05 1,07 0,05
Teng et al. [26] 33 - 40 1,15 0,08 1,30 0,22 0,99 0,17 1,06 0,16
Borges [27] 36 - 44 1,16 0,04 1,84 0,11 1,06 0,06 1,11 0,05
Lima Neto [28] 41 - 47 1,22 0,09 1,58 0,09 1,17 0,09 1,21 0,09
Oliveira [8] 54 - 67 1,09 0,05 1,39 0,19 0,92 0,10 0,99 0,09
Al-Yousif e Regan [29] 21 - 23 1,14 0,08 0,95 0,15 0,91 0,15 1,06 0,06
Ferreira [30] 42 - 51 0,98 0,05 1,49 0,05 1,13 0,06 1,13 0,06
Vilhena et. al. [31] 51 - 55 0,96 0,04 1,19 0,01 1,31 0,06 1,37 0,06
Carvalho [32] 50 - 52 0,96 0,02 0,75 0,24 0,81 0,14 0,87 0,06
Mouro [33] 22 - 29 1,44 0,11 1,86 0,11 1,29 0,11 1,36 0,11
Damasceno [34] 39 - 42 1,01 0,06 1,28 0,22 0,99 0,15 1,01 0,13
Moraes Neto [35] 39 - 40 1,15 0,04 1,48 0,27 1,05 0,16 1,10 0,14
Average 1,14 1,14 1,45 1,45 1,04 1,04 1,10 1,10
COV (%) 11,80 11,80 26,30 26,30 14,10 14,10 13,20 13,20
es, because they presented many conservative predictions, having scores of 100 and 98 points, respectively. The MC2010 Level II and Eurocode 2 [4] (without adjustments) had the best performance ac -cording to this criteria, having 65 penalty and 43 points, respectively. If the changes suggested were implemented, NBR 6118 [3] could present signiicant improvements. Its penalty points would de -crease to 42 points, with most of the results in the range where the penalty is equal to zero (between 0.85 and 1.15). If the bending factor (λ) were applied in the ib Model Code 2010 [6, 7] Level II, the best performance would be achieved in terms of design, with only 40 penalty points, the lowest among all tested hypotheses. Figures 9 and 10 show the trend lines for each theoretical method according to the rectangularity index of the columns. It is clear to all design methods that there is a declining trend in Vexp/Vcode as a function of the rectangularity index of the column. In the case of NBR 6118 [3], Eurocode 2 [4] and ib Model Code 2010 [6, 7], there is a tendency to overestimate the resistance of slabs supported on rectangular columns, especially in the case of the Brazilian code. The changes proposed to the NBR 6118 [3] and the ib Model Code 2010 [6, 7] level II corrected this trend of unsafe results, especially in the case of the Brazilian code.
5. Conclusions
This paper used results of experimental tests of 131 slabs to eval-uate different recommendations for the punching shear design of slab-column connections. The variables evaluated were the boundary conditions and the rectangularity index of the columns. It was observed that, generally, the recommendations presented by ACI 318 [5] and ib Model Code 2010 [6, 7] Level I are in favor of safety, but are conservative, indicating the possibility of adjust-ments to avoid an exagereted level of security. Eurocode 2 [4] and the MC2010 Level II showed satisfactory results, with MC2010 beeing slightely more accurate, but with 43% of unsafe results, against 20% for Eurocode.
Figure 7 – Tendency of the results according to different theories
Eurocode 2 [4]
NBR 6118* [3] +(Bending Factor ) ACI 318 [5]
NBR 6118 [3]
B
D
A
C
It should also be noted that the proposals made are simple to im-plement in terms of calculation. It is hoped that these and other work can motivate a deep discussion on the current recommenda-tions for the design of lat slabs in Brazil, in order to allow the Bra-zilian code to relect the state of the art and the progress obtained through many researches conducted in Brazil and abroad.
6. Acknowledgements
The authors would like to acknowledge FAPESPA, CNPq and CAPES for the inancial support in all steps of this research.
7. References
[1] MIDDLETON, R., Christchurch Earthquake Reconnaissance Part 1: The First 3 days [2011]. 1 fotograia, color. Disponível em:<http://reidmiddleton.wordpress.com/2011/03/14/5/>. Acesso em: 13 jan. 2013.
[2] FERREIRA, M. P., OLIVEIRA, D. R. C., Numerical Analysis of RC Flat Slabs under Flexure and Punching. IBRACON Structural Journal, Vol. 2, No. 3, 2006, pp. 371–392.
Figure 8 – Tendency of the results according to different theories
fib Model Code 2010 [6, 7] Level I fib Model Code 2010 [6, 7] Level II
a) fib Model Code 2010 [6, 7] Level II +(Bending Factor )
A
B
C
[4] Eurocode 2, Design of Concrete Structures—Part 1-1: Gen-eral Rules and Rules for Buildings, CEN, EN 1992-1-1, Brus-sels, Belgium, 2004, 225 pp.
[5] ACI Committee 318, Building Code Requirements for Structural Concrete (ACI 318M-11) and Commentary, American Concrete Institute, Farmington Hills, Michigan, 2011.
[6] Fédération Internationale du Béton (ib), Model Code 2010, inal draft, vol. 1. ib, Bulletin 65, Lausanne, Switzerland, 2012, Vol. 2, 350 pp.
[7] Fédération Internationale du Béton (ib), Model Code 2010,
inal draft, vol. 2. ib, Bulletin 66, Lausanne, Switzerland, 2012, Vol. 2, 370 pp.
[8] OLIVEIRA, D. R. C., Análise experimental de lajes cogu-melo de concreto armado com pilares retangulares. Tese de Doutorado, Publicação E.TD – 001A/2003, Departamento de Engenharia Civil, Universidade de Brasília, Brasília, DF, 2003. 214p.
[9] COLLINS, M.P. (2001). Evaluation of shear design proce-dures for concrete structures. A Report prepared for the CSA technical committee on reinforced concrete design.
Inluence of Column Rectangularity on the Behavior of Flat Plate Structures, ACI Special Publication, Cracking, Delec-tion, and Ultimate Load of Concrete Slab Systems, Vol. SP-30, No. 6, 1971, pp. 127–146.
[11] OLIVEIRA, D. R. C.; REGAN, P. E.; MELO, G. S. S., Punch-ing Resistance of RC Slabs with Rectangular Columns. Mag-azine of Concrete Research, Vol. 56, No. 3, London, 2004, pp. 123–138.
[12] MUTTONI, A., and SCHWARTZ, J., Behavior of Beams and Punching in Slabs without Shear Reinforcement, IABSE Col-loquium, Vol. 62, Zurich, Switzerland, 1991, pp. 703–708. [13] MUTTONI, A., Punching Shear Strength of Reinforced
Con-crete Slabs without Transverse Reinforcement, ACI Struc-tural Journal, Vol. 105, No. 4, 2008, pp. 440–450.
[14] FERNÁNDEZ RUIZ, M., MUTTONI, A., Applications of the critical shear crack theory to punching of R/C slabs with transverse reinforcement, ACI Structural Journal, Vol. 106, No. 4, 2009, pp. 485–494.
[15] SAGASETA, J., MUTTONI, A., FERNÁNDEZ RUIZ, M., TAS -SINARI, L., Non axis-symmetrical punching shear around internal columns of RC slabs without transverse reinforce-ment, Magazine of Concrete Research, Vol. 63, No. 6, 2011, pp. 441–457.
[16] Comité Euro-International du Béton. CEB-FIP Model Code 1990. London, Thomas Telford, 1993.
[17] SACRAMENTO, P. V. P., FERREIRA, M. P., OLIVEIRA, D. R. C., MELO, G. S. S. A., Punching strength of reinforced concrete lat slabs without shear reinforcement, IBRACON Structures and Materials Journal, Vol. 5, No. 5, 2012, pp. 659–691.
[18] OLIVEIRA, M. H., PEREIRA FILHO, M. J. M., OLIVEIRA, D. R. C., FERREIRA, M. P., MELO, G. S. S. A., Punching resis-tance of internal slab-column connections with
double-head-ed shear studs, IBRACON Structures and Materials Journal, Vol. 6, No. 5, 2013, pp. 681–714.
[19] FORSSEL, C., HOLMBERG, A., Stämpellast pa plattor av betong. Betong, 1946, Vol. 31, No. 2, pp. 95–123.
[20] ELSTNER, R. C., e HOGNESTAD, E., Shearing Strength of Reinforced Concrete Slabs. Journal of the American Con-crete Institute, Proceedings, Vol. 53, No. 1, Jul. 1956, pp. 29–58.
[21] MOWRER, R. D., VANDERBILT, M. D., Shear Strength of Lightweight Aggregate Reinforced Concrete. ACI Journal, 1967, Vol. 64, No. 11, November, pp. 722–729.
[22] REGAN, P. E., Punching Shear in Prestressed Concrete Slab Bridges. Polytechnic of Central London, January 1983. [23] REGAN, P. E., Symmetric Punching of Reinforced Concrete
Slabs. Magazine of Concrete Research, Vol. 38, No. 136, Sep. 1986, pp 115–128.
[24] REGAN, P. E., REZAI-JORABI, H., Shear Resistance of One-way Slabs Under Concentrated Loads. ACI Structural Journal, 1988, Vol. 85, No. 2, Mar-Apr, pp. 150–157. [25] TOMASZEWICZ, A., High-Strength Concrete. SP2 – Plates
and Shells. Report 2.3 Punching Shear Capacity of Rein-forced Concrete Slabs. Report No. STF70 A93082, SINTEF Structures and Concrete, Trondheim, 1993, 36pp.
[26] LEONG, K. K., TENG, S., Punching Shear Strength of Slabs with Openings and Supported on Rectangular Columns, Nanyang Technological University, Singapore, August 2000. [27] BORGES, L. L. J., Comportamento ao Puncionamento
de Lajes Cogumelo com Pilares Retangulares e Furos de Grandes Dimensões, Tese de Doutorado, Departamento de Engenharia Civil e Ambiental, Universidade de Brasília, DF, 2004.
[28] LIMA NETO, A. F., 2003. Análise experimental na fase pós-puncionamento de lajes cogumelo de concreto armado.
Table 4 – Classification according to the criteria of Collins [9]
< 0,50 [0,50:0,85] [0,85:1,15] [1,15:2,00] ≥ 2,00 TOTAL
ACI Nº of slabs 0 0 9 94 2 105
Total penalty 0 0 0 94 4 98
EC2 Nº of slabs 0 0 62 43 0 105
Total penalty 0 0 0 43 0 43
NB1 Nº of slabs 0 20 79 6 0 105
Total penalty 0 100 0 6 0 106
NB1*+ λ Nº of slabs 0 0 63 42 0 105
Total penalty 0 0 0 42 0 42
MC10 I Nº of slabs 0 3 26 67 9 105
Total penalty 0 15 0 67 18 100
MC10 II Nº of slabs 0 9 76 20 0 105
Total penalty 0 45 0 20 0 65
MC10 II+ λ Nº of slabs 0 2 73 30 0 105
Figure 9 – Tendency of the results according to different theories
Eurocode 2 [4]
NBR 6118 [3]
NBR 6118* [3] +Bending Factor ACI 318 [5]
B
C
Figure 10 – Tendency of the results according to different theories
fib Model Code 2010 [6, 7] - Level II
fib Model Code 2010 [6, 7] - Level II + Bending Factor fib Model Code 2010 [6, 7] - Level I
B
C
Dissertação de Mestrado. Publicação E. DM. 008A/2003. Departamento de Engenharia Civil e Ambiental, Universi-dade de Brasília. Brasília, DF.
[29] AL-YOUSIF, A. T., REGAN, P. E., Punching Resistances of RC Slabs Supported by Large and/or Elongated Columns. The Structural Engineer, London, Mar. 2003, p. 30-34. [30] FERREIRA, M. P. Análise experimental de lajes lisas
unidire-cionais de concreto armado ao puncionamento simétrico ou assimétrico. Dissertação de Mestrado, Publicação CDD-22. Ed. 624.18342, Departamento de Engenharia Civil, Univer-sidade Federal do Pará, Belém, PA, 2006.
[31] VILHENA, A. E. R., NAHUN, K. A. R., PERES, M. D., OLIVEIRA, D. R. C., Análise experimental de lajes unidire-cionais com pilares retangulares ao puncionamento simé-trico. In: 48º Congresso Brasileiro do Concreto, 2006. Rio de Janeiro.
[32] CARVALHO, A. S. de Análise Experimental de Laje Lisa de Concreto Armado de Alta Resistência com Metacaulim Apoiadas em Pilares Retangulares e Armada à Punção. De-partamento de Engenharia Civil, Universidade Federal do Pará, Dissertação de Mestrado, Belém, 2006.
[33] MOURO, V.C, Punção em lajes cogumelo: estudo de retan -gularidade dos pilares - 2006 dissertação de mestrado (Uni-versidade Federal de Goiás Escola de Engenharia Civil). [34] DAMASCENO, L.S. R, 2007. Análise experimental de lajes
lisas unidirecionais de concreto armado com pilares retan-gulares ao puncionamento. Dissertação de Mestrado. pub-licação CDD - 22. Ed. 624.1834. Universidade Federal do Pará, Instituto de Tecnologia, Departamento de Engenharia Civil, Programa de Pós-Graduação em Engenharia Civil, Belém, 2007.
[35] MORAES NETO, B. N., Análise Experimental de Lajes Lisas Bidirecionais de Concreto Armado com Estribos Inclinados e Pilares Retangulares Sujeitas a Puncionamento Simétrico Belém, Pará, 2007.
[36] MORAES NETO, B.N. (2013). Comportamento à Punção de Lajes Lisas em Concreto Reforçado com Fibras de Aço sob Carregamento Simétrico. Tese de Doutorado em Estru-turas e Construção Civil, Publicação E.TD-001A/13 Depar-tamento de Engenharia Civil e Ambiental, Universidade de Brasília, Brasília, DF, 343 p.
![Figure 1 – Punching shear failure of a flat slab floor (Middleton [1])](https://thumb-eu.123doks.com/thumbv2/123dok_br/18860852.417905/2.892.65.436.812.1129/figure-punching-shear-failure-flat-slab-floor-middleton.webp)
![Figure 4 – Bending factors for flat slabs (adapted from Oliveira [8])](https://thumb-eu.123doks.com/thumbv2/123dok_br/18860852.417905/4.892.72.831.177.490/figure-bending-factors-flat-slabs-adapted-oliveira.webp)
![Figure 6 – Effective depth of the slab (fib Model Code 2010 [6, 7])](https://thumb-eu.123doks.com/thumbv2/123dok_br/18860852.417905/6.892.59.836.175.381/figure-effective-depth-slab-fib-model-code.webp)

![Figure 7 – Tendency of the results according to different theories Eurocode 2 [4] NBR 6118* [3] +(Bending Factor )ACI 318 [5]NBR 6118 [3]B DAC](https://thumb-eu.123doks.com/thumbv2/123dok_br/18860852.417905/13.892.64.830.365.1143/figure-tendency-results-according-different-theories-eurocode-bending.webp)
![Table 4 – Classification according to the criteria of Collins [9]](https://thumb-eu.123doks.com/thumbv2/123dok_br/18860852.417905/15.892.68.826.235.569/table-classification-according-criteria-collins.webp)
