Cop
yright
© ABE&M t
odos os dir
eit
os r
eser
vados
.
Use of hemoglobin A1C to
detect Haitian-Americans with
undiagnosed Type 2 diabetes
Utilização de hemoglobina A1C no rastreamento de haitianos americanos com diabetes tipo 2 não diagnosticado
Joel C. Exebio1, Gustavo G. Zarini1, Joan A. Vaccaro1, Cristobal Exebio2, Fatma G. Huffman1
ABSTRACT
Objective: To evaluate the validity of hemoglobin A1C (A1C) as a diagnostic tool for type 2 diabetes and to determine the most appropriate A1C cutoff point for diagnosis in a sample of Haitian-Americans. Subjects and methods: Subjects (n = 128) were recruited from Miami-Dade and Broward counties, FL. Receiver operating characteristics (ROC) analysis was run in order to measure sensitivity and speciicity of A1C for detecting diabetes at different cutoff points. Results: The area under the ROC curve was 0.86 using fasting plasma glucose ≥ 7.0 mmol/L as the gold standard. An A1C cutoff point of 6.26% had sensitivity of 80% and speciicity of 74%, whereas an A1C cutoff point of 6.50% (recommended by the American Diabetes Association – ADA) had sensitivity of 73% and speciicity of 89%. Conclusions: A1C is a reliable alternative to fasting plasma glucose in detecting diabetes in this sample of Haitian-Americans. A cutoff point of 6.26% was the optimum value to detect type 2 diabetes. Arq Bras Endocrinol Metab. 2012;56(7):449-55
Keywords
Type 2 diabetes; hemoglobin A1C; diagnosis; Haitians
RESUMO
Objetivo: Avaliar a validade da hemoglobina A1C (A1C) como ferramenta para o diagnóstico de diabetes tipo 2 e determinar o ponto de corte mais apropriado para a A1C no diagnóstico de uma amostra de haitianos americanos. Sujeitos e métodos: Os sujeitos (n = 128) foram recruta-dos recruta-dos condarecruta-dos de Miami-Dade e Broward na Flórida. A análise ROC (Receiver operating cha-racteristics) foi feita de forma a medir a sensibilidade e especiicidade de A1C para a detecção do diabetes em diferentes pontos de corte. Resultados: A área sob a curva ROC foi 0,86 usando a glicemia de jejum ≥ 7,0 mmol/L como padrão-ouro. O ponto de corte de 6,26% para a A1C apresentou sensibilidade de 80% e especiicidade de 74%, enquanto o ponto de corte de 6,50% (recomendado pela American Diabetes Association – ADA) apresentou uma sensibilidade de 73% e especiicidade de 89%. Conclusões: A A1C foi uma alternativa coniável para a glicemia de jejum na detecção do diabetes nesta amostra de haitianos americanos. Um ponto de corte de 6,26% foi o valor ótimo para a detecção do diabetes tipo 2. Arq Bras Endocrinol Metab. 2012;56(7):449-55
Descritores
Diabetes tipo 2; hemoglobina A1C; diagnóstico; haitianos
1 Florida International University,
Department of Dietetics and Nutrition, Miami, FL, United States
2 Universidad Privada Antenor
Orrego, Department of Biostatistics, Trujillo, Peru
Correspondence to:
Fatma G. Huffman
Florida International University, Department of Dietetics and Nutrition, 11200
S. W. 8th Street, AHC I 435
33199 – Miami, FL, United States [email protected]
Received on Feb/11/2012 Accepted on Sept/2/2012
INTRODUCTION
T
raditionally, the diagnosis of diabetes has beenbased on plasma glucose. Both fasting plasma glu-cose (FPG) and oral gluglu-cose tolerance test (OGTT) have been widely used for more than three decades. However, both tests are inconvenient because they require fasting
of at least 8 hours and, in the case of the OGTT, staying in the clinical facility for a long period of time.
Cop
yright
© ABE&M t
odos os dir
eit
os r
eser
vados
.
before the measurement, and does not require fasting or any special preparation. In 2009, an International Expert Committee recommended the use of A1C to diagnose diabetes with a cutoff point of ≥ 6.5% (5). In 2010, the American Diabetes Association (ADA) adop-ted this criterion (6). However, it was recognized that A1C levels may vary according to the ethnicity (7).
Data revealed that different ethnic groups show va-riable sensitivity and speciicity for A1C. Variations may be related to genetic differences in hemoglobin concen-tration, glycation rates, and lifespan and number of red blood cells (8,9). When the recommended A1C cutoff point (≥ 6.5%) was tested in a sample representative of the general US population, sensitivity of A1C was lower compared with FPG. In fact, with this recommended cutoff point, A1C identiied 33% less cases of undiagno-sed diabetes than FPG ≥ 7.0 mmol/L (10). Therefore, an argument for population-speciic A1C cutoff points emerged, especially among high risk populations.
Haitians are one of those high risk populations. According to the International Diabetes Federation, the prevalence of T2D in Haiti was 7.2% for 20 to 79-year-olds in 2010 (11). Oficial data for Haitian--Americans (HA) are not available. A small sample (n = 51) collected in a Haitian community (Little Haiti) in the Miami-Dade County, FL, among Haitian immi-grants estimated a 33% prevalence of diabetes (12). Sin-ce acculturation may increase obesity rates in Haitian immigrants, prevalence of T2D is likely to be higher among them compared with Haitians living in Haiti. According to the US Census Bureau, there are 548,199 Haitians living in the US, 30% of whom reside in the Miami-Dade and Broward Counties, FL, making them the second largest immigrant group (behind Cubans) in those counties (13).
The aims of this study were to evaluate the validity of A1C as a diagnostic tool for T2D, and to determine the most appropriate A1C cutoff point for T2D diag-nosis in a sample of HA aged ≥ 35 years old, using the criteria of FPG ≥ 7.0 mmol/L as the cutoff point for diabetes diagnosis.
METHODS
Parent study
Participants
Our current study used male and female adults, ≥ 35 years, who were not diagnosed with diabetes in the
pa-rent, case/control study of HA with T2D (n = 130), and without diabetes (n = 129). To be considered a HA, respondents needed to self-report having two pa-rents born in Haiti. The candidates were screened by a trained interviewer, who was familiar with Haitian culture and who spoke English and Creole. Questions concerning length of stay in the United States and pla-ce of birth were asked to candidates who qualiied. The target population was recruited to achieve suficient power (80%) to determine a medium effect (≥ 0.50) size in cardiovascular disease risk factors and to distin-guish differences among 4 groups (gender and two age categories) for cases (with diabetes) and controls (wi-thout diabetes).
It was determined that 240 participants (30 partici-pants per four groups with diabetes, n = 120, and wi-thout diabetes, n = 120) would be suficient, based on our previous studies in other populations and by using Cohen’s rule of thumb (n = 30 per group) (14). Since we anticipated cases of undiagnosed diabetes, the target sample size was increased to accommodate reclassiica-tion and possible missing data.
Data collection for the parent study
Recruitment was conducted by alternating between se-lecting potential subjects with and then without T2D. Recruitment of HA participants (n = 259) was from community-based sources: (a) Local diabetes educators & community health practitioners in Miami-Dade and Broward Counties (several local diabetes educators who were either former students or in close contact with the Department of Dietetics and Nutrition at Florida Inter-national University-FIU; oficial letters of invitation ou-tlining the study mailed to the diabetes educators and health professionals in Miami-Dade and Broward county areas requesting their cooperation in recruiting indivi-duals); (b) FIU faculty, staff and students (invitational lyers were distributed to all university faculty, staff and students using the university-wide e-mail system and ex-plaining the research protocol and requesting their assis-tance in the study); (c) Several residential rental facilities also agreed to help in the recruitment process; (d) Adver-tisements (printed ads were placed in local Haitian news-papers and principal gathering places of these groups, such as churches, supermarkets, and restaurants; radio advertisement on local Creole stations was also aired).
Cop
yright
© ABE&M t
odos os dir
eit
os r
eser
vados
.
recruit participants stopped. Interested participants were initially interviewed on the phone. At that mo-ment, the study purpose was explained and the age and gender of the responders were determined. To ascer-tain T2D status, each participant who self-reported ha-ving diabetes was asked for age of diagnosis and initial treatment modalities. Exclusion criteria were belonging to any other ethnicity, age < 35 years old, pregnant or lactating women. If a subject was determined to be eligible, then his or her participation was requested at the Human Nutrition Laboratory at FIU. Participants were instructed to refrain from smoking, consuming any food or beverages except water, and engaging in any unusual exercise for at least eight hours prior to blood collection.
This study was approved by the Institutional Re-view Board at FIU. The purpose and protocol of the study were explained to the subjects, and their written consent, either in English or Creole, was obtained be-fore the study began. Laboratory results showed that ifteen participants who reported not having diabetes were reclassiied as having T2D according to FPG ≥ 7.0 mmol/L. These participants were given their labo-ratory results and referred to their physicians.
Present study
For the present study data analysis, subjects who repor-ted previous diagnosis of diabetes (n = 130) or were missing values for A1C (n = 1) were excluded. A to-tal of 128 participants were included in the analysis of the data. Subjects who reported previous diagnosis of diabetes were excluded from our analysis because they were taking medication that decreased their FPG below the threshold of diagnosis, which is, in fact, the goal of the diabetes treatment.
Measures
Twenty mL of venous blood were collected from each subject after an overnight fast (at least 8 hours) by a certiied phlebotomist using standard laboratory tech-niques. Blood samples were collected in two tubes: a Vaccutainer Serum Separator Tube (SST) for analysis of glucose, and another tube containing ethylenedia-mine tetra-acetic acid (EDTA) to analyze A1C. After complete coagulation (30-45 minutes), SST was centri-fuged at 2,500 RPM for 30 minutes. Serum was trans-ferred from SST into labeled plastic tubes for glucose analysis. Glucose levels were measured by hexokinase
enzymatic methods. A1C percentages were measu-red in whole blood with close tube sampling (CTS), in duplicate (CV < 1.7%), with the Roche Tina Quant Second Generation A1C (AC1-2) immunoassay me-thod of Laboratory Corporation of America, Miami,
FL (LabCorp®). The immunoassay method expresses
A1C as a percent of total hemoglobin (Hb); whereas High Pressure Liquid Chromatography (HPLC) ex-presses A1C as a percent of total HbA. Since amino acids substitution in HbS and HbC (the most common variants of A1C) are close to the glycated N-terminus, it is possible to overestimate A1C; however, several studies have found comparable results using standard techniques (15-17). The system used for our assays has matched the National Glycohaemoglobin Standardi-zation Program (NGSP) against the Hb variants and has been certiied to follow The Diabetes Control and Complications Trial (DCCT) (15,16). Moreover, our immunoassay method has been validated against boro-nate-afinity HPLC in two groups of African American patients, one with hemoglobinopathy and another wi-thout hemoglobinopathy, and whose A1C < 7.0% (17).
Statistical analysis
Data were divided into three categories according to the current ADA classiication (6): normal FPG (< 5.6 mmol/L), impaired fasting glucose (IFG) (5.6-6.9 mmol/L), and undiagnosed diabetes (≥ 7.0 mmol/L). Percentages of subjects above A1C cutoff points among the three categories were compared using bar graphs. Mean A1C for subjects with normal FPG (< 5.6 mmol/L) was computed. Sensitivity and speciicity were evaluated at 1, 2, 3, and 4 standard deviations above this mean. Also, the cutoff point recommended by the ADA for diabetes diagnosis was plotted in the analysis (A1C ≥ 6.5%). The ADA criterion for diagno-sing diabetes with FPG ≥ 7.0 mmol/L was considered the gold standard.
Receiver operating characteristics (ROC) analysis was run in order to measure sensitivity and speciicity of A1C in detecting diabetes at different cutoff points, and to determine the best predictive cutoff value (18). Sensitivity is the proportion of subjects at or above the A1C cutoff point who have diabetes (FPG ≥ 7.0 mmol/L). Speciicity is the proportion of individuals with A1C level below the cutoff point who do not have diabetes (FPG < 7.0 mmol/L). The ROC curve plots
Cop
yright
© ABE&M t
odos os dir
eit
os r
eser
vados
.
The greater the area under the curve (AUC), the better the prediction value of A1C for detecting diabetes. An AUC of 0.5 means no prediction value, whereas a value of 1.0 means perfect prediction value. Statistical analy-sis was run using SPSS 18.0 (Chicago).
RESULTS
Participants were all born in Haiti and reported mi-grating to the United States. There was no signiicant difference in the length of stay (less than 10 years) for those with undiagnosed diabetes compared with
tho-se without diabetes (20.0% and 30.9% respectively, P=
0.550). The linear correlation between A1C and FPG
was highly signiicant (P < 0.001), with a correlation
coeficient of 0.75. Mean A1C for participants with normal FPG, IFG and diabetes were 5.8 ± 0.46%, 6.1
± 0.47%, and 7.6 ± 1.75%, respectively (P< 0.001). No
signiicant differences were found for age, gender, body mass index (BMI), and waist circumference among the three categories. These values were 52.5 ± 10.5 years,
51% female, 28.6 ± 4.6 kg/m2, and 95.6 ± 12.1 cm for
normal FPG (n = 75); 57.3 ± 10.6 years, 50% female,
29.3 ± 5.7 kg/m2, and 96.8 ± 14.1 cm for IFG (n =
38); 53.2 ± 13.5 years, 40% female, 30.1 ± 5.9 kg/m2,
and 97.9 ± 11.6 cm for subjects with T2D (n = 15). Cutoff points were determined using mean A1C for participants with normal FPG and adding 1, 2, 3, and 4 standard deviations. These points were 6.26%, 6.72%, 7.18%, and 7.64% respectively. In addition, the cutoff point recommended by the ADA (A1C ≥ 6.5%) was also evaluated. Figure 1 shows the percentage of the population at or above speciic cutoff values. Thirty--two percent of the population had A1C levels at or above 6.26% and 18.8% had A1C levels at or above 6.50%. A total of 44.7% of subjects with IFG and 80% with undiagnosed diabetes were detected with an A1C cutoff point of 6.26%. Similarly, 18.4% of subjects with IFG and 73.3% of participants with undiagnosed dia-betes were detected with an A1C cutoff point of 6.50% (recommended by the ADA).
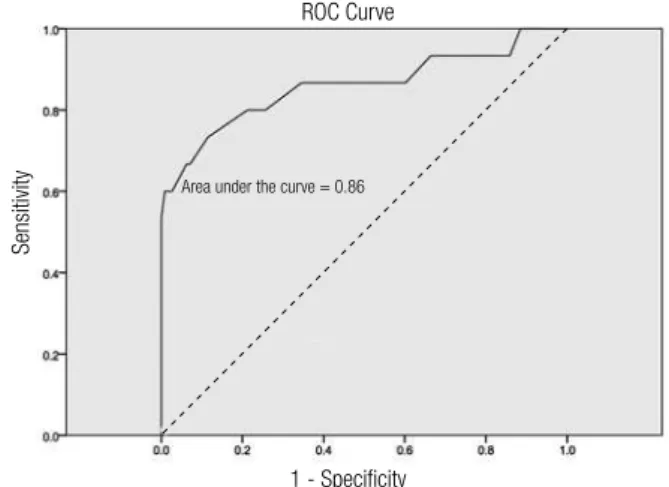
In this speciic population, A1C showed a high pre-dictive value for detecting undiagnosed diabetes. The area under the ROC curve was 0.86 (Figure 2). In addition, an A1C cutoff point of 6.26% had sensitivity of 80% and speciicity of 74%, whereas an A1C cutoff point of 6.50% had sensitivity of 73% and speciicity of 89%. Sensitivity decreased as speciicity increased with every increasing cutoff value (Table 1).
Table 1. Sensitivity and speciicity of A1C for detecting undiagnosed diabetes in Haitian-Americans (fasting plasma glucose ≥ 7.0 mmol/L) at increasing A1C cutoff points
A1C cutoff (%) Sensitivity Speciicity
6.26 80 74
6.50 73 89
6.72 60 97
7.18 47 100
7.64 33 100
Data are %. Sensitivity: 100 X TP/(TP + FN). Speciicity: 100 X TN/(TN + FP).
TP: true positive (above the cutoff level for A1C and FPG ≥ 7.0 mmol/L); FN: false negative (below the cutoff level for A1C and FPG ≥ 7.0 mmol/L); TN: true negative (below the cutoff level for A1C and FPG < 7.0 mmol/L); FP: false positive (above the cutoff level for A1C and FPG < 7.0 mmol/L).
Figure 1. Percentage of Haitian-Americans aged ≥ 35 years old at different A1C cutoff points.
Figure 2. Continuous line: ROC curve for A1C as a diagnostic indicator for diabetes (fasting plasma glucose ≥ 7.0 mmol/L). Dotted line: Diagonal indicating area under the curve = 0.50.
DISCUSSION
TheADA has adopted A1C as a valid diagnostic tool for
diabetes on the basis that the test is now standardized, does not require fasting, has less intra-individual varia-bility than FPG, and is not affected by stress or illness.
Haitian-American population (%)
A1C (%) cutoff points
1 - Speciicity ROC Curve
Sensitivity
Cop
yright
© ABE&M t
odos os dir
eit
os r
eser
vados
.
The recommended cutoff value for diabetes diagnosis has been set at A1C ≥ 6.5% (6). In a recent study using data from the National Health and Nutrition Exami-nation Survey (NHANES), A1C ≥ 6.5% detected only 30% of the subjects with undiagnosed diabetes. In addi-tion, 19% of subjects with undiagnosed diabetes were detected by both FPG and OGTT, but not by A1C. Si-milarly, 1% of the population previously diagnosed with diabetes, but who has not taken medication yet, was not detected by A1C (10). These results from a sample representative of the national US population demons-trate that the arbitrary cutoff point of 6.5% should be considered with caution.
Studies from several countries have documented that different ethnicities have different A1C values (1-4,8). High sensitivity is important for minorities, even at the expense of lower speciicity, in order for cases to be discovered. In the US, the Diabetes Prevention Pro-gram has shown that African Americans and Hispanics with impaired glucose tolerance (IGT) had higher A1C values compared with non-Hispanic Whites with IGT, even after adjusting for confounding variables. This in-ding may be explained by other factors that are not re-lated to glucose control such as hemoglobin glycation rate or red blood cell survival time (9).
In our sample, mean A1C for subjects with normal FPG (FPG < 5.6 mmol/L) was 5.8% ± 0.46%, which is higher compared with other populations. For instance, in data obtained from the NHANES III, mean for sub-jects with normal FPG was 5.17% ± 0.45% (19). The difference is even greater if we take into consideration that, in this study, normal FPG was deined as FPG < 6.1 mmol/L, which may have increased mean A1C compared with a cutoff of FPG < 5.6 mmol/L. Means for the US population without diabetes are usual ly hi-gher because they include people with normal and high FPG. However, they are still lower than that found in our sample for subjects with normal FPG. For instan-ce, the overall mean A1C found in the NHANES for non-Hispanic Whites, non-Hispanic Blacks and Mexi-can AmeriMexi-cans without diabetes were 5.3 ± 0.01, 5.4 ± 0.01, and 5.4 ± 0.01%, respectively (20). From these results, it is inferred that even in the presence of nor-mal FPG, A1C levels were elevated in our sample of HA compared with the US population without dia-betes. Furthermore, 32% of HA without diabetes had A1C levels greater than 6.26%. In the NHANES, only 2.9% of the US population without diabetes had A1C greater than 6.1% (20). Therefore, in this particular
sample, there is a considerable proportion of HA with high A1C compared with the general US population without diabetes.
In our sample, A1C showed high predictive value in detecting undiagnosed T2D (AUC = 0.86). However, our optimal cutoff point differs from the one suggested by the ADA. Since the mean for normal subjects ± 1SD is considered normal range in any test (5.8 ± 0.46% in our sample), any value that is above the normal range should be considered abnormal (> 6.26% for our sam-ple). This is further conirmed by the ROC analysis. Using an A1C cutoff point of 6.26% (1 SD above the mean for participants with normal FPG) we had 80% sensitivity and 74% speciicity. Applying the A1C cutoff point of 6.5% adopted by the ADA, we had 73% sensiti-vity and 89% speciicity. The cutoff point recommended by the ADA had lower sensitivity but higher speciicity. This issue was addressed by the International Expert Committee who recommended the cutoff point (5). The argument was that speciicity is more important than sensitivity because diagnosing subjects as positive when in fact, they are not, will be costly for the health system. While this may be true for the general popu-lation, in minorities like HA with a high prevalence of T2D and a high rate of poverty, the cost of complica-tions caused by undiagnosed diabetes may offset the cost related to false positives.
This is further conirmed by studies in different high risk populations around the world that suggest ei-ther ≥ 6.1% or ≥ 6.2% as the optimum cutoff point for diabetes diagnosis (1-4,21-23) and by the low sensitivi-ty found for A1C when the recommended cutoff point was applied to general US population (10). It should also be noted that 44.7% of the participants with IFG were detected by the 6.26% cutoff point, which indica-tes that a much lower cutoff value should be used for that purpose in this particular sample.
Cop
yright
© ABE&M t
odos os dir
eit
os r
eser
vados
.
investigators found that intermediate A1C (5.5%-6.0%) could exclude diabetes for persons in the moderate, but not in the high risk groups (24). Since minorities such as HA are at high risk for diabetes, lower A1C cutoffs would increase sensitivity at the expense of lower speci-icity. The fact that A1C levels indicating high glycemia are positively correlated with microvascular complica-tions (24) offsets the expense of false diagnoses.
The new diagnostic criterion will have important public health implications for high risk populations. Ac-cording to our data, a considerable proportion of HA in our sample will be missed by the established cutoff point and will be left without treatment. It is imperative to have deined speciic cutoff points, to explain why HA in our sample have high A1C even in the presence of normal FPG, and to examine how the rates of com-plications are related to A1C levels in this population.
The prevalence of undiagnosed diabetes was 11.7% (15/128) in this study. Several limitations need to be noted. Our sample may not represent the HA popula-tion in Miami-Dade County due to the small sample size and selection bias. HA who were willing to parti-cipate in a study that involved revealing social informa-tion and drawing blood may have different risk factors compared with those HA who were asked to participa-te, but refused. Although community leaders generally have access to hard-to-reach HA, they may have selecti-vely approached HA with more cooperative social cha-racteristics. Another limitation of this study was that data was taken in a single time-point. As such, temporal changes in Miami-Dade County were not taken into account.
Technical limitations existed, as well. Although FPG is the gold standard, the ADA recommends that two tests are used for accuracy, and only one measure was taken in this study. Regarding interference of hemo-globin variants, the most common variant for our po-pulation would be the HbC or the HbS trait, if HA were sampled in the “Black, non-Hispanic” category (25). The National Diabetes Clearinghouse (NIDC) estimates 8% of African Americans have the HbS trait and 2.3% have the HbC trait (26). Even though the immunoassay method used to assess A1C was validated against ion-exchange HPLC, HbS or HbC are close to the glycated N-terminus and interference resulting in higher readings cannot be completely ruled out (17). However, interference of the HbS or HbC traits are most likely to be found at the extremely high A1C va-lues (17).
Relative contributions of fasting and postprandial hyperglycemia were found to vary across A1C quintiles in a study by Monnier and cols. (27). However, fasting hyperglycemia was critical for A1C values above 8.4%, since postprandial exposure remains stable in the three upper quintiles (27). Three categories were compared in our analysis: normal, IFG, and undiagnosed T2D using FPG. As A1C values were also from fasting blood samples, postprandial glucose levels would not be an issue in the determination of cutoff points.
A1C may be useful in detecting diabetes in com-munity settings among HA. A positive test should be conirmed by fasting plasma glucose or a second A1C reading. However, our study with only one A1C and FPG reading mimics a common decision-making prac-tice for diabetes diagnosis among this particular hard--to-reach population.
In our study, A1C showed a high predictive value for detecting undiagnosed diabetes in HA. A cutoff point of 6.26% (1 SD above the mean for subjects with normal FPG) was the optimum value to detect undiag-nosed T2D in this particular sample. Larger cross-sec-tional and prospective longitudinal studies are needed to conirm these results.
Acknowledgments: Funding for this research was provided by The National Institute of Health (NIH), National Institute of Diabetes and Digestive and Kidney Diseases (NIDDK), and is supported by grant NIH/MBRS/SCORE AC# 124401529/42 and NIH/NIDDK AC# 5SC1DK083060-01.
Disclosure: no potential conlict of interest relevant to this article was reported.
REFERENCES
1. Colagiuri S, Cameron A, Hussain Z, Shaw J, Zimmet P. Screening for type 2 diabetes and impaired glucose metabolism: the Austra-lian experience. Diabetes Care. 2004;27:367-71.
2. Mannucci E, Ognibene A, Sposato I, Brogi M, Gallori G, Bardini G, et al. Fasting plasma glucose and glycated haemoglobin in the screening of diabetes and impaired glucose tolerance. Acta Diabetol. 2003;40:181-6.
3. Tavintharan S, Chew LSW, Heng DMK. A rationale alternative for the diagnosis of diabetes mellitus in high risk individuals. Ann Acad Med Singapore. 2000;29:213-8.
4. Ko GTC, Chan JCN, Yeung VTF, Chow CC, Tsang LWW, Li JKY, et al. Combined use of a fasting plasma glucose concentration and HbA1c or fructosamine predicts the likelihood of having diabetes in high-risk subjects. Diabetes Care. 1998;21:1221-5.
5. International Expert Committee: International Expert Committee report on the role of the A1C assay in the diagnosis of diabetes. Diabetes Care. 2009;32:1327-34.
Cop
yright
© ABE&M t
odos os dir
eit
os r
eser
vados
.
7. American Diabetes Association: Standards of Medical Care in Diabetes 2011. Diabetes Care. 2011;34 (Suppl. 1):S11-61.
8. Anand SS, Razak F, Vuksan V, Gerstein HC, Malmberg K, Yi Q, et al. Diagnostic strategies to detect glucose intolerance in a multi--ethnic population. Diabetes Care. 2003;26:290-6.
9. Herman WH, Ma Y, Uwaifo G, Haffner S, Kahn SE, Horton ES, et al. Differences in A1C by race and ethnicity among patients with impaired glucose tolerance in the Diabetes Prevention Program. Diabetes Care. 2007;30:2453-7.
10. Cowie CC, Rust KF, Byrd-Holt DD, Gregg EW, Ford ES, Geiss LS, et al. Prevalence of diabetes and high risk for diabetes using hemo-globin A1C criteria in the US population in 1988-2006. Diabetes Care. 2010;33:562-8.
11. Prevalence Estimates of Diabetes Mellitus 2010. International Dia-betes Federation, 2000. Available from: http://archive.diaDia-betesa- http://archive.diabetesa-tlas.org/content/nac-data. Accessed on: Jan 4, 2012.
12. Rosen A, Sharpe I, Rosen J, Doddard M, Abad M. The prevalence of type 2 diabetes in the Miami-Haitian community. Ethnic Dis. 2007;17:S3-4.
13. US Census Bureau. Census 2000 Summary File 4. Selected po-pulation proile: Haitians. Washington, DC, US Census Bureau, 2000. Available from: http://factinder2.census.gov. Accessed on: Jan 4, 2012.
14. Cohen J. Statistical power analysis for the behavioral sciences. 2nd ed. Hillsdale, NJ: Erlbaum; 1988.
15. Flemming JK. Evaluation of HbA1c on Roche COBAS Integra 800 closed tube system. Clin Biochem. 2007;40:822-7.
16. National Glycohemoglobin Standardization Program. List of NGSP certiied methods. Available from: http://www.ngsp.org/ docs/methods.pdf. Accessed on: May 7, 2012.
17. Abedie JM, Koelsch AA. Performance of the Roche Second Gene-ration Hemoglovin A1c Immunoassay in the presence of Hb-S or Hb-C Traits. Ann Clin Lab Sci. 2008;38(1):31-6.
18. Beck JR, Shultz EK. The use of relative operating characteristic (ROC) curves in test performance evaluation. Arch Pathol Lab Med. 1986;110:13-20.
19. Rohling CL, Little RR, Wiedmeyer HM, England JD, Madsen R, Harris MI, et al. Use of GHb (HbA1c) in screening for undiagnosed diabetes in the US population. Diabetes Care. 2000;23(2):187-91. 20. Selvin E, Zhu H, Brancati FL. Elevated A1C in adults without a
history of diabetes in the US. Diabetes Care. 2009;32(5):828-33. 21. Jesudason DR, Dunstan K, Leong D, Wittert GA. Macrovascular
risk and diagnostic criteria for type 2 diabetes. Implications for the use of FPG and HbA1c for cost-effective screening. Diabetes Care. 2003;26:485-90.
22. Herdzik E, Safranow K, Ciechanowski K. Diagnostic value of fas-ting capillary glucose, fructosamine and glycosylated haemo-globin in detecting diabetes and other glucose tolerance abnor-malities compared to oral glucose tolerant test. Acta Diabetol. 2002;39:15-22.
23. Tanaka Y, Atsumi Y, Matsuoka K, Mokubo A, Asahina T, Hosoka-wa K, et al. Usefulness of stable HbA1c for supportive marker to diagnose diabetes mellitus in Japanese subjects. Diabetes Res Clin Pract. 2001;53:41-5.
24. Ginde AA, Cagliero E, Nathan DM, Camargo CA. Value of risk stratiication to increase the predictive validity of HbA1c in scree-ning for undiagnosed diabetes in the US population. J Gen Intern Med. 2008;23(9):1346-59.
25. Little RR, Roberts WL. A review of variant hemoglobins inter-fering with hemoglobin A1c measurement. J Diab Sci Tech. 2009;3(3):446-51.
26. National Diabetes Clearinghouse (NDIC). A service of the Na-tional Institute of Diabetes and Digestive and Kidney Diseases (NIDDK), National Institutes of Health (NIH). Sickle Cell Trait and Other Hemoglobinopathies and Diabetes: Important Information for Physicians. Available from: http://diabetes.niddk.nih.gov/dm/ pubs/hemovari-A1C/#hemoglobinopathies. Accessed on: Apr 21, 2012.