*Correspondence: M. Estanqueiro. Centro de Investigação em Tecnologia Farmacêutica, Laboratório de Tecnologia Farmacêutica, Departamento das Ciências do Medicamento, Faculdade de Farmácia da Universidade do Porto. Rua de Jorge Viterbo Ferreira, 228, 4050-313 – Porto - Portugal. E-mail: [email protected]
A
vol. 50, n. 3, jul./sep., 2014 http://dx.doi.org/10.1590/S1984-82502014000300018
Use of solid dispersions to increase stability of dithranol in topical
formulations
Marilene Estanqueiro
*, Jaime Conceição, Maria Helena Amaral, José Manuel Sousa Lobo
Research Centre for Pharmaceutical Technology, Laboratory of Pharmaceutical Technology, Department of Drug Sciences, Faculty of Pharmacy, University of Porto
The present study was planned to improve the stability of dithranol using solid dispersions (SD). Two different SD at a 1:9 ratio of dithranol/excipient were prepared: one of them using glyceryl behenate as excipient and the other using a mixture of argan oil with stearic acid (1:8 ratio) as excipient. Pure dithranol and SD of dithranol were incorporated in an oil-in-water cream and in a hydrophobic ointment in a drug/ dermatological base ratio of 1:10. The physical and mechanical properties of semisolid formulations incorporating the pure drug and the developed SD were evaluated through rheological and textural analysis. To evaluate the stability, L*a*b* color space parameters of SD and semisolid formulations, and pH of
hydrophilic formulations were determined at deined times, during one month. Each sample was stored
at different conditions namely, light exposure (room temperature), high temperature exposition (37 °C)
(protected from light) and protected from light (room temperature). Despite higher values of irmness and
adhesiveness, hydrophobic ointment exhibited the best rheological features compared to the oil-in-water cream, namely a shear-thinning behavior and high thixotropy. These formulations have also presented more stability, with minor changes in L*a*b* color space parameters. The results of this study indicate that is possible to conclude that the developed SD contributed to the increased stability of dithranol.
Uniterms: Dithranol/stability. Topical formulations/development. Solid dispersions/preparation. Stearic acid. Glyceryl behenate. Argan oil.
Este trabalho teve como objetivo aumentar a estabalidade do ditranol através da preparação de dispersões sólidas (DS). Prepararam-se duas DS diferentes em proporção de 1:9 de ditranol/excipiente: em uma das DS utilizou-se beenato de glicerila como excipiente e na outra se utilizou mistura de óleo de argan com ácido esteárico (razão 1:8). Posteriormente, efetuou-se a incorporação de ditranol puro
e das DS contendo este fármaco num creme hidróilo ou óleo-água (O/A) e em pomada hidrófoba, na
proporção 1:10 (fármaco ou respetivas DS/base dermatológica). As propriedades físicas e mecânicas das formulações semissólidas incorporando fármaco ou as respetivas DS previamente desenvolvidas, foram avaliadas através da análise do comportamento reológico e das propriedades de textura. Para avaliar a estabilidade, os parâmetros do espaço de cor L*a*b* das DS e das formulações semissólidas e o pH
das preparações hidróilas foram determinados em períodos de tempo deinidos, durante um mês para cada amostra armazenada sob diferentes condições, especiicamente, exposição à luz (à temperatura
ambiente), protegidas da luz à temperatura elevada (37 °C) e protegidas da luz (temperatura ambiente).
Embora tenham apresentado valores de irmeza e de adesividade mais elevados, as pomadas hidrófobas
apresentaram melhores características reológicas do que os cremes óleo-água. Além disso, as pomadas hidrófobas também apresentaram melhor estabilidade, com pequenas alterações nos parâmetros do espaço
de cor L*a*b*. Os resultados deste trabalho permitiram concluir que as DS desenvolvidas contribuíram
para o aumento da estabilidade do ditranol.
INTRODUCTION
Psoriasis is a chronic multisystem inflammatory
disorder with signiicant co-morbidities and also profound
physical, emotional and social impacts on quality of life (Dvorakova, Markham, 2013). It is clinically characterized by erythematous, sharply demarcated papules and rounded plaques, covered by silvery scale and epidermal hyper proliferation (Christophers, 2001).
Dithranol (1,8-dihydroxy-9-anthrone, anthralin or cignolin) is an effective drug for the treatment of chronic stable plaque psoriasis and has been used to treat various psoriatic disorders for many years (Dvorakova, Markham, 2013). Despite being effective and safe, its application is
dificult and troublesome owing to its irritating, burning,
staining and necrotizing effects on the normal as well as the diseased skin. Furthermore, this drug is highly lipophilic, poorly water soluble and unstable as it gets readily photo-oxidized (Mustakalio, 1981; Wang et al., 1987).
Dithranol oxidation is enhanced by day light, ultraviolet (UV) light, exposure to air and molecular oxygen and temperature increase (Mahrle, 1997). This drug readily undergoes oxidation to a range of degradation products, including danthron and dithranol dimmer, which are thought to contribute to the undesired effects and are inactive or less active in terms of anti-psoriatic potency (Thoma, Holzmann, 1998; Mahrle, 1997). Dithranol has a yellow color, while its oxidation products are brown to black (Ashton, Andre, Lowe, 1983; Wiegrebe, Plumier, Mayer, 1985). So, the color can be a good parameter to study the stability of new formulations.
The investigation of the influence of light on the stability of drugs has gained importance in recent years. For a variety of active substances, a considerable instability
under the inluence of light has been proved (Carlotti et al., 2009). Although the semisolid topical formulations are protected by their packaging, light-induced degradation may occur during production or after application on the skin. As dithranol is very unstable, it seemed necessary to
investigate its behavior under the inluence of light and
temperature (Thoma, Holzmann, 1998).
Various authors have already studied novel carriers intended to stabilize dithranol, like solid lipid nanoparticles (SLN) prepared by pre-emulsion followed by ultrasonication (Gambhire, Bhalekar, Shrivastava, 2012); phospholipid microemulsion (Raza et al., 2011); SLN prepared by solvent injection technique (Carlotti et al., 2009) and liposomes (Mahrle et al., 1991).
Solid dispersion (SD) is deined as the dispersion
of one or more active ingredients in an inert hydrophilic
carrier or matrix in a solid state, prepared by melting, using solvents or by a solvent-melting method (Chiou, Riegelman, 1971). Although there is ample use of water soluble carriers with no intrinsic solubilizing properties such as high molecular weight polyethylene glycols (PEG) and polyvinylpyrrolidones (PVP), the use of lipid based carriers with solubilizing properties has also attracted much interest recently (Serajuddin, 1999). This technique allows for reducing particle size to a nearly molecular level (Krishnamoorthy, Suchandrasen, Prasad, 2012). Several advantages of SD include the uniform and homogeneous distribution of small quantities of drug in the solid state, the stabilization of unstable drugs, the dispersion of liquid or gaseous compounds and the production of prolonged release systems (Almeida, Amaral, Lobão, 2012). The present study aims to develop solid lipid dispersions with dithranol and evaluates drug stability, through color evaluation. The stability of two different semisolid formulations that incorporate SD was evaluated. Since the properties of topical formulations have a major impact on patient compliance with treatment (Fouéré, Adjadj, Pawin, 2005; Brown, Rehmus, Kimball, 2006; Devaux
et al., 2012), textural and rheological characterization of semisolid formulations were performed.
MATERIAL AND METHODS
Material
Dithranol (Lot. No. 04JP19, Roig Farma, Spain),
stearic acid (Lot.No. L12020240-OF-5419A, Fagron,
Spain), argan oil (Lot.No. 121111-P-4, Acofarma, Spain),
glyceryl behenate (Compritol E ATO) (Lot. No. 108540,
Gattefossé, France), sodium lauryl sulphate (Lot. No. 18622400, José M. Vaz Pereira, Portugal), cetyl alcohol (Lanette 16) (Lot. No. 5383040010, José M. Vaz Pereira, Portugal), white petrolatum (Lot. No. L12120119, Fagron, Spain), liquid paraffin (Lot. No. 122403-P-1, Acofarma, Spain), glycerin (Lot. No. 12A31-B11-268316, Fagron, Spain) and methylparaben (Nipagin M) (Lot. No. GB6A039548, José M. Vaz Pereira, Portugal).
Methods
Excipient melting (variable temperature according to the melting point of the excipients) on a hot plate with stirring was used, followed by addition of dithranol to the
excipient, and then cooled until solidiied, when it was
ground with pestle and mortar.
SDs with particle size less than 180 µm were
incorporated in an oil-in-water (O/W) cream and in a
hydrophobic ointment in a drug/dermatological base ratio of 1:10, using a mechanical stirrer. Additionally, the same formulations with 1% (w/w) of pure dithranol were prepared. The qualitative and quantitative composition of the different developed formulations is presented in Table I.
Preparation of O/W cream and hydrophobic ointment
O/W cream was prepared by heating the aqueous and
oily phases at 60-70 °C. When the two phases were at the same temperature, the aqueous phase was slowly added to the oily phase, at a stirring speed of 500-600 rpm. Stirring was maintained until cooling.
Hydrophobic ointment was prepared by mechanical
stirring of white petrolatum with liquid parafin.
Textural analysis
The textural analysis was performed using a texturometer (Stable Micro Systems, TA-XT2i, UK) by carrying out a penetration test using a load cell of 5 kg, a cylindrical probe with 13 mm diameter (25 mm in the case of FD formulation), a penetration depth of 5 mm, a test speed of 3 mm/s and a trigger force of 0.049 N. After penetrating the sample, the probe returned to a position 50 mm above the platform surface. From the obtained graphic force versus
distance, the maximum force (irmness) and the negative
area (adhesiveness) were calculated. All the measurements were performed in triplicate.
The spreadability was performed using the same test; a TTC spreadability probe, a penetration depth of 23 mm, a test speed of 3 mm/s and a post-test speed of 10.0 mm/s. In this test, the sample was placed into the female cone, avoiding the incorporation of air. The sample surface was leveled, the probe was placed at a defined position (25 mm) and the assay began with the male cone downward (23 mm penetration and 3 mm/s speed), which spread the sample between the surfaces of the two cones.
Rheological analysis
Rheological analysis was performed on a rotational
viscometer HAAKE Viscotester 550 (Thermo Scientiic,
Germany), with a coaxial cylinder sensor SV-DIN. The flow behavior was studied by continuous shear investigations, which were performed in order to evaluate the shear stress (Pa) as a function of shear rate (s-1). The
study was started with a shear rate of 1 s-1 up to a maximum
of 500 s-1 and back to 1 s-1, and the resulting shear stress
was measured. To reduce the influence of temperature on the rheological behavior, a thermostatic water bath was used to accurately maintain the sample temperature (20 °C) during all experiments.
Color evaluation
Since dithranol is a very unstable drug and its degradation products confer a formulation change in color, the stability of solid dispersions and respective semisolid formulations were evaluated by color measurements.
The samples of each semisolid formulation and solid dispersion were maintained at different conditions, namely,
TABLE I – Composition of different formulations with dithranol, SD of dithranol in stearic acid and argan oil (SD SA) and SD
of dithranol in glyceryl behenate (SD C). FD, FSA and FC corresponds to the O/W cream with pure dithranol, SD SA and SD C,
respectively; HD, HSA and HC, corresponds to the hydrophobic ointment with pure dithranol, SD SA and SD C, respectively
Composition FD FSA FC HD HSA HC
Dithranol 1 - - 1 -
-SD SA - 10 - 10
-SD C - - 10 - - 10
Sodium lauryl sulphate 0.99 0.9 0.9 - -
-Cetyl alcohol 8.91 8.1 8.1 - -
-White petrolatum 4.95 4.5 4.5 93.5 85 85
Liquid parafin 9.9 9.0 9.0 5.5 5 5
Glycerin 9.9 9.0 9.0 - -
-Methylparaben 0.099 0.09 0.09 - -
-light exposure (at room temperature), high temperature exposition (37 °C) (protected from light) and protected from light (at room temperature), for one month duration.
L*a*b* color space parameters were determined weekly for each sample stored at different conditions, using a Minolta CR-400 Chroma meter (Japan) and SpectraMagicTM software. Using this device, the sample
surface is illuminated by a pulsed xenon lamp and the
light relected is collected for a tristimulus color analysis
at 450, 560 and 600 nm, using the L*a*b* color system. The L*a*b* system is very comprehensive with the L* parameter expressing color brightness (varying between 100 for a white surface and 0 for a black surface). The a* parameter represents changes along a red-green axis with changes from +60 for a red surface to -60 to a green surface. The b* parameter changes from +60 for yellow surface to -60 for a blue surface (Clarys et al., 2000; Zhou
et al., 2011). The surface measured is 8 mm in diameter. The Chroma meter is calibrated using a white calibration plate. For each sample, measurements were made in
triplicate. Color difference (ΔE) is calculated using
coordinate geometry according to the equation:
∆E = [(∆L*)
2 +
∆a*)
2 +
∆b*)
2]1/2 (1)
pH determination
The pH of semisolid formulations was determined weekly in triplicate in each sample stored at different conditions, using a Crison Basic 20 pH meter (Spain).
Statistical analysis
The data were statistically analyzed. A Student’s t test was performed to understand if the differences were
signiicant.
RESULTS AND DISCUSSION
Textural analysis
Figure 1 shows the results of firmness and adhesiveness of the different formulations.
The FD results of firmness and adhesiveness are not presented in the graphs because the textural analysis of this formulation was performed with another probe (25 mm), since this sample was more fluid than the other formulations. The results of firmness and adhesiveness for FD formulation were 0.124 ± 0.002 N and -0.716 ± 0.008 N∙mm, respectively. Formulations
based on hydrophobic ointment had higher irmness and adhesiveness values than O/W creams. Additionally, formulations containing SD showed higher irmness and
adhesiveness values than the corresponding formulations with pure dithranol. Moreover, formulations with SD of glyceryl behenate (SD C) had a small increase in textural parameters compared to formulations with SD of stearic acid and argan oil (SD SA).
Figure 2 shows the values of spreadability for the semisolid formulations. The results were interpreted as
the dificulty of spreading, as the smaller the maximum
positive force, the easier the spreading (Savary, Grisel, Picard, 2013). The formulation for which it was necessary
0 0.5 1 1.5 2 2.5
FSA FC HD HSA HC
F
m
a
x
(N)
Formulaons
Firmness
-5 -4 -3 -2 -1 0
FSA FC HD HSA HC
A(
-)
(N*mm)
Formulaons
Adhesiveness
FIGURE 1 – Results of firmness and adhesiveness of the formulations containing dithranol (HD) and solid dispersions of dithranol in stearic acid and argan oil (FSA and HSA) and in glyceryl behenate (FC and HC).
0 2 4 6 8 10
FD FSA FC HD HSA HC
F
m
á
x
(N
)
Formulaons
Spreadability
to apply a smaller force to spread was the O/W cream FD,
whereas, hydrophobic ointments HSA and HC required the greatest forces to spread.
Formulations with pure dithranol were easier to spread than formulations containing solid dispersions. However, there were not considerable differences between formulations with SD SA (FSA and FC) and with SD C (HSA and HC).
Rheological analysis
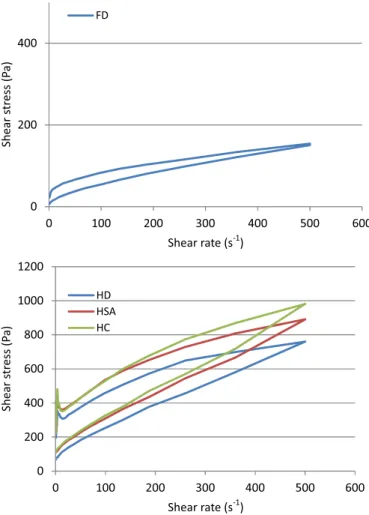
Figure 3 depicts the plots of the shear stress as a function of shear rate of the semisolid formulations.
The low curves of the tested formulations revealed a
non-Newtonian shear-thinning behavior, with yield value. The yield value, i.e. the stress above which the structure of the system is broken down, is greater in hydrophobic ointments HD, HSA and HC than in oil-in-water creams.
0 200 400
0 100 200 300 400 500 600
Shear s
tr
ess (P
a)
Shear s
tr
ess (P
a)
Shear rate (s )-1
Shear rate (s )-1
FD
0 200 400 600 800 1000 1200
0 100 200 300 400 500 600
HD HSA HC
FIGURE 3 – Shear stress as a function of the shear rate of the semisolid formulations. Upper and lower curves present ascending and descending measurements, respectively, for each formulation.
These systems start lowing after achieving a yield value
and the viscosity of the formulations decrease with increasing shear rate. As it was observed in the studies of Gilbert et al., the formulations with higher yield values showed higher values of viscosity and shear stress than the other formulations (Gilbert etal., 2013). The rheograms of FSA and FC are not shown, because there was been a lack of uniformity in the obtained results.
Thixotropy, a reversible variation of viscosity with time, was observed in all formulations, demonstrated by the presence of hysteresis area between ascending and descending curves of the rheograms. This feature is desirable in topical formulations, since it could facilitate the application of the product on the skin surface (Silva et al., 2012; Korhonen et al., 2001). Regarding the hysteresis area, this was greater in the case of formulations HD, HSA, HC and also FC.
The knowledge about mechanical properties of topical formulations, with special emphasis on rheology, is useful because the information can be used as a technological tool to predict their spreading capacity on the skin (Van de Kerkof et al., 2002).
In a study performed by Marty and co-workers, in which the rheological characterization of topical ointments used in psoriasis treatment were compared with the consumer acceptability, it was found that the formulation with optimal rheological characteristics (shear-thinning) is also preferred by psoriatic patients (Marty et al., 2005).
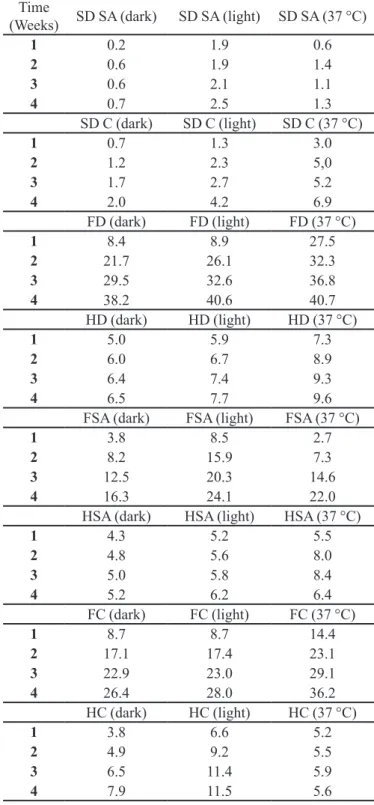
Color evaluation
The ΔE, determined according to equation 1,
for samples at different times, stored under different conditions are shown in Table II.
A change or difference in color corresponding to a
value of ΔE>1.5 can be perceived by the human eye (Stark
et al., 1996). The signiicant differences observed were
correlated with the ΔE greater than 1.5. With the exception
of SD SA, all samples presented values of ΔE greater than 1.5 and showed an increase of this parameter over time.
All formulations with pure dithranol showed greater ΔE
values than semisolid formulations with SD containing dithranol. Considering the different SD, in general, SD SA and formulations with SD SA showed more stability than SD C and formulations containing this SD. In the
majority of cases, the values of ΔE obtained each week for
SD SA and their semisolid formulations were lower than
the results of ΔE values of SD C and their formulations,
with the exception of HSA at 37 °C.
Comparing O/W cream with hydrophobic ointment,
may arise due to decomposition of excipients or due to interaction between drug and excipients (Stark et al., 1996).
Thoma and Holzmann investigated the photostability of dithranol 0.1% (w/w) in various solvents and excipients and have shown that in macrogol 400 (hydrophilic excipient), the drug is already unstable without irradiation
and the inluence of light plays only a minor role for the degradation reaction. However, in a parafin base, that
offers high stability for dithranol under the exclusion of
light, a distinct instability exists under the inluence of
light (Thoma, Holzmann, 1998).
It is possible to observe that in some cases (FC, HSA
and HD) the temperature affects the ΔE values more so
than the light. Previous results obtained by other authors demonstrate that various formulations containing dithranol were more stable at refrigerated conditions (5 ± 3 °C) than the same formulations stored at 45 ± 2 °C (Raza etal., 2011).
There was a correlation between color and time for FD (dark/room temperature) and FSA (dark/room
temperature) where linear regressions of ΔE versus
time (weeks) were: y = 9.75x + 0.06; R2 = 0.99 and
y = 4.13x – 0.1; R2 = 0.99; respectively.
Considering CIEL*a*b* color space parameters, it is possible to conclude that dithranol degradation corresponds to a significant increase in a* value and a decrease in L* and b* parameters. The formulation where this observation was more pronounced was FD, which gained a brown color with time.
Rhee et al., have observed that the change in color value in a formulation of rabeprazole as measured by the total differenceΔE showed an exponential relationship with drug degradation products, which suggested that color changes could be detected before chemical degradation amassed to a noticeable extent (Rhee et al., 2008).
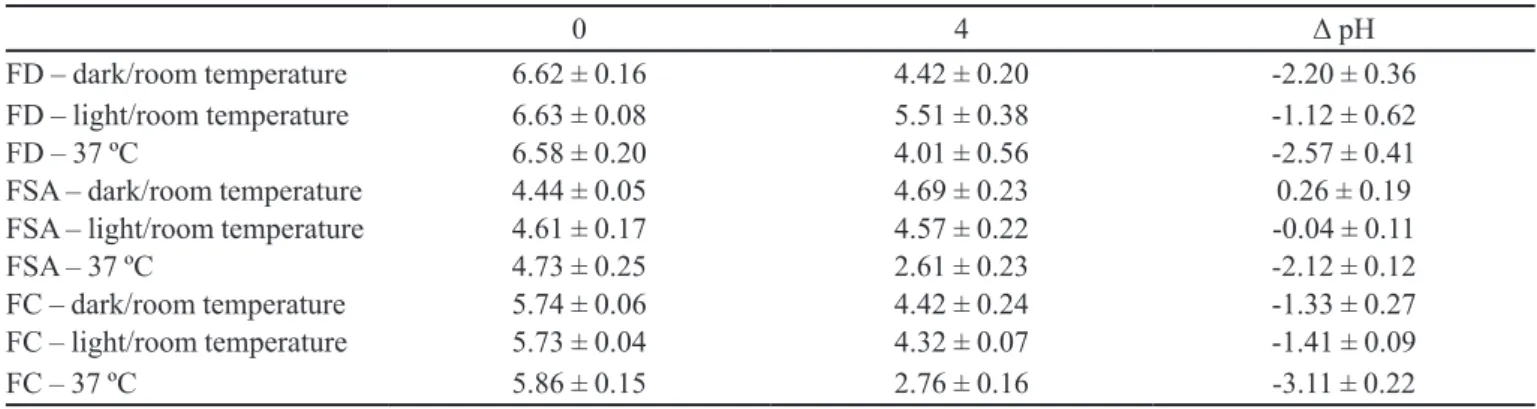
pH determination of O/W formulations
Table III shows the pH values of each semisolid formulation.
The formulation containing SD SA (FSA) showed lower pH variations than the other formulations, which suffered significant pH variations with time. The formulations FD, FSA and FC stored at 37 °C during four weeks suffered the highest pH variation. The pH of FSA (dark/room temperature) and FSA (light/room temperature) remained more stable than the formulations with pure dithranol and SD C. Since the dermatological base is the same, we can presume that the observed differences are due to the fact that preparations contain pure dithranol or SD, instead of eventual alterations in
the O/W cream constituents. Some authors have already
TABLE II – Color testing results (ΔE values) of samples at
different times stored under different conditions, determined weekly during one month
Time
(Weeks) SD SA (dark) SD SA (light) SD SA (37 °C)
1 0.2 1.9 0.6
2 0.6 1.9 1.4
3 0.6 2.1 1.1
4 0.7 2.5 1.3
SD C (dark) SD C (light) SD C (37 °C)
1 0.7 1.3 3.0
2 1.2 2.3 5,0
3 1.7 2.7 5.2
4 2.0 4.2 6.9
FD (dark) FD (light) FD (37 °C)
1 8.4 8.9 27.5
2 21.7 26.1 32.3
3 29.5 32.6 36.8
4 38.2 40.6 40.7
HD (dark) HD (light) HD (37 °C)
1 5.0 5.9 7.3
2 6.0 6.7 8.9
3 6.4 7.4 9.3
4 6.5 7.7 9.6
FSA (dark) FSA (light) FSA (37 °C)
1 3.8 8.5 2.7
2 8.2 15.9 7.3
3 12.5 20.3 14.6
4 16.3 24.1 22.0
HSA (dark) HSA (light) HSA (37 °C)
1 4.3 5.2 5.5
2 4.8 5.6 8.0
3 5.0 5.8 8.4
4 5.2 6.2 6.4
FC (dark) FC (light) FC (37 °C)
1 8.7 8.7 14.4
2 17.1 17.4 23.1
3 22.9 23.0 29.1
4 26.4 28.0 36.2
HC (dark) HC (light) HC (37 °C)
1 3.8 6.6 5.2
2 4.9 9.2 5.5
3 6.5 11.4 5.9
4 7.9 11.5 5.6
since the ΔE values were lower than those obtained with
TABLE III – pH values of samples at time 0 and after 4 weeks of storage under different conditions and pH differences
0 4 Δ pH
FD – dark/room temperature 6.62 ± 0.16 4.42 ± 0.20 -2.20 ± 0.36
FD – light/room temperature 6.63 ± 0.08 5.51 ± 0.38 -1.12 ± 0.62
FD – 37 ºC 6.58 ± 0.20 4.01 ± 0.56 -2.57 ± 0.41
FSA – dark/room temperature 4.44 ± 0.05 4.69 ± 0.23 0.26 ± 0.19
FSA – light/room temperature 4.61 ± 0.17 4.57 ± 0.22 -0.04 ± 0.11
FSA – 37 ºC 4.73 ± 0.25 2.61 ± 0.23 -2.12 ± 0.12
FC – dark/room temperature 5.74 ± 0.06 4.42 ± 0.24 -1.33 ± 0.27
FC – light/room temperature 5.73 ± 0.04 4.32 ± 0.07 -1.41 ± 0.09
FC – 37 ºC 5.86 ± 0.15 2.76 ± 0.16 -3.11 ± 0.22
related pH changes during storage with chemical stability. Dragicevic-Curic et al. developed liposomal hydrogels and the pH value and drug content was determined after their preparation and at predetermined time intervals during 6 months of storage at 4 and 23 °C. The drug content and pH values did not show remarkable changes during the storage of gels, which indicate chemical stability during storage at both temperatures (Dragicevic-Curic et al., 2010).
CONCLUSIONS
It was possible to conclude that SD increases the stability of dithranol, and that an SD of stearic acid with argan oil (SD SA) achieves this purpose better than an SD of glyceryl behenate (SD C). However, the dermatological base
also inluences the stability, and the anhydrous formulations
(hydrophobic ointment) showed the best results compared to the formulations containing water in their composition. In the future it will be important to optimize the dermatological base for SD incorporation, for example, with the addition of an antioxidant to obtain a completely stable system, suitable for skin application of dithranol.
REFERENCES
ALMEIDA, H.; AMARAL, M.H.; LOBÃO, P. Comparative
study of sustained-release lipid microparticles and solid dispersions containing ibuprofen. Braz. J. Pharm. Sci., v.48, n.3, p.531-536, 2012.
ASHTON, E.; ANDRE, P.; LOWE, N.J. Anthralin: historical
and current perspectives. J. Am. Acad. Dermatol., v.9, n.2, p.173-192, 1983.
BROWN, K.K.; REHMUS, W.E.; KIMBALL, A.B. Determining
the relative importance of patient motivations for nonadherence to topical corticosteroid therapy in psoriasis. J. Am. Acad. Dermatol., v.55, n.4, p.607-613, 2006.
CARLOTTI, M.E.; SAPINO, S.; PEIRA, E.; GALLARATE, M.; UGAZIO, E. On the photodegradation of dithranol in
different topical formulations: use of SLN to increase the stability of the drug. J. Dispersion Sci. Technol., v.30, n.10, p.1517-1524, 2009.
CHIOU, W.L.; RIEGELMAN, S. Pharmaceutical applications
of solid dispersions. J. Pharm. Sci., v.60, n.9, p.1281-1302, 1971.
CHRISTOPHERS, E. Psoriasis epidemiology and clinical
spectrum. Clin. Exp. Dermatol., v.26, n.4, p.314-320, 2001.
CLARYS, P.; ALEWAETERS, K.; LAMBRECHT, R.; BAREL,
A.O. Skin color measurements: comparison between three
instruments: the chromameter®, the dermaspectrometer® and the mexameter®. Skin Res. Technol., v.6, n.4, p.230-238, 2000.
DEVAUX, S.; CASTELA, A.; ARCHIER, E.; GALLINI,
A.; JOLY, P.; MISERY, L.; ARACTINGI, S.; AUBIN,
F.; BACHELEZ, H.; CRIBIER, B.; JULLIEN, D.; LE
MAÎTRE, M.; RICHARD, M.A.; ORTONNE, J.P.; PAUL,
C. Adherence to topical treatment in psoriasis: a systematic literature review. J. Eur. Acad. Dermatol. Venereol., v.26, suppl.3, p.61-67, 2012.
DRAGICEVIC-CURIC, N.; WINTER, S.; KRAJISNIK, D.; STUPAR, M.; MILIC, J.; GRAEFE, S.; FAHR, A. Stability
evaluation of temoporin-loaded liposomal gels for topical
application. J. Liposome Res., v.20, n.1, p.38-48, 2010.
DVORAKOVA, V.; MARKHAM, T. Psoriasis: current
treatment options and recent advances. Prescriber, v.24, n.10, p.13-20, 2013.
FOUÉRÉ, S.; ADJADJ, L.; PAWIN, H. How patients experience
GAMBHIRE, M.S.; BHALEKAR, M.R.; SHRIVASTAVA, B. Investigations in photostability of dithranol incorporated in solid lipid nanoparticles. Pharm. Chem. J., v.46, n.4, p.256-261, 2012.
GILBERT, L.; PICARD, C.; SAVARY, G.; GRISEL, M. Rheological and textural characterization of cosmetic emulsions containing natural and synthetic polymers: relationships between both data. Colloids Surface A, v.421, n.20, p.150-163, 2013.
KORHONEN, M.; HELLEN, L.; HIRVONEN, J.; YLIRUUSI,
J. Rheological properties of creams with four different surfactant combinations - effect of storage time and conditions. Int. J. Pharm., v.221, n.1-2, p.187-196, 2001.
KRISHNAMOORTHY, V.; SUCHANDRASEN; PRASAD,
V.P.R. Physicochemical characterization and in vitro dissolution behavior of olanzapine-mannitol solid dispersions. Braz. J. Phar. Sci., v.48, n.2, p.243-255, 2012.
MAHRLE, G. Dithranol. Clin. Dermatol., v.15, n.5, p.723-737, 1997.
MAHRLE, G.; BONNEKOH, B.; GHYEZY, M.; WIEGREBE,
W. Stability of anthralin in liposomal phospholipids. Arch. Dermatol. Res., v.283, n.7, p.483-484, 1991.
MARTY, J.P.; LAFFORGUE, C.; GROSSIORD, J.L.; SOTO,
P. Rheological properties of three different vitamin D ointments and their clinical perception by patients with mild to moderate psoriasis. J. Eur. Acad. Dermatol., v.19, suppl.3, p.7-10, 2005.
MUSTAKALIO, K.K. Irritation, staining and antipsoriatic
activity of 10-acyl analogue of anthralin. Br. J. Dermatol., v.105, suppl.20, p.23-27, 1981.
RAZA, K.; NEGI, P.; TAKYAR, S.; SHUKLA, A.; AMARJI, B.;
KATARE, O.P. Novel dithranol phospholipid microemulsion
for topical application: development, characterization and percutaneous absorption studies. J. Microencapsul., v.28, n.3, p.190-199, 2011.
RHEE, Y.S.; PARK, C.W.; SHIN, Y.S.; KAM, S.H.; LEE, K.Y.; PARK, E.S. Application of instrumental evaluation of color for the pre-formulation and formulation of rabeprazole. Int. J. Pharm., v.350, n.1-2, p.122-129, 2008.
SAVARY, G.; GRISEL, M.; PICARD, C. Impact of emollients on the spreading properties of cosmetic products: A combined sensory and instrumental characterization. Colloids Surf. B Biointerfaces, v.102, n.1, p.371-378, 2013.
SERAJUDDIN, A.T.M. Solid dispersions of poorly water-soluble drugs: early promises, subsequent problems and recent breakthroughs. J. Pharm. Sci., v.88, n.1, p.1058-1066, 1999.
SILVA, A.C.; AMARAL, M.H.; GONZÁLEZ-MIRA, E.; SANTOS, D.; FERREIRA, D. Solid Lipid Nanoparticles
(SLN) - based hydrogels as potential carriers for oral transmucosal delivery of Risperidone: Preparation and characterization studies. Colloids Surf. B Biointerfaces, v.93, n.1, p.241-248, 2012.
STARK, G.; FAWCETT, J.P.; TUCKER, I.G.; WEATHERALL, I.L. Instrumental evaluation of color of solid dosage forms during stability testing. Int. J. Pharm., v.143, n.1, p.93-100, 1996.
THOMA, K.; HOLZMANN, C. Photostability of dithranol. Eur. J. Pharm. Biopharm., v.46, n.2, p.201-208, 1998.
VAN DE KERKHOF, P.C.; BERTH-JONES, J.; GRIFFITHS, C.E.; HARRISON, P.V.; HÖNIGSMANN, H.; MARKS, R.; ROELANDTS, R.; SCHÖPF, E.; TROMPKE, C. Long-term eficacy and safety of tacalcitol ointment in patients
with chronic plaque psoriasis. Br. J. Dermatol., v.146, n.3, p.414-422, 2002.
WANG, J.C.T.; PATEL, B.G.; EHMAN, C.W.; LOWE, N. The
release and percutaneous permeation of anthralin products, using clinically involved and uninvolved psoriatic skin. J. Am. Acad. Dermatol., v.16, n.4, p.812-820, 1987.
WIEGREBE, W.; PLUMIER, E.; MAYER, K.K. Experimental contribution to the dithranol-brown problems. Arch. Dermatol. Res., v.2277, n.2, p.153-155, 1985.
ZHOU, L.; VOGT, F.G.; OVERSTREET, P.-A.; DOUGHERTY, J.T.; CLAWSON, J.S.; KORD, A.S. A Systematic method
development strategy for quantitative color measurement in drug substances, starting materials, and synthetic intermediates. J. Pharm. Innovation, v.6, n.4, p.217-231, 2011.