Orthodontic intrusion of maxillary incisors:
a 3D finite element method study
Armando Yukio Saga1, Hiroshi Maruo2, Marco André Argenta3, Ivan Toshio Maruo4, Orlando Motohiro Tanaka5
Objective: In orthodontic treatment, intrusion movement of maxillary incisors is often necessary. Therefore, the objective of this investigation is to evaluate the initial distribution patterns and magnitude of compressive stress in the periodontal ligament (PDL) in a simulation of orthodontic intrusion of maxillary incisors, considering the
points of force application. Methods: Anatomic 3D models reconstructed from cone-beam computed tomography
scans were used to simulate maxillary incisors intrusion loading. The points of force application selected were: centered between central incisors brackets (LOAD 1); bilaterally between the brackets of central and lateral incisors (LOAD 2); bilaterally distal to the brackets of lateral incisors (LOAD 3); bilaterally 7 mm distal to the center of brackets of lateral
incisors (LOAD 4). Results and Conclusions: Stress concentrated at the PDL apex region, irrespective of the point
of orthodontic force application. The four load models showed distinct contour plots and compressive stress values over the midsagittal reference line. The contour plots of central and lateral incisors were not similar in the same load model. LOAD 3 resulted in more balanced compressive stress distribution.
Keywords: Orthodontics. Tooth intrusion. Finite element analysis.
1 Professor, Pontifícia Universidade Católica do Paraná (PUC-PR), School of
Health and Biosciences, Residency in Orthodontics, Curitiba, Paraná, Brazil.
2 Professor, Associação Brasileira de Odontologia (ABO-PG), Ponta Grossa,
Paraná, Brazil.
3 Adjunct professor, Universidade Federal do Paraná (UFPR), Department of
Civil Engineering, Graduate Program in Numerical Methods, Curitiba, Paraná, Brazil.
4 Professor, Pontifícia Universidade Católica do Paraná (PUC-PR), Residency in
Orthodontics, and Associação Brasileira de Odontologia (ABO-PR), Curitiba, Paraná, Brazil.
5 Professor, Pontifícia Universidade Católica do Paraná (PUC-PR), School
of Health and Biosciences, Graduate Dentistry Program in Orthodontics, Curitiba, Paraná, Brazil.
DOI: http://dx.doi.org/10.1590/2177-6709.21.1.075-082.oar
How to cite this article: Saga AY, Maruo H, Argenta MA, Maruo IT, Tana-ka OM. Orthodontic intrusion of maxillary incisors: a 3D finite element method study. Dental Press J Orthod. 2016 Jan-Feb;21(1):75-82.
DOI: http://dx.doi.org/10.1590/2177-6709.21.1.075-082.oar
Submitted: March 18, 2015 - Revised and accepted: August 17, 2015
» The authors report no commercial, proprietary or financial interest in the products or companies described in this article.
Contact address: Orlando Tanaka
Rua Imaculada Conceição, 1155 – CEP: 80.215-901 – Curitiba/PR, Brazil E-mail: [email protected]
Objetivo: frequentemente, no tratamento ortodôntico, é necessário o movimento de intrusão dos incisivos superiores. Assim, o objetivo deste estudo é avaliar o padrão de distribuição inicial e magnitude das tensões compressivas no ligamento periodontal (LPD) na simulação da intrusão ortodôntica dos incisivos superiores, considerando os pontos de aplicação da
força. Métodos: modelos anatômicos 3D reconstruídos a partir de tomografias computadorizadas de feixe cônico foram
utilizados para simular os carregamentos da intrusão dos incisivos superiores. Os pontos eleitos para a aplicação das forças foram: centralizado entre os braquetes dos incisivos centrais (LOAD 1); bilateralmente, entre os braquetes dos incisivos centrais e laterais (LOAD 2); bilateralmente, distal aos braquetes dos incisivos laterais (LOAD 3); bilateralmente, 7mm
distal ao centro dos braquetes dos incisivos laterais (LOAD 4). Resultados e Conclusões: as tensões concentraram-se
na região apical do LPD, independentemente do ponto de aplicação da força ortodôntica; os quatro modelos de carrega-mento mostraram distribuição e valores de tensão compressiva distintos na linha mediana sagital de referência; os gráficos de distribuição das tensões não foram similares para os incisivos central e lateral no mesmo modelo de carregamento; o LOAD 3 resultou em uma distribuição mais equilibrada das tensões compressivas.
INTRODUCTION
Regardless of genetic or treatment-related factors, maxillary incisors consistently feature more external
apical root resorption (EARR) than any other tooth.1,2
With respect to the type of movement, intrusion
move-ment appeared to be the most predictive for EARR.3,4,5
However, frequently, in orthodontic treatment, intru-sion movement of an entire segment consisting of four maxillary incisors is necessary, as in cases of deep over-bite correction.
With tridimensional (3D) numeric computer analysis, such as the inite element analysis (FEA), valuable infor-mation can be obtained, since various orthodontic clini-cal conditions can be simulated, and stress distribution in the individual constituents of the periodontium can be
evaluated qualitatively and quantitatively.6,7
Studies relating the distribution of compression stress in the periodontal ligament (PDL) to the intrusion of maxillary incisors are scarce and approached in non-clinical conditions, since an intrusive force coincident with the long axes of four maxillary incisors is impos-sible to obtain clinically.8,9
Therefore, the objective of this investigation is to evaluate the initial distribution patterns and magnitude of compressive stress in the PDL in a simulation of orth-odontic intrusion of maxillary incisors, considering the points of force application.
MATERIAL AND METHODS
A maxilla from a dry adult human skull was recon-structed based on cone-beam computed tomography
scans (i-CATTM, Imaging Sciences, Hatield, PA, USA),
yielding a stack of 256 slices with 0.25 mm thickness, converted into exportable DICOM iles.
The limits of the compact and trabecular layers of bone, enamel and dentin were determined by using digi-tal edge detection technology. The edges were then used to generate the 3D geometry with commercial
computer-aided design sotware (SimplewareTM, Innovation
Cen-tre, Exeter, United Kingdom). The generated solid was exported as STL ile (Stereolithography CAD) extension
to SolidworksTM (Dessault Systèmes Solidworks Corp.,
Concord, MA, USA) in order to convert into bilinear nonuniform rational B-spline (NURBS). The 0.022-in standard nontorqued, nonangulated edgewise orthodon-tic brackets and a cross section of 0.021 x 0.025-in arch wire were also 3D modeled. A 0.25-mm gap between
roots and alveolar bone socket surfaces was considered as the space of the PDL.
This ile was exported to ANSYSTM v12.1
(Swan-son Analysis System Inc., Canonsburg, PA, USA), the FEA solver sotware. The model was meshed by using tetrahedral elements of which quadratic shape allowed capturing the complex, curved surfaces in the modeling accuracy. The inal model consisted of 322450 elements with edge length ranging from 0.25 mm to 1.50 mm and 603380 nodes.
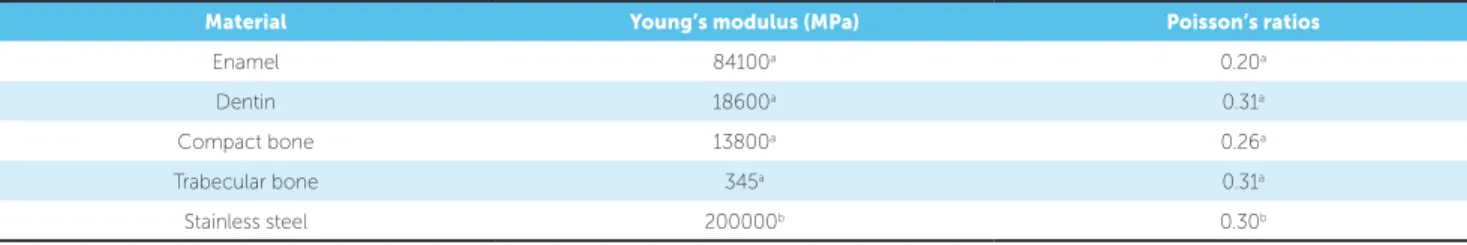
Dental and bone material were assumed to be ho-mogeneous, isotropic, and linearly elastic with
specif-ic Young’s modulus and Poisson’s ratios (Table 1).10,11
To represent the nonlinear mechanical behavior of the PDL, parameters of the hyperelastic instantaneous
re-sponse were used (Table 2).12
The points of force application were selected based on simulated clinical situations and considering points which the clinician usually would choose to intrude maxillary in-cisors. Thus, the points of force application were:
- LOAD 1: centered between central incisors brackets (Fig 1A).
- LOAD 2: bilaterally between central and lateral incisors brackets (Fig 1B).
- LOAD 3: bilaterally distal to lateral incisors brackets (Fig 1C).
- LOAD 4: bilaterally 7 mm distal to the center of lateral incisors brackets (Fig 1D).
To LOADs 2, 3 and 4, the points were selected also considering the approximate location of the center of resistance (CRes) of maxillary incisors. As a reference, it could lie apical of a point between the distal root side of the lateral incisor and the distal root side of the
ca-nine.13-16 No consensus has been reached in the
litera-ture in terms of the exact localization of CRes of maxil-lary incisors. Therefore, the points of force application varied in the 3D model in an attempt to approach, as close as possible, the center of resistance, which would result in more balanced stress distribution.
An intrusive force of 15 gf per tooth was applied to the model vertically, upwards and direct to the cross section of the 0.021 x 0.025-in archwire, since previous studies recommended a force magnitude varying from 10 to 20 gf per tooth, depending on the amount of
peri-odontal support.17,18 It was imposed zero-displacement
Table 1 - Basic material properties of teeth and bone.
Material Young’s modulus (MPa) Poisson’s ratios
Enamel 84100a 0.20a
Dentin 18600a 0.31a
Compact bone 13800a 0.26a
Trabecular bone 345a 0.31a
Stainless steel 200000b 0.30b
a = Source: Jones et al.10; b = Source: Kojima and Fukui.11
Table 2 - Parameters of the hyperelastic instantaneous response of the PDL.12
C1 (MPa) C2(MPa) C3(MPa) Kν (MPa) β
0.004 0.002 0.004 1000 3.5
XY scatter charts of stress values in a representative sagittal labial-apex-palatal (LAP) line were also consid-ered, since the latter is located in the main plane to visu-alize maxillary incisors intrusion movement. The LAP representative line was deined by a reference line from the labial side of the PDL alveolar crest, going up to the apex to the palatal side of the alveolar crest, and match-ing, as close as possible, the midsagittal plane of the
tooth.5,19,20 A total of 79 nodes were selected along this
line for central incisors (relabeled from 1 to 79) and 88 for lateral incisors (relabeled from 1 to 88). Once the anatomical traits of the maxilla and teeth were clinically symmetrical, only teeth on the right side were consid-ered for the XY scatter charts.
Figure 2 illustrates just the location of the odd num-bered nodes for right maxillary central and lateral inci-sors in the LAP representative line.
RESULTS
The results are graphically demonstrated in two manners: contour plots and XY scatter charts represent-ing nodal stress data in the PDL side of the PDL-socket bone interface, since stress in the PDL can be used to
predict potential sites of bone remodeling.21
Records according to the minimum, mid and maxi-mum principal stresses were obtained. In this study, minimum principal stress (MinPS) was equivalent to compressive stress. Hence, MinPS will be approached.
Figure 1 - Selected points of force application. A) LOAD 1; B) LOAD 2; C) LOAD 3; D) LOAD 4.
A
C
B
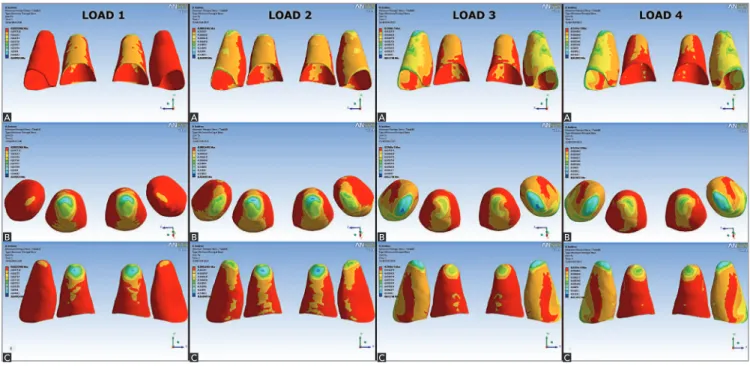
Figure 3 - MinPS (compression stress) distribution for maxillary incisors to LOADS 1, 2, 3 and 4: A) labial view; B) apical view; C) palatal view.
Figure 2 - Position of the odd numbered nodes in the LAP referential plane to right maxillary central incisor (A - labial view; B - apical view; C - palatal view) and to right maxillary lateral incisor (D - labial view; E - apical view; F - palatal view).
Contour plots
The contour plots for MinPS distribution are il-lustrated in Figure 3. Blue color shows areas of higher compression while red color refers to areas of lower compression. Throughout the simulation, the highest compressive areas were located at the apex.
In LOAD 1, the highest compression occurred mainly at the apex of central incisors. Overall, the labial side of the PDL presented a more extended compressive region than the palatal side.
In LOAD 2, the highest compressive areas were ob-served at the apex of central incisors as well, but these
A
D
B
E
C
F
A A A A
B B B B
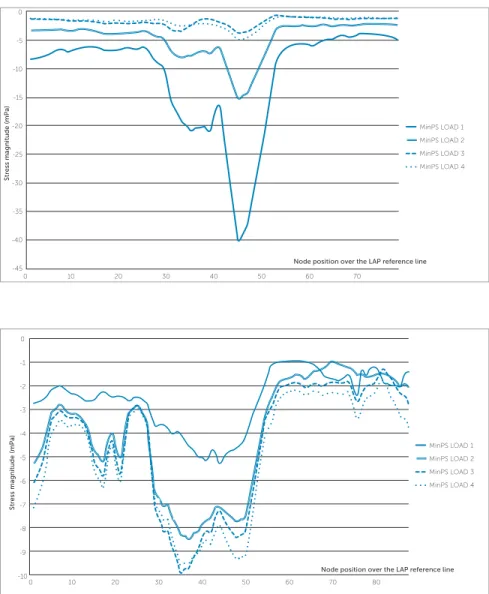
Figure 4 - MinPS (compression stress) scatter chart to the four loading simulations according to node position over the LAP reference line for the right maxillary central incisor.
Figure 5 - MinPS (compression stress) scatter chart to the four loading simulations according to node position over the LAP reference line for the right maxillary lateral incisor.
areas shited to mesial. Areas of compression were ob-served in the lateral incisors apex. Both central and lat-eral incisors exhibited higher compressive areas on the labial side in comparison to the palatal side, especially at the PDL labial margin of lateral incisors.
In LOAD 3, the highest compressive areas shift-ed to lateral incisors apex. Compression areas in the PDL labial middle region and at the PDL labial mar-gin were also present in these teeth. For central in-cisors, the palatal side of the apex exhibited higher compressive stress and almost the entire labial side of the PDL presented lower compression in comparison to the palatal side.
Similarly to LOAD 3, in LOAD 4, the highest com-pression was observed at the lateral incisors apex as well. In the labial middle region and at the labial and mesial
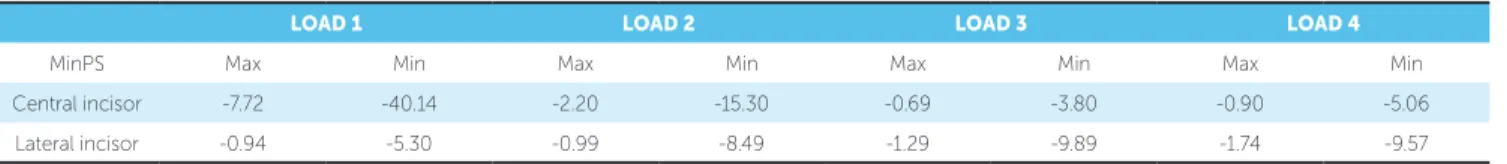
margin of lateral incisors PDL, compression was also present. Comparatively to LOAD 3, central incisors PDL labial side was less compressive. MinPS magni-tudes (milliPascal, or mPa) for the four loading models are given in Table 3.
MinPS XY scatter charts - Right maxillary central incisor (Fig 4)
In every loading model, node 45, located in the PDL apex, showed the highest compression; i.e., most negative values. In LOAD 1, on the labial side, higher compression in the PDL cervical third occurred com-paratively to the palatal side. From node 25 (labial apical third) to node 35, a sharper compression increase oc-curred. Node 45, located at the PDL apex, presented the highest compression (-40.14 mPa). From node 45,
MinPS LOAD 1
0 20
-45 -40 -35 -30 -25 -20 -15 -10 -5 0
50
10 30 40 60 70
MinPS LOAD 2
MinPS LOAD 3
MinPS LOAD 4
Node position over the LAP reference line
S
tr
ess magnitude (mPa)
MinPS LOAD 1
0 20
-10 -9 -8 -7 -5
-6 -4 -3 -1
-2 0
50
10 30 40 60 70 80
MinPS LOAD 2
MinPS LOAD 3
MinPS LOAD 4
Node position over the LAP reference line
S
tr
compression descended steeply. The line between nodes 55 and 79 referred approximately to the cervical and middle thirds of the PDL palatal side.
LOAD 2 had a similar behavior to LOAD 1; how-ever, in all nodes, less compression was observed; e.g., in node 45, MinPS was -15.30 mPa (2.62 less compres-sion than in LOAD 1). Moreover, from node 1 to 25, on PDL labial side, compression was relatively constant.
LOADS 3 and 4 revealed the lowest compression (-3.80 mPa and -5.06 mPa, respectively) and varia-tions of stress along the LAP reference line, showing the smallest diferences between maximum and minimum values. Thus, they demonstrated a more balanced dis-tribution of stress.
MinPS XY scatter charts - Right maxillary lateral incisor (Fig 5)
Comparatively to central incisors, stress distribu-tion over the LAP reference line was more irregular for lateral incisors, with more up and down variations. For LOAD 1, there was a tendency from node 1 to 44 towards a moderate compression decrease. Node 44 had the highest compression stress (-5.30 mPa). From this node until node 56, the decrease in compression stress was followed by a tendency towards stabilization of compression. For LOADs 2, 3 e 4, the graphic line behavior was similar. The PDL labial side demonstrated great nodal stress variations along the LAP reference line. Compression stress was observed in the PDL labial margin in LOAD 4 (-7.11 mPa), followed by LOAD 3 (-6.08 mPa) and 2 (-5.29 mPa).
In the PDL apex, the highest compression stress was ob-served at the apical area at node 35 to LOAD 4 (-9.57 mPa) and LOAD 3 (-9.89 mPa), at node 36 to LOAD 2 (-8.33 mPa) and at node 44 (-5.30 mPa) to LOAD 1.
DISCUSSION
FEA is a computer engineering numeric method that has allowed solution of biomechanical problems not in-volving live organisms. The 3D model of the maxilla and teeth obtained from a real anatomic skull and the discreti-zation of individual components of bone (trabecular and cortical bone) and tooth (enamel and dentin) in this study render the results as closer as possible to a real situation.
Clinically, intrusive forces have been traditional
suspect in severe cases of root resorption.4,5,22 The
pres-ent inite elempres-ent model study showed that there was stress concentration at the PDL of the root apex. Shaw,
Sameshima and Vu,7 as well as Parker and Harris,5
reported that intrusive movement and increase in in-cisor proclination were the most powerful predictors of EARR. Comparatively, LOADs 1 and 2 were me-chanical conigurations with the highest compression in the apical region of the PDL, and also had the great-est tendency towards buccal proclination of central in-cisors. Thus, from a biological and mechanical stand-point, they could be the least desirable points of force application for intrusion of maxillary incisors. Even though this study has demonstrated stress
concentra-tion in the apical region of the PDL, clinical studies20,23
showed no diferences in the amount of root resorp-tion between intrusion and other orthodontic move-ments, demonstrating that there are still other factors or variables to be explored.
In addition, factors that alter the position of the CRes of four maxillary incisors are the shape of surrounding bone, root morphology, position of each tooth, and
structure of the periodontal attachment.9,24 Since these
factors will generally be diferent for each patient, the location of the CRes of anterior arch segments in these patients will also be diferent.
LOAD 1 LOAD 2 LOAD 3 LOAD 4
MinPS Max Min Max Min Max Min Max Min
Central incisor -7.72 -40.14 -2.20 -15.30 -0.69 -3.80 -0.90 -5.06
Lateral incisor -0.94 -5.30 -0.99 -8.49 -1.29 -9.89 -1.74 -9.57
Table 3 - MinPS values (mPa) of the four loading simulation to maxillary right central and lateral incisors.
In vitro studies using diferent methods13,15,25,26 showed that the CRes of the four incisors lies 8-10 mm apical and 5-7 mm distal to lateral incisors. A more anterior location of the point of force application causes laring, whereas a more posterior location will cause uprighting of anterior teeth. When the axial inclination of incisors is diferent, so is the location of the axes of resistance in relation to the position of incisors crowns. More lared incisors should have a more distal point of force application than
retro-clined incisors.16 However, it is important to report that
the 3D model produced had just a slight maxillary inci-sor protrusion, and this fact might have inluenced the results in relation to stress distribution. Even if there is no common center or axis of resistance to the four incisors, it is necessary to determine a line of action of force that promotes a more balanced stress distribution.
LOAD 1 and LOAD 2 mechanical conigurations, especially LOAD 1, showed a strong tendency towards proclination of maxillary central incisors; whereas for LOAD 3 and LOAD 4, the orthodontic movement likely to occur would be intrusion with little or no protrusion, but with distal inclination of lateral inci-sors in LOAD 4.
Although LOAD 3 and LOAD 4 presented more bal-anced stress distribution, in agreement with Reimann et
al,25 it is important to note that the central incisors are
loaded with smaller force systems than lateral incisors. This, in turn, means that lateral incisors are loaded high-er by the applied force system, which could compromise periodontal support, since lateral incisors usually have a smaller root surface area than central incisors.
As in most computer simulations of biological situ-ations, the limitations of the study are mainly regard-ing material parameters. It must be stated that values reported in the literature difer signiicantly from each other, especially in terms of the PDL. These difer-ences are due to experimental designs, large variation
in the complexity and geometry of numerical models.27
Evidently the applied parameters did not reproduce perfectly the complex structure and behavior of dental, bone and PDL tissues. Nevertheless, it was assumed that this behavior idealization was suitable to describe theo-retically the initial stress distribution of maxillary inci-sors orthodontic intrusion and that the results could be considered in clinical treatment planning.
Computed tomography scans and 3D recon-structions have become common examinations in
orthodontic diagnosis. They allow individual deter-mination of the most suitable points/axes of force application by computer modeling and numerical simulation. Thus, in the treatment of patients with complex problems, in which risks are greater, they may assist the implementation of a more effective orthodontic mechanics in order to obtain greater predictability of orthodontic movement with mini-mal side effects.
CONCLUSIONS
Within the study methodology, it is possible to con-clude the following:
1. Stress is concentrated at the PDL apex region, ir-respective of the point of orthodontic force application;
2. The four load models showed distinct contour plots and compressive stress values over the LAP reference line; 3. The contour plots of central and lateral incisors were not similar in the same load model;
4. LOAD 3 resulted in more balanced compressive stress distribution.
Authors contribution
1. Kennedy DB, Joondeph DR, Osterberg SK, Little RM. The efect of extraction and orthodontic treatment on dentoalveolar support. Am J Orthod. 1983 Sep;84(3):183-90.
2. Linge BO, Linge L. Apical root resorption in upper anterior teeth. Eur J Orthod. 1983 Aug;5(3):173-83.
3. Baumrind S, Korn EL, Boyd RL. Apical root resorption in orthodontically treated adults. Am J Orthod Dentofacial Orthop. 1996 Sep;110(3):311-20.
4. Han G, Huang S, Von den Hof JW, Zeng X, Kuijpers-Jagtman AM. Root resorption after orthodontic intrusion and extrusion: an intraindividual study. Angle Orthod. 2005 Nov;75(6):912-8.
5. Parker RJ, Harris EF. Directions of orthodontic tooth movements associated with external apical root resorption of the maxillary central incisor. Am J Orthod Dentofacial Orthop. 1998 Dec;114(6):677-83.
6. Sung SJ, Jang GW, Chun YS, Moon YS. Efective en-masse retraction design with orthodontic mini-implant anchorage: a inite element analysis. Am J Orthod Dentofacial Orthop. 2010 May;137(5):648-57.
7. Shaw AM, Sameshima GT, Vu HV. Mechanical stress generated by orthodontic forces on apical root cementum: a inite element model. Orthod Craniofac Res. 2004 May;7(2):98-107.
8. Rudolph DJ, Willes PMG, Sameshima GT. A inite element model of apical force distribution from orthodontic tooth movement. Angle Orthod. 2001 Apr;71(2):127-31.
9. Kamble RH, Lohkare S, Hararey PV, Mundada RD. Stress distribution pattern in a root of maxillary central incisor having various root morphologies: a inite element study. Angle Orthod. 2012 Sep;82(5):799-805.
10. Jones ML, Hickman J, Middleton J, Knox J, Volp C. A validated inite element method study of orthodontic tooth movement in the human subject. J Orthod. 2001 Mar;28(1):29-38.
11. Kojima Y, Fukui H. A numerical simulation of tooth movement by wire bending. Am J Orthod Dentofacial Orthop. 2006 Oct;130(4):452-9.
12. Natali A, Pavan P, Carniel E, Dorow C. Viscoelastic response of the periodontal ligament: an experimental-numerical analysis. Connect Tissue Res. 2004;45(4-5):222-30.
13. Vanden Bulcke MM, Dermaut LR, Sachdeva RC, Burstone CJ. The center of resistance of anterior teeth during intrusion using the laser relection technique and holographic interferometry. Am J Orthod Dentofacial Orthop. 1986 Sep;90(3):211-20.
14. Pedersen E, Isidor F, Gjessing P, Andersen K. Location of centres of resistance for maxillary anterior teeth measured on human autopsy material. Eur J Orthod. 1991 Dec;13(6):452-8.
REFERENCES
15. Matsui S, Caputo AA, Chaconas SJ, Kiyomura H. Center of resistance of anterior arch segment. Am J Orthod Dentofacial Orthop. 2000 Aug;118(2):171-8. 16. van Steenbergen E, Burstone CJ, Prahl-Andersen B, Aartman IH. The relation
between the point of force application and laring of the anterior segment. Angle Orthod. 2005 Sep;75(5):730-5.
17. Melsen B, Agerbaek N, Markenstam G. Intrusion of incisors in adult patients with marginal bone loss. Am J Orthod Dentofacial Orthop. 1989 Sep;96(3):232-41. 18. Weiland FJ, Bantleon HP, Droschl H. Evaluation of continuous arch and
segmented arch leveling techniques in adult patients--a clinical study. Am J Orthod Dentofacial Orthop. 1996 Dec;110(6):647-52.
19. Costopoulos G, Nanda R. An evaluation of root resorption incident to orthodontic intrusion. Am J Orthod Dentofacial Orthop. 1996 May;109(5):543-8. 20. Bellamy LJ, Kokich VG, Weissman JA. Using orthodontic intrusion of abraded
incisors to facilitate restoration: the technique’s efects on alveolar bone level and root length. J Am Dent Assoc. 2008 Jun;139(6):725-33.
21. Field C, Ichim I, Swain MV, Chan E, Darendeliler MA, Li W, et al. Mechanical responses to orthodontic loading: a 3-dimensional inite element multi-tooth model. Am J Orthod Dentofacial Orthop. 2009 Feb;135(2):174-81. 22. Harris DA, Jones AS, Darendeliler MA. Physical properties of root cementum:
part 8. Volumetric analysis of root resorption craters after application of controlled intrusive light and heavy orthodontic forces: a microcomputed tomography scan study. Am J Orthod Dentofacial Orthop. 2006 Nov;130(5):639-47.
23. Polat-Ozsoy O, Arman-Ozcirpici A, Veziroglu F. Miniscrews for upper incisor intrusion. Eur J Orthod. 2009 Aug;31(4):412-6.
24. Heravi F, Salari S, Tanbakuchi B, Loh S, Amiri M. Efects of crown-root angle on stress distribution in the maxillary central incisors’ PDL during application of intrusive and retraction forces: a three-dimensional inite element analysis. Prog Orthod. 2013 Sep 11;14:26.
25. Reimann S, Keilig L, Jäger A, Bourauel C. Biomechanical inite-element investigation of the position of the centre of resistance of the upper incisors. Eur J Orthod. 2007 Jun;29(3):219-24. Epub 2007 Feb 22.
26. Sia S, Koga Y, Yoshida N. Determining the center of resistance of maxillary anterior teeth subjected to retraction forces in sliding mechanics. An in vivo study. Angle Orthod. 2007 Nov;77(6):999-1003.