DOI: http://dx.doi.org/10.1590/1516-1439.322014
Materials Research. 2015; 18(Suppl. 1): 20-23 © 2015
*e-mail: [email protected]
1. Introduction
Bulk metallic glasses (BMGs) have shown excellent mechanical properties,including high strength, large elastic strain limit, which makes them ideal for structural and functional applications1-3. However, their poor ductility at
room temperature has signiicantly limited their application
as a potential engineering material4-6. In order to improve the plasticity of the BMGs, the mechanisms of deformation and fracture have been deeply investigated via both experimental and theoretical approaches. The mechanisms of deformation, damage and failure of amorphous solids can be effectively studied by the Numerical simulation method7,8. Brest et al.7 explored plasticity mechanisms in Zr-based BMGs by means of the diametral compression test and numerical simulation. Distribution of stress and state of equivalent strain in Zr-based BMGs during the compression process were presented. Go et al.9 analyzed the stress distribution of laminated BMG/metal composites via computer simulation using the ABACUS program during a uni-axial fracture. Zhang et al.10 researched structural anisotropy in Cu-based BMGs under uni-axial compression by molecular dynamics simulations. Kim et al.11 discussed a stress-overshoot phenomenon in
a Pd-based BMGs via inite element analysis under
uni-axial compression. However, until now, considerably less simulation has been performed for the deformation and fracture in Ni-based BMGs samples with different diameters at room temperature.
In this paper, on the basis of compression tests, the compressive deformation and fracture behaviors of Ni42Ti20Zr21.5Al8Cu5Si3.5 BMG specimens with diameters of 1 mm and 3 mm were simulated using ABAQUS software. Mises stress distribution, equivalent plasticity strain, and stress-strain curves of the compressed Ni-based BMG rods were analyzed. Compared with the measurements, the
deformation and fracture behaviors of the Ni-based BMG samples with different dimensions were discussed based on the numerical results.
2. Experimental and Numerical Procedure
After the Ni42Ti20Zr21.5Al8Cu5Si3.5(at%)alloy was arc-melted,the material was prepared in the form of 1mm and 3mm diameter cylindrical rods, respectively. The 1mm diameter and 2mm long rods, and 3mm diameter and 6mm long rods were used for computer simulation and compression tests. The compression fracture surface features were observed by scanning electron microscope(SEM) and are given in Figure 1.
The explicit inite element calculation software, ABAQUS/
Explicit, was employed for the simulation of compression deformation and fracture of the Ni-based BMG samples.
The inite element model of an amorphous cylindrical
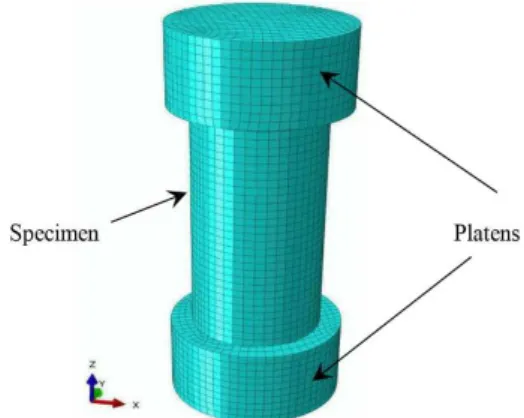
rod with 1mm diameter is depicted in Figure 2. The size of mesh in the element model was 0.05mm×0.05mm and 0.1mm×0.1mm for the 1mm and 3mm sample, respectively. Thus, there were 16560 and 49680 meshes in the 1mm and 3mm model, respectively. The selected element type was an 8-node linear brick, of reduced-integration elements (C3D8R).
In the inite element model, the platen was simpliied as a rigid body. General contact was deined between the platen and the specimen, and the tangential friction coeficient was
assumed to be 0.1.The boundary condition for the bottom
platen was ixed. The displacement load was applied on
the top platen along the 3- axis direction with the other
degrees of freedom ixed. In the compression test, the
amorphous Ni42Ti20Zr21.5Al8Cu5Si3 cylindrical rod suffered damage. Therefore, in order to gain a further insight into the evolutionary process of the damage to the Ni-based BMG sample, a shear damage model built in the standard model library of ABAQUS software was used12.The Shear damage
A Numerical Simulation of a Ni-based Bulk Metallic Glass During
Compressive Deformation and Fracture
Liang Weizhonga*, Ning Zhiliangb, Liu Ailiana, An Yonglianga
aHeilongjiang University of Science and Technology, Harbin, 150022, China bHarbin Institute of Technology, Harbin 150001, China
Received: August 30, 2014; Revised: December 1, 2014
On the basis of compression tests, uni-axial compression deformation and fracture behaviors of NiTiZrAlCuSi bulk metallic glass samples with different dimensions have been studied by numerical simulation approaches. Finite element models for compression simulation have been developed using ABAQUS software. Shear damage models were employed to reproduce the compression deformation and fracture process of the Ni-based amorphous alloys. Mises stress distribution and equivalent plastic strain obtained numerically during compression were analyzed. The simulation results were consistent with those of the compression experiment tests. The smaller of the samples exhibited larger plasticity and higher fracture strength when compared with the bigger one.
A Numerical Simulation of a Ni-based Bulk Metallic Glass During Compressive Deformation and Fracture
2015; 18(Suppl. 1) 21
initiation criterion12 is a model for predicting the onset of damage due to shear band localization. The model assumes that the equivalent plastic strain at the onset of damage is a function of the shear stress ratio and strain rate. The properties of the present material, elastic modulus(GPa), Poisson ration, density (g/cm3) and fracture strength (MPa) for different Ni-based BMG rods are listed in Table 1.
3. Results and Discussion
The computational simulation offers the possibility to
observe the stress ield. Figure 3 shows the stress distribution of a 1mm sample in the compressive deformation and fracture process at different strains. The stress indicator is shown on
the right side of each igure in order to indicate the stress upon
deformation and fracture. Since the fracture strength of the
1mm sample was identiied as 4600MPa, the highest stress
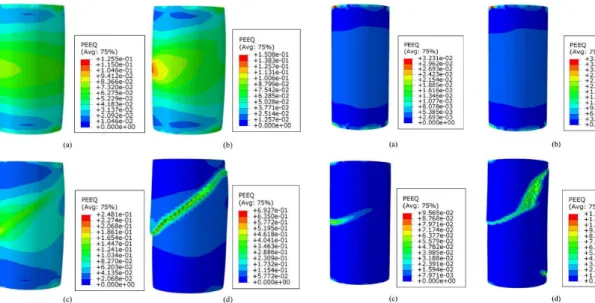
that 1mm sample fractured was indicated at 4600MPa. Mises stress was distributed uniformly on the surface of sample at a compressive strain of 11.62% (Figure 3a). However, when the compressive strain was 12.25%, shear damage occurred in the middle zone of the sample, resulting in the degradation of material properties and reduction of local stress (Figure 3b). Shear damage evolved along a 45 degree angle from the cylinder axis with a compressive strain of 12.53%, and the Mises stress decreased distinctly (Figure 3c). When the compressive strain was 12.6%, Mises stress decreased dramatically, the fracture happened along a 45 degree angle from the cylinder axis, and the load-carrying capacity of the sample was lowered radically, as shown in Figure 3d.
The equivalent plastic strain maps of the 1mm sample in the compressive deformation and fracture process at different strains are given in Figure 4. Material damage took place in the middle region, and the equivalent plastic strain was large in that region at a compressive strain of 11.62% (Figure 4a). When the compressive strain increased from 12.25% to 12.53%, the equivalent plastic strain augmented markedly in the direction of 45° angle to the cylinder axis (Figure 4b,c). When the strain was 12.6%, the material properties deteriorated sharply, and the element was removed from the mesh due to larger compressive deformation. The fracture happened and the equivalent strain increased drastically in a narrow shear band. It should be noted that the main crack developed along 45° angle to the cylinder axis (Figure 4d).
Figure 5 shows the stress distribution of the 3mm sample in the compressive deformation and fracture process at different strains. Since the fracture strength of 3mm sample
was identiied as 2650MPa, the highest stress that 3mm
sample fractured at was indicated to be 2650MPa. When the compressive strain increased from 3.81% to 3.82%, the stresses on the two ends of the sample were large due to stress concentration, and the stress in the middle region was distributed uniformly (Figure 5a-b). However, shear damage occurred in the middle zone of the sample (Figure 5c), and both load bearing capacity and local stress of materials were
signiicantly reduced at a compressive strain of 3.83%.The
materials fractured along 45 angle degree to the cylinder axis at a compressive strain of 3.84%, and Mises stress decreased sharply (Figure 5d).
Figure 1. The compressive fracture surface of BMG rods with
diameters of 1 mm (a) and 3 mm (b).
Figure 2. The inite element model of the Ni-based BMG rod with
a diameter of 1mm.
Table 1. The materials constant used for ABAQUS program.
Sample diameters
Young’s modulus E(GPa)
Possion’s Ration, V
Density,
ρ(g/cm3)
Fracture stress
σ (MPa)
1mm 68 0.39 7.8 4600
3mm 76 0.38 7.65 2631
Figure 3. The stress distribution of 1mm sample at different
Weizhong et al.
22 Materials Research
The equivalent plastic strain maps of 3mm sample in the compressive deformation and fracture process at different strains are given in Figure 6. When the compressive strain increased from 3.81% to 3.82%, plastic deformation occurred on both ends of the sample, and the materials in the middle region displayed linear elastic behavior (Figure 6a-b). However, the equivalent plastic strain increased distinctly along 45° angle to the cylinder axis at a compressive strain of 3.83% (Figure 6c). When the strain was 3.84%, the material fracture happened in the direction of 45° angle to the cylinder axis, and the equivalent strain increased drastically in one narrow shear band (Figure 6d).
It can be demonstrated that the equivalent plastic strain of 1mm specimen is much larger than that of 3mm sample. The equivalent plastic strain of 1mm specimen is 0.69 at the moment of fracture, while it’s 0.12 for 3mm sample. The numerical results corroborate the compressive fracture features (Figure 1). It could be observed that 1mm specimen underwent drum-like shaped deformation, while there was no remarkable deformation for 3mm sample before fracture.
In addition to this, the inal compression failure mode of the
two samples tended towards shear failure, where the main crack developed along about a 45° angle to the cylinder axis, in accordance with the experimental results in Figure 1.
The superposition of the experimental and numerical overall stress-strain curves are plotted in Figure 7. The numerical results obtained with shear damage model, corroborated the experimental measurements. It is clear that the compressive responses of the two kinds of specimen were better predicted using a shear damage model.
4. Conclusion
1) The Mises stress distributions and the equivalent plastic strains of 1mm and 3mm samples during compression deformation and fracture were obtained by means of an
Figure 4. The equivalent strain maps of 1mm sample in the
deformation and fracture process at different strains, a) 11.62%, b) 12.25%, c) 12.53% and d) 12.6%.
Figure 5. The Mises stress distribution of 3mm sample at different compressive strains, a) 3.81%, b) 3.82%, c) 3.83% and d) 3.84%.
Figure 6. The equivalent strain map of 3mm samples in the
deformation and fracture process at different strains, a) 3.81%, b) 3.82%, c) 3.83% and d) 3.84%.
Figure 7. Comparisons between the numerical results and the
A Numerical Simulation of a Ni-based Bulk Metallic Glass During Compressive Deformation and Fracture
2015; 18(Suppl. 1) 23
ABAQUS numerical simulation. Much larger deformation was located in one narrow shear band with lower stress. The specimen suffered shear damage along about a 45° angle to the cylinder axis under a compression load.
2) The failure model of 1mm and 3mm amorphous alloy samples under compression load was predicted better using the shear damage model, consistent with the experimental testing.
3) The compressive stress-strain curves of 1mm and 3mm samples were obtained by a numerical simulation approach, in agreement with the experiment measurements. It is clear
that the plasticity of amorphous alloys is related to the sizes of the samples. The smaller specimen exhibited a larger plasticity when compared with the larger one.
Acknowledgements
The authors gratefully acknowledge the financial support by the Foundation of Heilongjiang Province Natural Science (A201103), the Foundation of Heilongjiang Province Education (12531585), and the National Natural Science of China (51371078) and (51201062).
References
1. Song KK, Pauly S, Zhang Y, Sun BA, He J, Ma GZ, et al. Thermal stability and mechanical properties of Cu46Zr46Ag8 bulk metallic glass and its composites. Materials Science and
Engineering A. 2013; 559:711-718. http://dx.doi.org/10.1016/j.
msea.2012.09.013.
2. Kim CP, Oh YS, Lee S and Kim NJ. Realization of high tensile ductility in a bulk metallic glass composite by the utilization of deformation-induced martensitic transformation. Scripta
Materialia. 2011; 65(4):304-307. http://dx.doi.org/10.1016/j.
scriptamat.2011.04.037.
3. Song KK, Pauly S, Zhang Y, Li R, Gorantla S, Narayanan N, et al. Triple yielding and deformation mechanisms in metastable Cu47.5Zr47.5Al5 composites. Acta Materialia. 2012; 60(17):6000-6012. http://dx.doi.org/10.1016/j.actamat.2012.07.015. 4. Wu Y, Wang H, Wu HH, Zhang ZY, Hui XD, Chen GL, et al.
Formation of Cu-Zr-Al bulk metallic glass composites with improved tensile properties. Acta Materialia. 2011; 59(8):2928-2936. http://dx.doi.org/10.1016/j.actamat.2011.01.029. 5. Chen G, Cheng JL and Liu CT. Large-sized Zr-based
bulk-metallic-glass composite with enhanced tensile properties.
Intermetallics. 2012; 28:25-33. http://dx.doi.org/10.1016/j.
intermet.2012.03.054.
6. Gargarella P, Pauly S, Song KK, Hu J, Barekar NS, Samadi Khoshkhoo M, et al. Ti-Cu-Ni shape memory bulk metallic
glass composites. Acta Materialia. 2013; 61(1):151-162. http:// dx.doi.org/10.1016/j.actamat.2012.09.042.
7. Brest JS, Keryvin V, Longère P and Yokoyama Y. Insight into plasticity mechanisms in metallic glasses by means of a Brazilian test and numerical simulation. Journal of Alloys and
Compounds. 2014; 586:S236-S241. http://dx.doi.org/10.1016/j.
jallcom.2013.02.041.
8. Cameron KK and Dauskardt RH. Fatigue damage in metallic glass I: Simulation. Scripta Materialia. 2006; 54(3):349-353. http://dx.doi.org/10.1016/j.scriptamat.2005.10.006.
9. Go YH, Cho J, Jeong CY, Kang CS and Park JS. Stress distribution of bulk metallic glass/metal laminate composites during uni-axial fracture. Materials Science and Engineering A. 2007; 460-461:377-382. http://dx.doi.org/10.1016/j.msea.2007.01.079.
10. Zhang Y, Mattern N and Eckert J. Study of structural anisotropy in Cu50Zr45Al5 metallic glass under uniaxial compression by
molecular dynamics simulations. Intermetallics. 2012; 30:154-157. http://dx.doi.org/10.1016/j.intermet.2012.03.012.
11. Kim HS, Kato H, Inoue A and Chen HS. Finite element analysis of compressive deformation of bulk metallic glasses. Acta Materialia. 2004; 52(13):3813-3823. http://dx.doi.org/10.1016/j. actamat.2004.04.031.