APPLICATION OF MIXED-INTEGER LINEAR PROGRAMMING IN A CAR SEATS ASSEMBLING PROCESS
Jorge Iv´an P´erez Rave
1*and Gloria Patricia Jaramillo ´
Alvarez
2Received September 10, 2009 / Accepted May 26, 2011
ABSTRACT.In this paper, a decision problem involving a car parts manufacturing company is modeled in order to prepare the company for an increase in demand. Mixed-integer linear programming was used with the following decision variables: creating a second shift, purchasing additional equipment, determining the required work force, and other alternatives involving new manners of work distribution that make it possible to separate certain operations from some workplaces and integrate them into others to minimize production costs. The model was solved using GAMS. The solution consisted of programming 19 workers under a configuration that merges two workplaces and separates some operations from some workplaces. The solution did not involve purchasing additional machinery or creating a second shift. As a result, the manufacturing paradigms that had been valid in the company for over 14 years were broken. This study allowed the company to increase its productivity and obtain significant savings. It also shows the benefits of joint work between academia and companies, and provides useful information for professors, students and engineers regarding production and continuous improvement.
Keywords: mixed-integer linear programming, continuous improvement, decision making, work organiza-tion.
1 INTRODUCTION
The car parts manufacturing industry, which is driven mainly by assembly plants, has been experiencing several changes in its production systems since more than two decades ago. The industry has discarded the typical Ford practices to move on to a more flexible manufacturing process (Motta, 2006). In Colombia, for example, two of the most important automotive assem-bly plants, with assistance from other public and private agents, developed a project for imple-menting excellence practices in the field of automotive manufacturing between 2006 and 2009 (MGC, 2009). These practices, coupled with the conditions within Colombia and Colombia’s
*Corresponding author
automotive industry, have increased the need for actions aimed at improving quality, produc-tivity, and timeliness. This improvement must be carried out systematically, and the decision-making process must be supported by data and facts. There is still much to do in this area, as reaction-oriented approaches and poor management are two characteristics of small and medium enterprises (SMEs) (Biasca, Rodr´ıguez & Andriani, 2003) and decision making is mostly driven by common sense and by the beliefs, thoughts, or mental models of a few individuals.
In order to help overcome the subjective, reaction-oriented approaches in the decision-making process of a Colombian car parts manufacturing company, we decided to explore other possi-bilities associated with a decision affecting production capacity. This decision had to be taken because of a possible future increase in demand.
To help the company identify satisfactory solutions, the research team analyzed the case and decided that the company’s needs could be satisfied by modeling and solving the current problem via the mixed-integer linear programming approach. This resulted in a study to determine, with methodological rigor, the alternatives that would produce the best results in accordance with the company’s interests.
This paper aims to contribute to the dissemination of successful experiences in operations re-search, particularly in the field of production, by analyzing policies for workforce distribution, for increasing production capacity through the purchase of machinery and for the creation of a second shift. A novel approach is taken that may inspire the development of other studies in the same field, as the decision alternatives within this approach include the possible redistribution of the work content through the integration or division of preestablished operations. This approach would make it possible to break free from the institutional paradigms for production methods that have been dominant for more than 14 years in the studied company.
2 LITERATURE REVIEW
The literature review was carried out using Scopus, one of the leading on-line scientific search engines (Codina, 2005). The search was configured to retrieve documents published between 2006 and 2010 that included the term “linear programming” in their title. Afterwards, we selected the most cited documents that discussed any issues involving the manufacturing sector.
solu-tion, the linear programming subproblem is solved via the Simplex method. Pham, Shr & Chen (2008) put forward a new framework based on integer linear programming aimed at handling the constraints imposed on the machines used for manufacturing semiconductors. The authors conclude that the framework provides an effective approach for optimizing the production cost in an efficient computational time. Zhang, Ma & Li (2008) treat inverse linear programming as a supporting method for reducing resource consumption in manufacturing systems management, leading to greater operational efficiency. Nooriet al. (2008) proposed a context of material re-quirements planning which incorporates multi-objective fuzzy linear programming. The model’s purpose was to find the optimal production rate for each product and for each period whilst min-imizing the total cost and the material requirement planning needed, thus complying with related constraints. At the end, these authors highlighted the applicability of the proposed approach in material requirements planning.
Kobetski & Fabian (2009) presented a method for combining the benefits of deterministic finite automata (DFA) for the modeling, specification, and verification of production systems with the efficiency of MILP and the supervisory control theory. This was done to contribute to the optimization of flexible manufacturing systems in terms of automation and flexibility. These authors also presented a conference paper in 2006 in which they efficiently combined MILP with control theory in order to optimize discrete event systems programming. Salami, Shahnooshi & Thomson (2009), focusing on the drought experienced by the agricultural sector of the Iranian economy between 1999 and 2000, applied linear programming to estimate the direct costs this phenomenon incurred for agriculture. They also presented a macroeconomic model to explore the indirect impact of the drought on other sectors of the economy. The authors estimated a direct cost of USD $1605 million, i.e. 30.3% of the total added value in Iranian agriculture. This in turn had an adverse impact on other agricultural and livestock sub-sectors (livestock, fisheries, and forestry), as well as on the manufacturing and service sectors. They conclude that it is important to give more attention to drought phenomena by implementing more effective strategies and elements for their management. Montoya & O ˜nate (2009) used integer lineal programming to address the issue of vehicle positioning in automated manufacturing systems in order to contribute to the reduction of lead time in semiconductor manufacturing processes, thus minimizing the maximum time required to respond to a request for transportation. Liet al.(2009) formulated an MILP model that is useful for programming a way of addressing emergencies involving petroleum-derived products. The model seeks to minimize transportation costs and the impact of petroleum-derived products shortage. Wu (2010) presents a linear programming model applied to logistics. The model favors the optimization of industrial production loading management, whose objective function includes the cost of raw materials, machines, workforce, overtime, outsourcing, stock, and other costs related to import quotas. The author concludes by stating that this is an effective model. Wu also strengthens the model’s practical implications by assessing loading management plans in various future scenarios.
(2010) used a case study-like MILP to optimize the mixed mining of exploitable blocks in a limestone quarry used for manufacturing cement in northern Pakistan. Each block is modeled using a binary variable (0-1) and the project seeks to reduce associated mining costs while satis-fying the quantity and quality constraints that characterize the extraction industry. Compared to the traditional policy, the case study generated cost savings. Hidalgo & D´ıaz (2010) used MILP to represent a real manufacturing system that uses MRP as a planning tool. The model involves capacity constraints in the production environment as well as constraints arising from company-specific conditions. Additionally, it was incorporated into a user-friendly interface for use by people without expertise in mathematical modeling in order to give practical rigor to the produc-tion and material purchasing soluproduc-tions derived from the use of the model that minimize the total cost of demand meeting. Wanget al. (2010) used multi-objective fuzzy linear programming, to analyze profitability during the supplier selection process. The model considers, amongst other things, the preparation of materials for outsourced firms, technological transition, quality, and lead time.
The prevalence of recent studies on the application of linear programming to the field of manu-facturing is evident. It is also true that these studies include other elements such as fuzzy logic and multi-objective analysis. It is worth noting that none of the cited works has addressed the reconfiguration of work content through strategies of integration or division of preset operations using MILP. Therefore, this paper’s approach can go beyond providing the results of the case study by inspiring other academic alternatives.
3 CONCEPTUAL FRAMEWORK
The following conceptual framework is presented to facilitate the understanding of further sections in this paper.
3.1 Process
A process can be understood as a set of elements (e.g.personnel, finances, facilities, equipment, techniques, methods, activities) that are related to each other and transform their input into results (Mart´ın & Mallol, 2002). Another author defines it as a set of operations, composed of materials, machines, methods and people. These add value and seek to transform raw materials into finished products that are useful for the consumer (Biasca, Rodr´ıguez & Andriani, 2003).
3.2 Cycle time
The time a process takes to finish one unit of a given product. It is measured from the moment in which the unit arrives (Ramires, Marroqu´ın & C´ordoba, 2007). In other words, it is the time between the start of two successive production cycles of a certain good (Vidal & Garc´ıa, 2006).
3.3 Workplace
3.4 Standard time
The time required by a skilled worker to carry out a given task at a normal pace. It includes the time needed to execute the task and the breaks required by the workers to recover from fatigue and to meet their personal needs (Kanawaty, 1996).
3.5 Supplementary time
A percentage of additional time included in the standard time. During this time, employees recover from fatigue, meet their personal needs and/or perform other activities that involve inter-rupting their work due to policies or conditions established by their company (Caso, 2006).
3.6 Vehicle
In this company, a complete set of car seats is called a vehicle. The concept varies depending on the operation performed. For example, a vehicle produced at the workplace calledensamble inicial asiento delantero derechois a right front seat that underwent the initial assembly process. However, in the workplace calledvapor y control final asiento delantero, seat placement (left or right) is not taken into account. Therefore, a vehicle, in this case, is a pair of seats (right and left) that received steam and a quality control check.
4 PROBLEM DESCRIPTION
We focus on one of the car seat production lines of a car parts manufacturing company located in Medell´ın (Colombia). At the time of the study the production line operated under three subpro-cesses spanning 14 workplaces that operate under a Push-type production system where produc-tion is programmed after making demand forecasts and adding one safety stock. Table 1 shows the main characteristics of each workplace.
Table 1 shows the basic time (Tbas) for each workplace. The sum of basic time plus supple-mentary time (sup) equals standard time (Ttipo). Similarly, given the amount of machines, re-searchers registered the maximum number of workers per shift that can be assigned to a given workplace. For example: theEnsamble AD derworkplace has a value of one (1) for this field because it only has one machine, and it can be operated by only one person. The letter “M” represents such a large value that it is not worth considering constraints in work force (MO). The cell with the value N/A stands for not applicable. The table also shows whether there are con-straints for a machine. Similarly, the maximum number of employees and equipment concon-straints yield the maximum number of working hours per shift.
Table 1 also shows the cost of purchasing a new machine to increase capacity in a particular workplace together with the increase of available working hours this would generate. The last column in the table shows the current production capacity. It is measured in number of vehicles per hour.
In addition to considering the alternatives proposed by the company, namely: number of people to program, investment in machinery/equipment and creating a second shift, the research team analyzed the case and found the possibility of incorporating new alternatives: new ways of orga-nizing work content by integrating/dividing pre-established operations. For example, supposing one workplace required 1.2 workers and another one required 1.8, then 4 employees would be programmed if no integration were performed. However, if operations were merged, it is possi-ble that only three employees and some adjustments in training and tools would suffice, meaning less idle times and lower costs.
In the situation described above we see a gap between current and ideal outcomes. This con-stitutes the research problem that the research team seeks to solve by formulating the following project objective: to determine the work force assignment and production configuration policies that will make it possible to minimize the total cost generated within two years, while complying with a daily demand of 124 vehicles and considering the following decision alternatives:
1. Make no changes.
2. Purchase additional equipment for workplaces where there are limitations.
3. Separate the operation calledenganche finalfrom the workplace called tapizadoAD. 4. Separate the operation called preensamble from the workplace called ensamble AD
izquierda.
5. Merge workplaces. 6. Create a second shift.
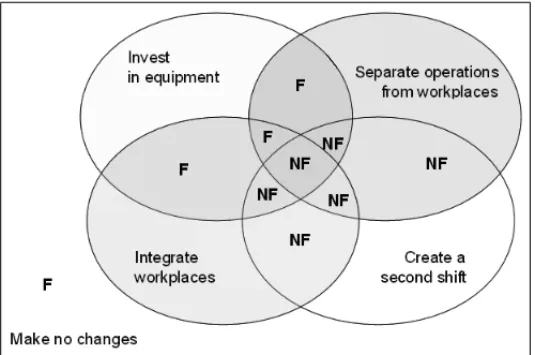
Figure 1 shows the intersections that are feasible (F) and not feasible (NF) according to the company’s management guidelines.
Figure 1– Venn diagram for the events regarding decision alternatives.
that purchasing additional machines is attractive only if the investment can be recouped within two years at most.
5 METHODOLOGY
The methodology is based upon the five guidelines described by Taha (2004): problem definition, model construction, resolution, validation and implementation. Additionally, this work imple-mented the entire CAP-Do cycle (Check, Analyze, Plan and Do) for each stage (Howell, 2006). To understand the problem it was necessary to gain a deeper understanding of the structure and functioning of the production line under study and to use the data obtained from the follow-ing departments: production, human resources management, maintenance, internal logistics and quality control. The data was obtained both from administrative and operational staff.
The field work took three months and was supported by the company’s personnel, who were guided by the research team. Similarly, the plant’s director was asked about the different decision alternatives he was intertested in. Initially, the options were motivated by an increase in demand and consisted of creating a second work shift, making no changes, and investing in additional machinery. All options were mutually exclusive. However, having analyzed the case in depth, the research team proposed other decision alternatives that were more in accordance with line balancing strategies. The additional alternatives that the research team proposed were to add operations to some workplaces and separate them from others.
As the team gained a deeper understanding of the production line, the corresponding mind maps where documented, and progress was made in the development of the model. The manager of the assembly plant and the company directors were periodically notified of the advances made in this regard so that their contributions could be taken into account before proceeding with further phases of the project. Upon completing the mathematical formulation of the model, the researchers proceeded to transfer it to GAMS 21.5. The mathematical formulation was then solved using the CPLEX solver (IBM LOG, 2009). A real test was conducted in the production plant to validate the model’s results. It lasted four hours and was conducted on a non-working day (Saturday). Statistics were collected for: number of units produced, bottlenecks, and start and end times for the first produced unit. Afterwards, the corresponding comparisons between expected and obtained results were also made by means of a simulation with the Arena software (version 12). The research team’s work ended with a presentation of the results at a company conference which was attended by the plant director and the process managers.
6 MATHEMATICAL MODEL
6.1 Parameters
D: Daily demand (124 vehicles)
A: Cost of an employee in two years. It includes basic salary, benefits, snacks, etc. (COP $18’648,000).
generated by night shift hours, the increase in the cost of utilities, the cost of an extra employee at the warehouse, the cost of a person charged with maintenance, and the cost of one supervisor. (COP $182’313,384).
Ck: Cost of additional equipment for thekworkplace. This workplace has capacity constraints =1, 2, 4, 5, 8, and 13. That is to say, these are investment alternatives.
Fi: Number of vehicles produced by each worker in one hour at the k workplace. Withi = 1, . . . ,14.
E: Increase in finished vehicles per shift resulting from the event of separating the operation called enganche final from the workplace calledtapizado ADand appointing one worker to per-form this operation (46 units per shift). This is an empirical practice in the company. It is used in the event of delays in production and is represented in the model as an additional alternative. Ce: Cost of separating theenganche finaloperation from thetapizado ADworkplace. Investment made for the equipment plus the worker in two years. (COP $38’648,000).
L: Increase in finished units per shift resulting from the event of separating the operation called preensamblefrom the workplace calledensamble AD izquierdaand appointing one worker to perform this operation (31 units).
Cl: Cost of separating thepreensambleoperation from theensamble AD izquierdaworkplace. Investment made for the equipment plus the worker in two years. (COP $19’148,000).
Gk: Available hours per shift at thekconstraining workplace=1, 2, 4, 5, 8, and 13.
H: Additional hours per worker obtained in any k workplace after purchasing one additional machine. (9.5).
6.2 Decision variables •Integer:
Wi: Number of workers required at workplaceiin order to comply with the required production for each day.
•Continuous:
Xi: Number of hours per worker required at workplacei in order to comply with the expected production for each day. We considered that it would be important to differentiate the required amount of hours and the required amount of workers because a solution with rounded decimals is not necessarily an optimal one.
•Binary:
Yt: Event of creating or not creating a second shift.
Y Ck: Event of purchasing or not purchasing an additional machine and assigning it to the k workplace, withk=1, 2, 4, 5, 8, and 13.
Yl: Event of separating or not separating the preensamble operation from the ensamble AD izquierdaworkplace.
Mergings accepted by the company for the workplaces composing the subprocess calledasiento delantero:
Iens D I: Event of merging or not merging theensamble derechoandensamble izquierdo opera-tions (workplaces 1 and 2) into a new workplace.
Ieng T A D: Event of merging or not merging theengancheandtapizadoworkplaces (workplaces 3 and 4) into a new workplace.
Ieng T A D V ap: Event of merging or not merging theenganche-tapizado-vaporand control work-places (workwork-places 3, 4 and 5).
Ivap emp: Event of merging or not merging thevaporandempaqueworkplaces (workplaces 5 and 6).
Merging of workplaces within the subprocess calledasiento trasero:
Ieng−tap AT: Event of merging or not merging theengancheandtapizado AToperations (work-places 7 and 8).
Ieng−tap−vap AT: Event of merging or not merging theenganche,tapizadoandvapor AT opera-tions (workplaces 7, 8 and 9).
Itap−vap AT (workplaces 8 and 9): Event of merging or not merging thetapizadoandvapor AT operations (workplaces 8 and 9).
Ieng−vap AT: Event of merging or not mergingengancheandvapor AT(workplaces 7 and 9).
Merging of workplaces within the subprocess calledespaldar trasero:
Itap−ens E T: Event of merging or not merging tapizadoandensamble ET(workplaces 10 and 11).
Itap−ens−vap E T: Event of merging or not mergingtapizado, ensambleand vapor ET (work-places 10, 11 and 12).
Iens−vap E T: Event of merging or not merging the ensambleandvapor EToperations (work-places 11 and 12).
Ii ns−emp AT E T: Event of merging or not merginginspecci´on ATETwithempaque ATET (work-places 13 and 14).
6.3 Objective function
24 months. These profits will be compared with the profits that would be generated, during the same period, if a second shift were created.
MinZ = A 14
X
i=1
Wi +BYt+ X
∀k
CkY Ck+CeYe+ClYl
6.4 Constraints
At most, only one single alternative among the following may be selected: create an additional shift, reallocate operations, or invest in equipment for the workplaces having capacity limitations.
Y Ck+Ye+Yl ≤3(1−Yt)
At most, only one of the following choices can be selected for each subprocess: create a second shift or use one single workplace merging alternative.
Asiento delantero(front seat) subprocess:
Iens D I+Yt ≤1
Ieng T A D+Ieng T A D V ap+Yt ≤1 Ivap emp+Ieng T A D V ap+Yt ≤1
Asiento trasero(rear seat) subprocess:
Ieng−tap AT +Ieng−tap−vap AT +Itap−vap AT +Ieng−vap AT +Yt ≤1
Espaldar trasero(rear seat back) subprocess:
Itap−ens E T +Itap−ens−vap E T +Iens−vap E T +Yt ≤1 Ii ns−emp AT E T +Yt ≤1
Daily demand:
If there is any merging of workplaces, it is no longer logical to speak of 14 workplaces, and therefore compliance with demand can not be required at a workplace that no longer exists because of the fusion. This situation is represented as follows for the merging of workplaces 1 and 2:
F1X1≥124(1−Iens D I) F2X2+31Yl−96Iens D I ≥124
More specifically, if Iens D I = 1 (the merging ofensamble derechaandensamble izquierdais performed), the constraint for workplace “1” is as follows:
F1X1≥0
This would require that, under a cost minimization objective, X1 take the value of zero (0); meaning that no hours per worker are assigned.
If the constraint in workplace 2 is observed, one can see that variable “Iens D I” is accompanied by coefficient 96. This parameter is calculated by comparing the standard times (table 1) of the workplaces. The parameter represents that, at the end of each shift, the capacity of workplace “2” is reduced by 96 units because, due to the merging, it now takes longer to process one unit. Likewise, the other centers were merged.
Workplace 3:
F3X3≥ D 1−Ieng T A D−Ieng−T A D−V ap Workplace 4:
F4X4+46Ye−70Ieng T A D−186Ieng−T A D−V ap≥ D Workplace 5:
F5X5≥ D 1−Ieng−T A D−V ap−Ivap−emp Workplace 6:
F6X6−455Ivap−emp≥ D Workplace 7:
F7X7≥ D 1−Ieng−tap AT−Ieng−tap−vap AT +Ieng−vap AT Workplace 8:
F8X8−55Ieng−tap AT −114Ieng−tap−vap AT −60Itap AT−vap AT ≥D Workplace 9:
F9X9−115Ieng−vap AT ≥D 1−Ieng−tap AT−vap AT −Itap−vap AT Workplace 10:
F10X10≥D 1−Itap−ens E T −Itap−ens−vap E T Workplace 11:
F11X11−170Itap−ens E T −251Itap−ens−vap E T −83Iens−vap E T ≥ D Workplace 12:
F12X12≥D 1−Iens−vap E T −Itap−ens−vap E T Workplace 13:
F13X13≥D 1−Ii ns−emp AT E T Workplace 14:
F14X14−137.5Ii ns−emp AT E T ≥D
Number of workers occupying workplaces: Wi ≥ XHi
All workplaces must have at least one worker, except for the workplaces that disappear after merging with others.
Non negativity and integrality: Wi ∈Non negative integers Xi ≥0,∀i
Yt,Y Ck,Ye,Yl,Iens D I,Ieng T A D,Ieng T A D V ap,Ivap emp,Ieng−tap AT, Ieng−tap−vap AT,Itap−vap AT ∈ {0,1}
Ieng−vap AT,Itap−ens E T,Itap−ens−vap E T,Iens−vap E T,Ii ns−emp AT E T ∈ {0,1}
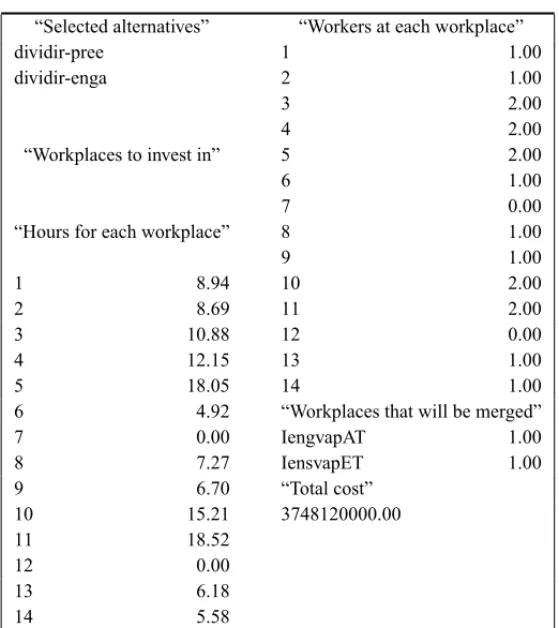
7 MODEL SOLUTION
The model’s solution is presented in Table 2. It shows the following alternatives: reallocating operations, workplaces to invest on, the hours per worker consumed at each workplace, the amount of workers required, the merging of workplaces, and the value of the proposed objec-tive function. One can see that a production configuration that minimizes operation costs within two years consists of mergingengancheandvaporinto theasiento trasero(rear seat) subprocess, as well as theensambleandvaporworkplaces in theespaldar trasero(rear seat back) subpro-cess. Similarly, in theasiento delanterosubprocess, it is necessary to separate thepreensamble operation from theensamble inicial silla izquierdaworkplace, thus creating a new workplace. Regarding thetapizadoworkplace, it is necessary to separate the enganche finaloperation in order to decrease its cycle time and increase its capacity; this will result in a new workplace. Two workplaces disappear from the production line after implementing the merging strategies. Nevertheless, the tally remains 14, since the separation of operations from the initial worplaces resulted in the creation of two new ones. The configuration of the production line includes 19 workers: 17 for the typical workplaces and two more for the new workplaces. This configuration requires no additional investment for the current workplaces. There is even less need to create a second shift, which was the company’s strategy of choice before this study. The estimated cost in two years is COP $374’812,000, which means COP $15’617,167 per month. It is worth noting that a sensitivity analysis done using the changes in the hours available at each workplace in order to explore the consequences of creating a second shift revealed a total future two year cost of COP $573’921,384, representing COP $23’913,391 per month. This value is much higher if compared with the optimal policy revealed by the model.
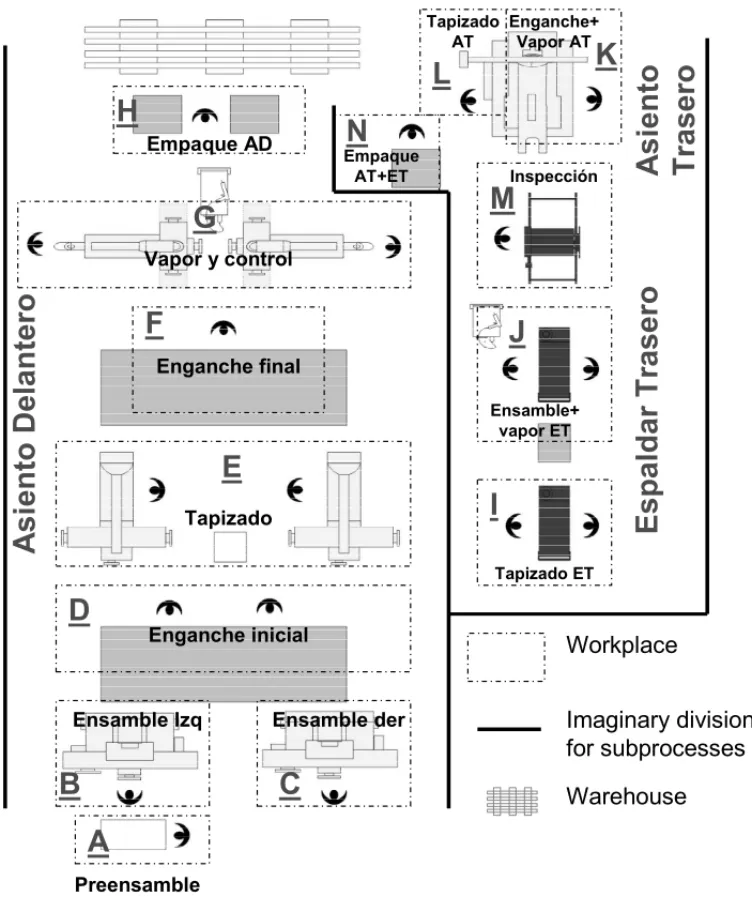
Figure 2, considering the model’s solution, presents the layout indicating the amount of workers and the new work configuration. This implies breaking the company´s traditional production paradigms. This figure shows the two subprocesses that form the assembly line: delantera y trasera(front and rear). Each one presents the location of workplaces and the amount of person-nel allocated, 11 for thedelanterasubprocess and eight for thetraserasubprocess.
Table 2– Summary of the model solution in GAMS.
“Selected alternatives” “Workers at each workplace”
dividir-pree 1 1.00
dividir-enga 2 1.00
3 2.00
4 2.00
“Workplaces to invest in” 5 2.00
6 1.00
7 0.00
“Hours for each workplace” 8 1.00
9 1.00
1 8.94 10 2.00
2 8.69 11 2.00
3 10.88 12 0.00
4 12.15 13 1.00
5 18.05 14 1.00
6 4.92 “Workplaces that will be merged”
7 0.00 IengvapAT 1.00
8 7.27 IensvapET 1.00
9 6.70 “Total cost”
10 15.21 3748120000.00
11 18.52
12 0.00
13 6.18
14 5.58
the efficiency of the balancing. In this manner, the typical equation for finding the balancing efficiency of an assembly line was used (Renderet al., 2004), and thel´ınea delanterasubprocess was found to have an efficiency level of 70%, while the l´ınea traserasubprocess yielded an efficiency level of 75%.
8 VALIDATION
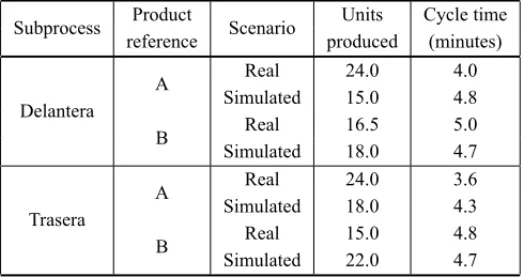
On October 11, 2008 a test was conducted in the production plant to validate the recommended production strategy. The test run started at 9:11 am and finished at 1:50 pm. A 30-minute lunch break was included. Prior to the start of the test, the 19 employees required for it received a one-hour training session. The validation involved conducting an analysis by directly observing the performance of the work in progress as well as ensuring the feasibility of keeping operations integrated. Based on the results of the model, a discrete simulation was used to monitor the behavior of variables such as: output time for the first and last vehicles, production quantity, and time between vehicles. Results are shown in Table 3.
Workplace
Imaginary division
for subprocesses
Warehouse
Figure 2– Layout including the operations proposal as per the model’s solution.
logistics processes, as well as the tactical staff were present during the test run. At the end, the research team and the company’s employees were satisfied with the results. It is worth noting that 48 vehicles were produced in the simulation, whereas the vehicles produced in the real life test at 1:50 pm were 51.
Table 3– Results of the validation through a test run at the plant and through a simulation.
Subprocess Product Scenario Units Cycle time
reference produced (minutes)
Delantera
A Real 24.0 4.0
Simulated 15.0 4.8
B Real 16.5 5.0
Simulated 18.0 4.7
Trasera
A Real 24.0 3.6
Simulated 18.0 4.3
B Real 15.0 4.8
Simulated 22.0 4.7
9 CONCLUSIONS
At the beginning of the study the company had considered only three decision alternatives: separating the operations carried out in two of its critical workplaces, creating a second shift, and investing in additional machinery / equipment. After analyzing the situation, the research team found the opportunity to go beyond traditional production paradigms by using strategies to merge / separate operations. This effectively formed part of the optimal solution to the prob-lem. Based on previous experiences and other decision criteria, the managers of the car parts manufacturing company believed that creating a second shift was an unavoidable course of ac-tion, which would have increased the operation costs. However, thanks to the study it became evident that reconfiguring the production style without purchasing additional machinery would make it possible to avoid creating a second shift. This would in turn lead to savings of more than 90 million Colombian pesos per year.
This study shows the relevance of joint work between academia and the production sector through the field of operations research to find solutions to complex issues in the business world. This study particularly addresses the problem of a knowledge gap in the car parts man-ufacturing company in terms of decision-making for minimizing operation costs. Nevertheless, the benefit of the university-company relationship and the aforementioned science of decision-making is only effective when the business sector is aware of the importance of supporting a decision-making process by complementing experience (which is fundamental) and common sense, amongst other things, with a scientific component based on data and facts. Academia also plays a key role in this regard by producing and disseminating results from applied research projects that contribute to raising awareness in the production sector and spreading socially useful knowledge.
of the studied company, and it could also serve the same purpose if applied by other firms from the same industry. It is also a useful real-life example for the teaching of linear programming. In addition to the analytical results of the case study, the proposed approach can inspire other developments associated with strategies for reconfiguring operation contents through decisions regarding the merging/separation of preset operations using mixed-integer linear programming, something that was not found in the literature review conducted.
REFERENCES
[1] BELLABDAOUIA & TEGHEMJ. 2006. A mixed-integer linear programming model for the continu-ous casting planning.International Journal of Production Economics,104(2): 260–270.
[2] BIASCAR, RODR´IGUEZM & ANDRIANIC. 2003. Un nuevo sistema de gesti ´on para lograr PYMES de clase mundial. Ed. Norma. 352 p.
[3] CASOA. 2006. T´ecnicas de medici´on del trabajo. FC Editorial. Ed. 2. pp. 215.
[4] CODINAL. 2005.Scopus: el mayor navegador cient´ıfico de la Web,14(1): 44–49.
[5] DEFERSHAF & CHENM. 2008. A linear programming embedded genetic algorithm for a integrated cell formation and lot sizing considering product quality.European Journal of Operational Research, 187(1): 46–69.
[6] HANDANIZ, WAN S, HASHIMH & MANANZ. 2010. Holistic approach for design of minimum water networks using the mixed integer linear programming (MILP) technique.Industrial and
Engi-neering Chemistry Research,49(12): 5742–5751.
[7] HIDALGOL & D´IAZH. 2010. Optimising a two-echelon capacity-constrained material requirement manufacturing system using a linear programming model.Ingenier´ıa e Investigaci´on,30(1): 168– 173.
[8] HOWELLM. 2006. Actionable performance measurement: a key to success. American Society for Quality (ASQ). United States of America, p. 4.
[9] IBM ILOG CPLEX. 2009. User’s Manual for CPLEX, International Business Machines Corpora-tion, 2009.
[10] KANAWATYG. 1996. Introducci´on al estudio del trabajo. 4ta Edici ´on. Limusa-Noriega. 507 p.
[11] KOBETSKI A & FABIAN M. 2009. Time-optimal coordination of flexible manufacturing systems using deterministic finite automata and mixed integer linear programming.Discrete Event Dynamic
Systems: Theory and Applications,19(3): 287–315.
[12] LIX, QIUT, ZHAOJ & CHENB. 2009. Mixed integer linear programming model for emergency scheduling of oil products.Journal of East China University of Science and Technology (Natural
Science Edition),35(3): 363–367.
[13] MART´INS & MALLOLA. 2002. Creaci´on de un agente para la gesti ´on de procesos. IX Congreso Nacional de Inform´atica M´edica. En: Informed. pp. 249.
[14] MGC. 2009. Modelo de gesti´on para la competitividad en proveedores del sector automotor Colom-biano. XI Convenci´on Iberoamericana de Excelencia en la Gesti ´on. Abril 23.
[15] MONTOYAJ & O ˜NATE G. 2009. Integer linear programming formulation of the vehicle position-ing problem in automated manufacturposition-ing systems.Journal of Intelligent Manufacturing, pp. 1–8. http://dx.doi.org/10.1007/s10845-009-0316-4. [Le´ıdo 27/12/2010].
[16] MOTTA J. 2006. La Reestructuraci´on del Sector Autopartista a Nivel Internacional. Actualidad Econ´omica, A˜no XVI, No. 58 enero-abril. pp. 26.
[17] NOORIS, FEYLIZADEHM, BAGHERPOURM, ZORRIASSATINEF & PARKINR. 2008. Optimiza-tion of material requirement planning by fuzzy multi-objective linear programming. Proceedings of the Institution of Mechanical Engineers, Part B:Journal of Engineering Manufacture,22(7): 887– 900.
[18] PHAMH, SHRA & CHENP. 2008. An integer linear programming approach for dedicated machine constraint. Proceedings – 7th IEEE/ACIS International Conference on Computer and Information Science, IEEE/ACIS ICIS 2008, In conjunction with 2ndIEEE/ACIS int. Workshop on e-Activity, IEEE/ACIS IWEA 2008, art. no. 4529800, pp. 69–74.
[19] RAMIRESS, MARROQU´IN E & C ´ORDOBA J. 2007. Reasignaci´on de Tareas a Operarios en una Estaci´on de Trabajo: un Enfoque Evolutivo.Revista de la Ingenier´ıa Industrial,1(1): 1.
[20] REHMANS & ASADM. 2010. A mixed-integer linear programming (milp) model for short-range production scheduling of cement quarry operations.Asia-Pacific Journal of Operational Research, 27(3): 315–333.
[21] RENDERB & HEIZERJ. 2004. Principios de administraci ´on de operaciones. Pearson Educaci ´on, Ed. 5. pp. 351.
[22] SALAMIH, SHAHNOOSHIN & THOMSONK. 2009. The economic impacts of drought on the econ-omy of Iran: An integration of linear programming and macroeconometric modelling approaches.
Ecological Economics,68(4): 1032–1039.
[23] TAHA H. 2004. Investigaci´on de operaciones. Pearson Education. M´exico. Ed. 7, “en espa˜nol”. pp. 8–9.
[24] VASANT P & BARSOUMN. 2006. Fuzzy optimization of units products in mix-product selection problema using fuzzy lineal programming approach.Soft Computing,10(2): 144–151.
[25] VIDAL P & GARC´IAP. 2006. El problema de la programaci ´on del lote econ´omico (ELSP): Una revisi´on de la literatura. X Congreso de Ingenier´ıa de organizaci´on, Valencia, 7 y 8 septiembre.
[26] WANGE, CHEN Y, WANGW & SUT. 2010. Analysis of outsourcing cost-effectiveness using a linear programming model with fuzzy multiple goals.International Journal of Production Research, 48(2): 501–523.
[27] WUY. 2010. A time staged linear programming model for production loading problems with import quota limit in a global supply chain.Computers & Industrial Engineering,59(4): 520–529.