471
Metallurgy and materials
Metalurgia e materiais
Abstract
Initially studied was the effect of the casting mode on the electrical conductivity of AA4006 aluminum alloy sheets produced by both Twin Roll Casting (TRC) and by the semi-continuous Direct Chill (DC) industrial processes, when compared to sheets with commercial purity (AA1050) and high purity aluminum (AA1199). Then, the effects of heat treatments on the electrical conductivity of the AA4006 alloy sheets produced by TRC were also studied. Isochronous and isothermal heat treatments al-lowed to obtain the precipitation and solution kinetics of the intermetallic compounds. The precipitation kinetics was analyzed with the help of the Johnson-Mehl-Avrami-Kolmogorov equation.
Keywords: AA4006 alloy, electrical conductivity, microstructure, continuous casting, semi-continuous casting.
Daniel Sierra Yoshikawa
Doutor
Universidade de São Paulo - USP Escola Politécnica
Departamento de Engenharia Metalúrgica e de Materiais São Paulo – São Paulo - Brasil
Leandro Gomes de Carvalho
Doutor
Universidade de São Paulo - USP Escola Politécnica
Departamento de Engenharia Metalúrgica e de Materiais São Paulo – São Paulo - Brasil
Ronald Lesley Plaut
Professor Associado
Universidade de São Paulo - USP Escola Politécnica
Departamento de Engenharia Metalúrgica e de Materiais São Paulo – São Paulo - Brasil
Angelo Fernando Padilha
Professor Titular
Universidade de São Paulo - USP Escola Politécnica
Departamento de Engenharia Metalúrgica e de Materiais São Paulo – São Paulo - Brasil
Effect of casting mode and
thermal treatments on the
electrical conductivity of the
AA4006 aluminum alloy
http://dx.doi.org/10.1590/0370-44672015700072
1. Introduction
Electrical conductivity measure-ments can be used for the evaluation of the concentration of solute atoms in the solid solution of aluminum alloys, since this property decreases with increase of the solute content in these alloys (Oliveira and Padilha, 2009). In this way, heat treatments, which alter the solute concentration in solid solution, strongly inluence the electrical conductivity.
The AA4006 aluminum alloy is an alloy of the Al-Fe-Si system, wrought
al-loy, non-heat- treatable, in other words, not susceptible to precipitation harden-ing. Due to its (Fe + Si) content being higher than that for the commercial purity aluminum (AA1050, AA1070, AA1100), the AA4006 alloy presents higher mechanical properties and lower ductility. The number of studies on the AA4006 alloy available in literature (Yeung and Lee, 1998; Souza et al., 2012) is extremely small; only about a dozen publications.
For the present research, two
Alloys Si Fe Cu Mn Mg Al Other 4006 TRC 1.100 0.700 0.020 0.020 - 98.13 0.03
4006 DC 1.089 0.630 - - 0.001 98.27 0.01 1050 TRC 0.110 0.281 0.003 0.003 0.004 99.59 0.01 1050 DC 0.111 0.416 0.002 0.003 0.001 99.47 0.01 1199 0.002 0.001 - 0.005 - 99.995
-Table 1
Chemical composition (mass%) of the AA 4006 aluminum alloys, of the commercial purity aluminum AA1050, DC and TRC and the high purity aluminum AA1199.
2. Materials and methods
The studied materials, the com-mercial purity aluminum AA1050 and the alloy AA4006, have been produced by two different and distinct processes, namely Direct Chill (DC)
and Twin Roll Casting (TRC), both received in the form of sheets with 8 mm thickness for DC and 6 mm for TRC, respectively. The high purity aluminum (99.995% Al), AA1199,
was received in the form of ‘as-cast’ blocks which were cut into strips of 20 mm width by 100 mm length and 8 mm thickness. Compositions are given in Table 1.
All electrical conductivity mea-surements were performed with a digital conductivity apparatus, which is based on the eddy current phenom-ena. The calibration standard used for
the conductivity measurements was an aluminum with 59.4 %IACS. Ten electrical conductivity measurements were performed on each evaluated sample surface.
From the conductivity measure-ments, the transformed fractions f(t) under isothermal conditions can be ex-pressed according to Equation 1 (Røyset and Ryum, 2005):
) ( 0 ) ( 0
1
1
1
1
)
(
T tt
f
σ
σ
σ
σ
−
−
=
(1) (2)Where σ0, σt and σT are, respec-tively, the conductivities of the samples: at the beginning, at time t and at equilibrium, for a fixed
precipitation temperature.
After the transformed fraction is evaluated several times, it is possible to describe the phase transformation
kinetics, under an isothermal condi-tion, using the Johnson-Mehl-Avrami-Kolmogorov (JMAK) relationship, presented in Equation 2:
) (
exp
1
)
(
t
ktnf
=
−
−Where f(t) is the transformed frac-tion, while n and k are the Avrami coeficients, constants independent of time. The n coeficient is related to the precipitation nucleation mechanism. Under an ideal situation, in which all particles nucleate simultaneously and
randomly, the value of n is equal to 3/2. If the nucleation rate is constant during transformation, the value of n will be 5/2 (Christian, 1975).
In order to verify if the JMAK equation is applicable to the present precipitation reaction, the experimental
data were transferred to a linearized form as a function of the log of time
(log t). In case this relation is applicable, data should suggest a straight line, its slope being the Avrami coeficient, n (Røyset and Ryum, 2005; Rios and Padilha, 2007).
3. Results and discussion
Table 2 presents a comparison of the values obtained for the electri-cal conductivity of the high purity aluminum AA1199, the commercial purity aluminum AA1050 and the
AA4006 alloy. The AA1199 alumi-num was analyzed under the condi-tions of: wrought (50% reduction) and recrystallized, after heat treatment at 250 °C for 1 h. Comparisons have also
been performed on the sample surface for the AA1050 and the AA4006 al-loys, produced by the DC and TRC processes, both in the ‘as-received’ condition.
Table 2
Electrical conductivity (%IACS) for the high purity aluminum AA1199 in the wrought condition (50% reduction) and recrystallized (heat treatment at 250 °C for 1 h), also for the AA1050 and the AA4006 alloys, produced by the DC and TRC pro-cesses, in the ‘as-received’ condition.
Aluminum
and alloys AA1199 wrought
AA1199
recrystal-lized
AA1050 -
DC AA1050 - TRC AA4006 - DC AA4006 - TRC Conductivity
473
Sheet region top bottom Centre Conductivity (%IACS) 53.3 ± 0.5 53.7 ± 0.5 50.9 ± 0.5
Table 3 Electrical conductivity (% IACS) for the aluminum AA4006TRC in different regions of the sheet in the ‘as-received’ condition.
Electrical conductivity values for the high purity aluminum AA1199 under the evaluated conditions, namely cold rolled and recrystallized are identical, consider-ing the experimental measurement errors. This result is very important, since it re-veals that the eddy current technique used in the measurements of the electrical con-ductivity is particularly insensitive to the amount of crystalline defects introduced by straining, in a material practically devoid of solute. Therefore, variations in conductivity that will be measured in the alloys can be attributed predominantly
to solute variations in the solid solution. When comparing the electrical conductivity results (Table 2) obtained between the DC and TRC processes, both for the AA1050, as well as for the AA4006 alloy, no signiicant differences could be detected, taking the experimental error into account. Moreover, the electrical conductivity values for the high purity aluminum AA1199 (Table 2) and the AA1050 aluminum are higher than those measured for the AA4006 alloy. There-fore, it may be observed that the electrical conductivity decreases with the increase in
the total quantity of solute, following the decreasing order: AA1199 > AA1050 DC ≈ AA1050 TRC > AA4006 DC ≈ AA4006 TRC (Oliveira and Padilha, 2009; Souza et al., 2012).
Upon analyzes of the studied mate-rials, it was observed that only the alloy AA4006 TRC presented variations in electrical conductivity along its thickness. This behavior can be followed in Table 3, which shows the conductivity in three distinct regions of the samples of the alloy AA4006TRC, at the surfaces (top and bottom) and at the sheet center.
The analysis of the results of Table 3 suggests a higher solute amount in solid solution in the interior of the sheet than on the surface. Moreover, the differences in conductivity between both surfaces, even being compatible with the experimental error, can also be attributed to the
differ-ences in the cooling rate and, hence, to the different solute concentrations in solid solution and precipitated.
As the results obtained for both top and bottom surfaces are compatible in the ‘as-received’ condition, the inluence of the thermal treatments on variations
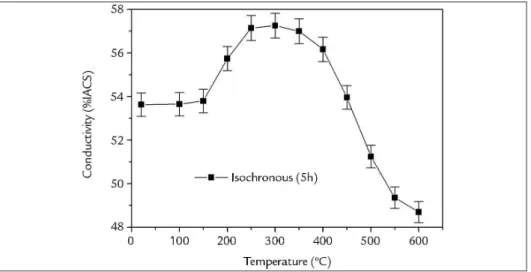
of the electrical conductivity was analyzed with regards only to the bottom surface. Figure 1 presents the isochronous curve of the electrical conductivity for 5 h heat treatments as a function of temperature changes, for AA4006TRC samples, on the bottom surface.
Figure 1 Isochronous curve for the electrical conductivity as a function changes in temperature for 5 h heat treatments for the AA4006TRC alloy, bottom surface.
In Figure 1, it can be observed that, in its initial part, the electric conductiv-ity is kept constant, between 20 °C and 150 °C, with values close to the ‘as-received’ condition (~53.5 %IACS). How-ever, in the 150 °C to 250 °C temperature range, conductivity increases, stabilizing on a plateau in the 250 °C to 350 °C tem-perature range (~57.2 %IACS). From 350 °C onwards the conductivity decreases, reaching the value of 49.0 %IACS at 600 °C. The conductivity increase, with reference to the initial condition, is asso-ciated with the solute exit from the solid solution through precipitation, while the conductivity decrease is associated with the increase in solute in solid solution,
due to the solution of precipitates (Souza et al., 2012). Therefore, despite the maxi-mum precipitation occurred at about the 350 °C, it was at only at 450 °C that the so-lution of intermetallic compounds started to predominate.
In order to perform a more detailed analysis of the AA4006TRC alloy, starting from isochronous (Figure 1), three tempera-tures were selected for the isothermal treat-ments. The 550 °C temperature was chosen for the down slope in conductivity, where solution annealing or precipitate solution occurs, while the 250 and 300 °C tempera-tures were chosen for the range presenting the highest conductivities, where maximum precipitation in the matrix occurs.
Figure 2 presents the electrical conductivity curves as a function of heat treatment time (solution annealing) at 550 °C for sheet bottom samples of the AA4006TRC alloy.
Figure 2
Electrical conductivity as a function of heat treatment time (solution annealing) at 550°C, for samples of the AA4006 TRC alloy.
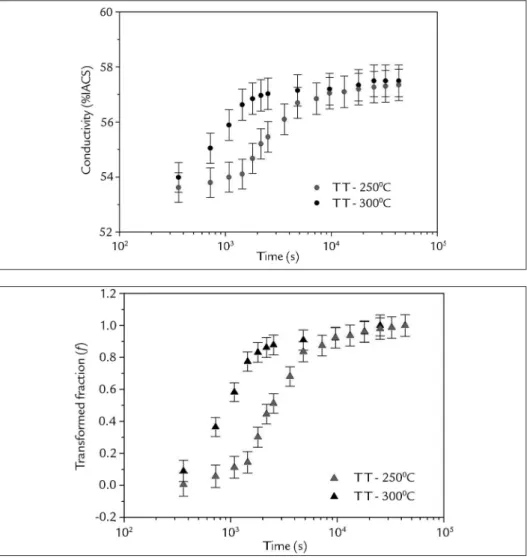
Figure 3 presents the electrical con-ductivity as a function of heat treatment time for precipitation at 250 °C and at 300 °C, while Figure 4 illustrates the trans-formed fraction as a function of isother-mal transformation time at 250 °C and 300 °C for samples of the AA4006TRC alloy, on the sheet surface.
Figures 3 and 4 illustrate that there is acceleration in the precipitation kinetics related to the increase in heat treatment
temperature, due to the fact that the conductivity plateau and the transformed fraction close to 1 are attained at shorter heat treatment times at 300 °C rather than at 250 °C.
In addition, the electric conductiv-ity as a function of precipitation heat treatment time at 250 °C and at 300 °C (Figure 3) presents similar behavior. Such a behavior can be divided in two steps. The irst step occurs for the initial time
intervals where electrical conductivity can be observed reaching 57.0 %IACS, while the second step occurs for longer time intervals, where conductivity stabilizes in the range of 57.1 to 57.5 %IACS.
The observed behavior of the curves of Figures 3 and 4 is consistent with the precipitation behavior in the solid state that occurs by nucleation and growth, which is controlled by atomic diffusion (Rios and Padilha, 2007).
Figure 3
Electrical conductivity as a function of precipitation heat treatments at 250°C and 300°C, in samples of the AA4006 TRC alloys, in the sheet surface.
Figure 4
475
Table 4
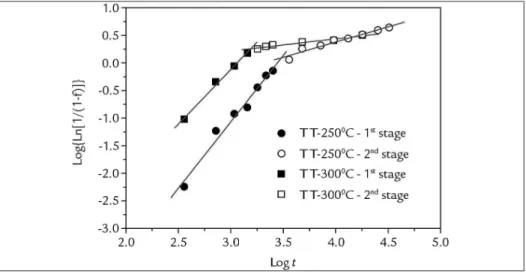
n and log k, the Avrami coefficients, for the AA4006 TRC alloy.
Stage Temperature N log k R 1 250°C 2.4 ± 0.2 -8.288 ± 0.486 0.990 1 300°C 2.0 ± 0.1 -6.052 ± 0.307 0.997 2 250°C 0.6 ± 0.1 -1.822 ± 0.196 0.978 2 300°C 0.2 ± 0.1 -0.442 ± 0.088 0.977
Figure 5 Linear regression of the JMAK equation in a linearized form as a function of the log of time of the fraction transformed isothermally for the temperatures of 250°C and 300°C.
Table 4 presents the values for n and log k, the Avrami coeficients.
Analyzing Figure 5 and Table 4, it may be observed that the precipitation shows two very distinctive stages. The irst stage, which presents an Avrami coef-icient between 2.0 and 2.4, which can be associated with the mechanism of growth of small sized precipitates with a constant nucleation rate, having a value of n = 2.5.
While the second stage, presenting a value of n in the range of 0.2 to 0.4, is related to
the coarsening of large sized particles that presented changes due to growth and in a nucleation rate practically starting from zero. This mechanism has the value of n = 0.5 (Starink, 1997).
Røyset and Ryum also observed that the precipitation reaction is di-vided into two stages in the range of 370-470 °C for an Al-wt% 0.2 Sc alloy (Røyset and Ryum, 2005). However,
Starink showed that the experimental data for some alloys has better agreement with the Austin-Rickett equation than with the JMAK equation. For some alloys, this behavior occurs due to the impingement effect during precipitation (Starink, 1997). In the present work, this effect has little inluence on the precipitation kinetics due to the low iron and silicon contents in the studied aluminium alloy.
4. Conclusions
The experimental measurements of electrical conductivity and the analysis performed lead to the following observa-tions and conclusions:
• The technique used in the evalua -tion of the electrical conductivity allowed the follow-up of changes in solute con-centration in solid solution that occurred due to the casting mode and due to heat treatments. However, it did not allow the monitoring of the changes in crystalline defects due to straining (plastic working) and due to subsequent annealing;
• The electrical conductivity de -creases with the increase of solute in the analyzed materials: AA1199 > AA1050
> AA4006. Moreover the AA4006TRC alloy presented variations in the electrical conductivity along the sheet thickness;
• After isochronous, 5h heat treat -ments from room up to 600 ºC, the AA4006TRC alloy presented no major alterations in the electrical conductivity between 20 °C and 150 °C. For the 150 to 250 ºC interval, a signiicant increase has been observed due to precipitation, while for the 250 to 350 ºC temperature range, the electrical conductivity remained prac-tically constant. Starting at 350 ºC until 600 ºC, an accentuated decrease in con-ductivity has been observed, linked to the solution of the intermetallic compounds;
• The analysis of the kinetics of solu -tion annealing at 550 °C showed that there are two distinct stages. The initial stage, characterized by the accentuated and fast decrease in conductivity, could be linked to the solution of precipitates (intermetallic compounds). The inal stage, character-ized by the slow decrease in conductivity, has been associated with the precipitate coarsening; and
CHRISTIAN, J. W. Transformations in metals and alloys. In: Equilibrium and gene-ral kinetic theory (2. ed.). Oxford: Pergamon Press. 1975, 564 p. (Part 1).
OLIVEIRA, J. C. P. T., PADILHA, A. F. Caracterização microestrutural dos alumí-nios comerciais AA1100, AA1050 e AA1070 e do alumínio superpuro AA1199.
REM - Revista Escola de Minas, Ouro Preto, v. 62, n. 3, p. 373-378, jul. set. 2009. RIOS, P. R., PADILHA, A. F. Transformações de fase. São Paulo: Artliber, 2007.
215p.
RØYSET, J., RYUM, N. Kinetics and mechanisms of precipitation in an Al-0.2 wt.% Sc alloy. Materials Science and Engineering A, v. 396, n. 2, p. 409–422, Apr. 2005.
SOUZA, F. M. et al. Um estudo comparativo entre chapas produzidas pelos processos de lingotamento contínuo e de lingotamento semicontínuo da liga AA4006: micro-estrutura e textura cristalográica. REM - Revista Escola de Minas, Ouro Preto, v. 65, n. 2, p.207-216, abr, jun. 2012.
STARINK, M. J. Kinetic equations for diffusion-controlled precipitation reactions.
Journal of Materials Science, v. 32, n. 15, p. 4061-4070, Aug. 1997.
YEUNG, C. F., LEE, W. B. The effect of homogenization on the recrystallization behavior of AA4006 Al-Si alloy. Journal of Materials Processing Technology,
v. 82, n. 2, p. 102-106, Oct. 1998.