ACPD
10, 28273–28309, 2010Three-year ground based measurements
of Aerosol Optical Depth
E. Gerasopoulos et al.
Title Page
Abstract Introduction
Conclusions References
Tables Figures
◭ ◮
◭ ◮
Back Close
Full Screen / Esc
Printer-friendly Version Interactive Discussion
Discussion
P
a
per
|
Dis
cussion
P
a
per
|
Discussion
P
a
per
|
Discussio
n
P
a
per
|
Atmos. Chem. Phys. Discuss., 10, 28273–28309, 2010 www.atmos-chem-phys-discuss.net/10/28273/2010/ doi:10.5194/acpd-10-28273-2010
© Author(s) 2010. CC Attribution 3.0 License.
Atmospheric Chemistry and Physics Discussions
This discussion paper is/has been under review for the journal Atmospheric Chemistry and Physics (ACP). Please refer to the corresponding final paper in ACP if available.
Three-year ground based measurements
of Aerosol Optical Depth over the Eastern
Mediterranean: the urban environment of
Athens
E. Gerasopoulos1, V. Amiridis2, S. Kazadzis1, P. Kokkalis3, K. Eleftheratos4,5, M. O. Andreae6, T. W. Andreae6, H. El-Askary7,8, and C. S. Zerefos4,5
1
Institute for Environmental Research and Sustainable Development, National Observatory of Athens, I. Metaxa and Vas. Pavlou, 15236, P. Penteli, Athens, Greece
2
Institute for Satellite and Remote Sensing, National Observatory of Athens, P. Penteli, Athens, Greece
3
National Technical University of Athens, Laboratory of Lasers and Applications, Athens, Greece
4
National Kapodistrian University of Athens, Geology Department, Athens, Greece
5
Biomedical Research Foundation, Academy of Athens, Athens, Greece
6
ACPD
10, 28273–28309, 2010Three-year ground based measurements
of Aerosol Optical Depth
E. Gerasopoulos et al.
Title Page
Abstract Introduction
Conclusions References
Tables Figures
◭ ◮
◭ ◮
Back Close
Full Screen / Esc
Printer-friendly Version Interactive Discussion
Discussion
P
a
per
|
Dis
cussion
P
a
per
|
Discussion
P
a
per
|
Discussio
n
P
a
per
|
7
School of Earth and Environmental Sciences, Schmid College of Science, Chapman University, Orange, CA, USA
8
Department of Environmental Sciences, Faculty of Science, Alexandria University, Egypt Received: 18 August 2010 – Accepted: 6 November 2010 – Published: 18 November 2010 Correspondence to: E. Gerasopoulos ([email protected])
ACPD
10, 28273–28309, 2010Three-year ground based measurements
of Aerosol Optical Depth
E. Gerasopoulos et al.
Title Page
Abstract Introduction
Conclusions References
Tables Figures
◭ ◮
◭ ◮
Back Close
Full Screen / Esc
Printer-friendly Version Interactive Discussion
Discussion
P
a
per
|
Dis
cussion
P
a
per
|
Discussion
P
a
per
|
Discussio
n
P
a
per
|
Abstract
Three years (2006–2008) of ground-based observations of the Aerosol Optical Depth (AOD) in the urban environment of Athens, in the Eastern Mediterranean, are analysed in this work. Measurements were acquired with a Multi-Filter Rotating Shadowband Radiometer at five wavelengths. The daily average AOD at 500 nm is 0.23, and the
5
mean ˚Angstr ¨om coefficient calculated between 415 and 867 nm is 1.41. The annual variability of AOD has a spring maximum dominated by coarse dust particles from the Sahara (AOD 0.34–0.42), while the diurnal pattern is typical for urban sites, with AOD steadily increasing throughout the day. Secondary contributors of high aerosol load-ings over Athens are identified, namely the Istanbul metropolitan area, the extended
10
areas of biomass burning around the north coast of the Black Sea, power plants spread throughout the Balkans and the industrial area in the Po valley, with average daily AOD in the range of 0.25–0.35. The geographical distribution of the above sources in con-junction with the prevailing synoptic situation and contribution of local sources, lead to mixed types of aerosols over Athens with highly variable contribution of fine and coarse
15
particles to AOD in the range 10%–90%. This is the first long-term, ground based data set available for Athens, and has also been used for the validation of satellite derived AOD by MODIS, showing good agreement on an annual basis, but with an overestima-tion of satellite AODs in the warm period.
1 Introduction
20
Aerosols have long been identified and included among the major controllers of the Earth’s climate (e.g. IPCC, 2001). Despite progress achieved during the last decades in understanding the effects of aerosols on climate, their large spatial-temporal variability and heterogeneity still causes significant uncertainties at global scales (IPCC, 2007). At regional scales, aerosols can affect the climate via radiation forcing and interaction
25
ACPD
10, 28273–28309, 2010Three-year ground based measurements
of Aerosol Optical Depth
E. Gerasopoulos et al.
Title Page
Abstract Introduction
Conclusions References
Tables Figures
◭ ◮
◭ ◮
Back Close
Full Screen / Esc
Printer-friendly Version Interactive Discussion
Discussion
P
a
per
|
Dis
cussion
P
a
per
|
Discussion
P
a
per
|
Discussio
n
P
a
per
|
A region receiving much interest with regard to the effects of aerosol is the Mediter-ranean Basin, especially its eastern part. The particularly high content of atmospheric aerosols in the area, on the order of 2 to 10 times higher than over the least polluted environments at northern latitudes (Lelieveld et al., 2002), has been demonstrated by a number of ground based studies (e.g. Formenti et al., 2001; Andreae et al., 2002;
5
Gerasopoulos et al., 2003; Fotiadi et al., 2006; Kazadzis et al., 2007) and satellite based studies (e.g. Barnaba and Gobbi, 2004; Papadimas et al., 2008; Hatzianastas-siou et al., 2009; Karnieli et al., 2009; Koukouli et al., 2010). Other studies focus on particular aerosol types such as Saharan dust (e.g. Israelevich et al., 2002; El-Askary et al., 2003; Kubilay et al., 2003; Papayannis et al., 2005; Kalivitis et al., 2007; Prasad
10
et al., 2010;), vegetation (e.g. Liakakou et al., 2009), sea spray (e.g. Kouvarakis et al., 2002), biomass burning (e.g. Balis et al., 2003) and their effects on radiation (Balis et al., 2004; El-Askary et al., 2008, 2009). High aerosol columnar contents are linked to elevated surface levels of particulate matter (e.g. Gerasopoulos et al., 2006; 2007; Koulouri et al., 2008; Querol et al., 2009) that in turn can induce health problems via
15
enhanced inhalation doses (e.g. Griffin et al., 2007; Mitsakou et al., 2008)
Apart from the crucial geographical location of the area as a crossroads of long range transported aerosols from different sources, significant local sources also exist, such as power plants, urban and industrial agglomerations. The increasing urbanization in the area has led to rapid growth of cities, from populations of 3–5 million (e.g. Athens, Izmir)
20
to the level of “megacities” (>10 million in population) such as Istanbul and Cairo. The role of these ”megacities”, both as receptors and sources, is indisputably recognised and the evaluation of their role on aerosol load and climatic relevant properties of the Eastern Mediterranean atmosphere is urged (Kanakidou et al., 2010).
Even though significant campaigns focusing on the chemical and meteorological
25
ACPD
10, 28273–28309, 2010Three-year ground based measurements
of Aerosol Optical Depth
E. Gerasopoulos et al.
Title Page
Abstract Introduction
Conclusions References
Tables Figures
◭ ◮
◭ ◮
Back Close
Full Screen / Esc
Printer-friendly Version Interactive Discussion
Discussion
P
a
per
|
Dis
cussion
P
a
per
|
Discussion
P
a
per
|
Discussio
n
P
a
per
|
(e.g. Gerasopoulos et al., 2009; Amiridis et al., 2009). On the other hand, satellite observations have been used to infer aerosol properties over the long term (e.g. Kaskaoutis et al., 2007), but the temporal resolution (one overpass per day) is not adequate to capture the intra-diurnal variation. Moreover, satellite observations need to be validated by ground based measurements.
5
This study presents three years (2006–2008) of measurements of aerosol optical depth over Athens, Greece, the third most significant, by means of population, urban centre in the Eastern Mediterranean Basin. It is the longest ground based time series available for Athens and it is used for the investigation of the main characteristics of columnar aerosol loads over an urban environment, located in an area of already high
10
regional aerosol background. In Sect. 3.1, aerosol levels and their seasonal variation are presented and compared with similar observations existing for the extended area, while in Sect. 3.2 we provide the diurnal cycle of aerosol optical characteristics. In Sect. 3.3, we utilize cluster analysis in an attempt to identify the major source regions of particles and typical paths for their transport towards the Eastern Mediterranean. In
15
Sect. 3.4, we compare our ground based observations with respective satellite products (MODIS) and finally in Sect. 3.5, we apply a graphical method to infer additional aerosol properties such as the contribution of fine and coarse particles to optical depth.
2 Experimental
2.1 Site
20
The measurements were conducted on the roof of the Biomedical Research Founda-tion of the Academy of Athens (37.99◦N, 23.78◦E) at approximately 190 m a.s.l.
(Zere-fos and Eleftheratos, 2007). The campus is located in a green area at a distance of about 4 km from the centre of Athens. To the east of the station is Mount Hymettus at a distance of about 1 km, and to the north and northeast of the station the big mountains
ACPD
10, 28273–28309, 2010Three-year ground based measurements
of Aerosol Optical Depth
E. Gerasopoulos et al.
Title Page
Abstract Introduction
Conclusions References
Tables Figures
◭ ◮
◭ ◮
Back Close
Full Screen / Esc
Printer-friendly Version Interactive Discussion
Discussion
P
a
per
|
Dis
cussion
P
a
per
|
Discussion
P
a
per
|
Discussio
n
P
a
per
|
of the county of Attica, Parnes and Penteli, are located, at distances of about 15 and 20 km, respectively. Finally, to the south, the Saronic Gulf is found at a distance of about 10 km.
2.2 Instrumentation
In this study, we have used measurements of the total and diffuse solar irradiance
5
made using a Multi-Filter Rotating Shadowband Radiometer (MFR-7 Yankee Env. Sys-tem Inc., Turner Falls, MA), to calculate the direct component of the irradiance. A detailed description of the operation principles of the instrument can be found in Harri-son et al. (1994). The MFR provides 1-min average measurements at five wavelengths (415, 500, 615, 675 and 867 nm) and from these the Aerosol Optical Depth (AOD)
10
is extracted. The instrument makes valid measurements during daytime and clear sky conditions. Regular calibration checks (autocalibration with estimates of the solar constant, Io) and instrument maintenance were performed during the period of opera-tion. For a short period, the instrument operated in parallel with the AERONET station “Athens-NOA” CIMEL sunphotometer showing very good agreement (not shown).
15
2.3 Methodology
2.3.1 AOD retrievals
The methodology followed for the extraction of the AOD values from direct solar ir-radiance is thoroughly described in Gerasopoulos et al. (2003). In brief, the Lang-ley linear regression technique (Harrison and Michalsky, 1994) is applied to the
di-20
rect solar irradiance data, to estimate the solar constant, Io, using the criteria for clear-sky days, and the exclusion of highly loaded days, and days with high varia-tion. The Beer-Lambert-Bouguer law (I = I0·e−τ·m) is then applied to derive
instan-taneous measurements of the total optical depth (τ), where m is the optical mass (airmass). Aerosol Optical Depths (AODs) for the five wavelengths are obtained by
ACPD
10, 28273–28309, 2010Three-year ground based measurements
of Aerosol Optical Depth
E. Gerasopoulos et al.
Title Page
Abstract Introduction
Conclusions References
Tables Figures
◭ ◮
◭ ◮
Back Close
Full Screen / Esc
Printer-friendly Version Interactive Discussion
Discussion
P
a
per
|
Dis
cussion
P
a
per
|
Discussion
P
a
per
|
Discussio
n
P
a
per
|
subtracting the contribution of Rayleigh scattering and ozone absorption from theτ. For the ozone absorption correction, columnar ozone values were taken from the North Hemisphere Ozone Mapping Centre of WMO (http://lap.physics.auth.gr/ozonemaps2/). For the discrimination between signals from clouds and abrupt changes in aerosol loadings, e.g. dust outbreaks, we utilized maps of cloudiness and dust transport from
5
the Barcelona Super Computing Center-DREAM Atmospheric Dust Forecast System (http://www.bsc.es/projects/earthscience/) and MODIS (http://modis-atmos.gsfc.nasa. gov/IMAGES/index.html), respectively. From the initial 1-min resolution data, half-hour and daily averages are calculated and used in the analyses that follow.
2.3.2 MODIS retrievals
10
MODIS sensors located on the Terra and Aqua satellite platforms offer a broad range of information covering land, oceanic, and atmospheric conditions (Kaufman et al., 1998; Masuoka et al., 1998). The MODIS Terra and Aqua provide aerosol-related parameters for the entire globe since 2000 and 2002, respectively. In this study we have used data for the period 2006–2008 from MODIS Terra. The MODIS Terra derived AOD
15
over land product (Daily level 2 aerosol products, i.e. MOD04 from Collection 5) at 10 km spatial resolution was acquired from the NASA Earth Observing System (EOS) Clearinghouse (ECHO). The expected errors in MODIS derived AODs over land are
±(0.05+0.15×AOD) (Remer et al., 2005, 2008), its description and validation are
discussed by Engel-Cox et al. (2004) and Chu et al. (2002), respectively. Further
20
details of the development of the aerosol retrieval algorithm over land are discussed by Remer et al. (2006).
2.3.3 Cluster analysis
In this study, a clustering algorithm for atmospheric trajectories, modified from the one recommended by Dorling et al. (1992) was used. This specific algorithm provides the
25
ACPD
10, 28273–28309, 2010Three-year ground based measurements
of Aerosol Optical Depth
E. Gerasopoulos et al.
Title Page
Abstract Introduction
Conclusions References
Tables Figures
◭ ◮
◭ ◮
Back Close
Full Screen / Esc
Printer-friendly Version Interactive Discussion
Discussion
P
a
per
|
Dis
cussion
P
a
per
|
Discussion
P
a
per
|
Discussio
n
P
a
per
|
First, a set of synthetical seed trajectories is generated. Then each real trajectory is assigned to one seed, by minimizing the 2-D Euclidian distance, considering only the longitude and latitude data of the trajectories. Then an average trajectory of each group is calculated, the so-called centroid. Trajectories are reassigned and their dis-tances from the calculated centroids are checked again. Then centroids are
recalcu-5
lated, and this step is reiterated until all trajectories are correctly assigned. The Root Mean Square Deviation (RMSD) of each trajectory from its centroid is calculated. The algorithm reduces the number of clusters by merging those for which the centroids are closest, and the previous steps are repeated. Each cluster merging leads to a weak increase in the total RMSD. However, when significantly different clusters are merged,
10
then a steep increase in the total RMSD is observed, and this is the criterion of the cluster number optimization. The whole process is repeated with slightly different seed trajectories.
For the application of the cluster analysis, we utilized air mass trajectory informa-tion from the HYSPLIT model (Hybrid Single-Particle Lagrangian Integrated Trajectory
15
Model, Draxler and Hess, 1998). In particular, we used 4-day back trajectories arriving at 12:00 UTC over Athens, at an altitude of 1500 m. This altitude is considered char-acteristic for aerosol transport in the free troposphere for the extended area of study (Mattias et al., 2004; Amiridis et al., 2005).
3 Results and discussion
20
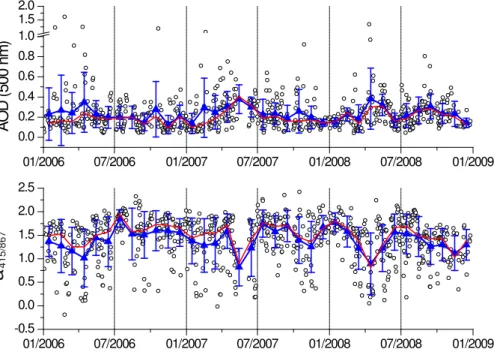
3.1 AOD levels and seasonal variation
Monitoring of AOD over Athens took place from January 2006 to December 2008, a time span of 3 years (Fig. 1). Data availability by season, mainly depending on the ex-tent of cloud cover, shows a maximum of 80% in summer to a minimum of 60% in win-ter. Frequency distribution plots for the daily average AOD at 500 nm and the ˚Angstr ¨om
25
ACPD
10, 28273–28309, 2010Three-year ground based measurements
of Aerosol Optical Depth
E. Gerasopoulos et al.
Title Page
Abstract Introduction
Conclusions References
Tables Figures
◭ ◮
◭ ◮
Back Close
Full Screen / Esc
Printer-friendly Version Interactive Discussion
Discussion
P
a
per
|
Dis
cussion
P
a
per
|
Discussion
P
a
per
|
Discussio
n
P
a
per
|
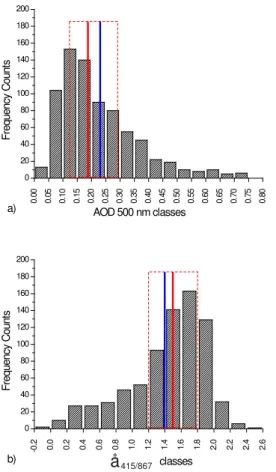
daily average AOD at 500 nm for the whole period is 0.23±0.17, with 50% of the
val-ues lying in the range 0.12–0.29 and maximum frequency class 0.1–0.15. The daily average ˚a is 1.41±0.48, with 50% of the values lying in the range 1.2–1.8, and with a
maximum frequency class of 1.6–1.8. The basic statistics for all wavelengths are given in Table 1.
5
Long-term ground based monitoring data of AOD for Athens do not exist. However, the newly established “Athens-NOA” AERONET station has been operating uninter-rupted since February 2009 and constitutes the continuation of our measurements at the same site. Other ground measurement studies report a mean AOD of 0.23 at 500 nm and an ˚a in the range 1.4–1.6 for the period 1999–2002 at two sites in
North-10
ern Greece, Thessaloniki/urban and Ouranoupoli/rural (Gerasopoulos et al., 2003) and a mean AOD of 0.21 at Crete/rural for the period 2003–2004 (Fotiadi et al., 2006). Kazadzis et al., (2007) report AOD at 320 nm in the range 0.43–0.46 for the period 1997–2005 at Thessaloniki. In contrast, AOD levels for Athens have been estimated from satellite data, however validation of these data over long periods and for diff
er-15
ent spatial resolutions, has until now never been performed but is part of this study (Sect. 3.4). In particular, MODIS derived mean AOD at 550 nm for the period 2000– 2005 for the Athens region is 0.35 (Kaskaoutis et al., 2007).
Numerous spikes in AOD are encountered throughout the whole measurement pe-riod (Fig. 1) and are associated either with local sources of particles or enhanced
20
aerosol loadings due to transport. Periods with increased frequency of episodes are clearly illustrated in the monthly values, by large standard deviation bars and diver-gence between average and median monthly values. The same pattern is seen for ˚a, with the majority of the values being around the median of 1.5 (relatively fine aerosols), indicative of the urban characteristics of Athens’ environment. However, most peaks in
25
AOD are related to low ˚a , indicating the significant contribution of coarse aerosols to the elevated aerosol loadings over Athens.
ACPD
10, 28273–28309, 2010Three-year ground based measurements
of Aerosol Optical Depth
E. Gerasopoulos et al.
Title Page
Abstract Introduction
Conclusions References
Tables Figures
◭ ◮
◭ ◮
Back Close
Full Screen / Esc
Printer-friendly Version Interactive Discussion
Discussion
P
a
per
|
Dis
cussion
P
a
per
|
Discussion
P
a
per
|
Discussio
n
P
a
per
|
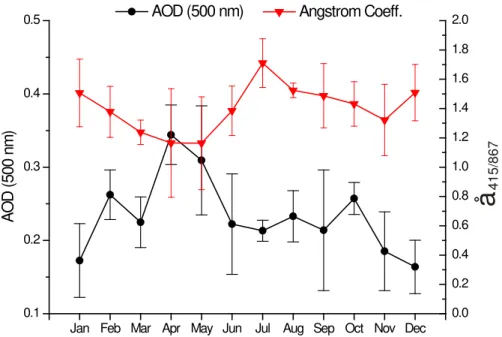
Minimum AODs are found in the period of November to January (0.16–0.19), with mod-erate values of ˚a (1.3–1.5) while, during the rest of the period, AODs show a plateau around the average value. ˚a reaches its maximum level (1.7) in July. The seasonal pattern in Athens agrees well with that of the Aegean Sea presented by Koukouli et al. (2010; see Fig. 5). By comparing the seasonal patterns along a north-south axis, it
5
can be deduced that the pattern is comprised of two modes, a spring mode reflecting dust transport from the Sahara and a summer mode reflecting continental (Balkans and central-east Europe) sources of pollution, in combination with the dominance of northerly winds in the area, the so-called Etisians. The location of each site along this axis and thus the distance from these distinct source areas, defines the observed
sea-10
sonal pattern at each site, together with other local characteristics or sources. Thus, the observed seasonality in Athens depicts the significant role of dust transport from the Sahara mainly during spring, which brings considerable quantities of coarse dust particles over the Eastern Mediterranean, influencing aerosol loadings as well as sur-face levels of particulate matter (e.g. Gerasopoulos et al., 2006).
15
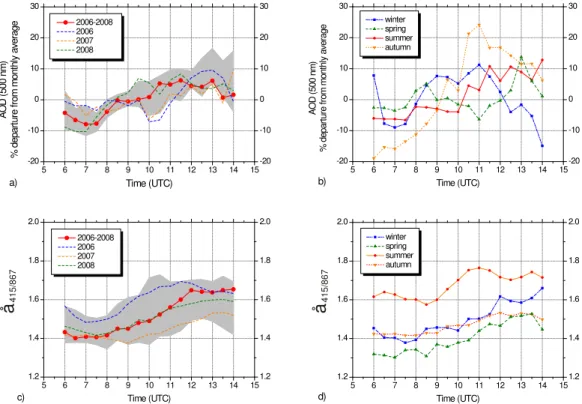
3.2 Diurnal variation
We have investigated the diurnal variation of AOD and ˚a on a mean annual and sea-sonal basis. All observations for a single day are expressed as a percentage departure from the monthly mean. Computed percentages were averaged at half-hour inter-vals during 06:00–14:00 UTC. Each half-hour average consists of at least 10 min of
20
observations, under the assumption that no significant changes in AOD levels are con-sistently expected in such a short period, and that a day should have at least 5 h of available data. We present the diurnal variability of AOD at 500 nm and ˚a in Fig. 4.
There is a clear diurnal cycle for both AOD and ˚a during the 2006–2008 period. In particular, AOD is lower in the morning, increases until midday and reaches an
25
afternoon plateau (Fig. 4a). The diurnal departure of AOD from the monthly mean ranges from−8% to 6%, with consistent repeatability for the different years (from−10%
ACPD
10, 28273–28309, 2010Three-year ground based measurements
of Aerosol Optical Depth
E. Gerasopoulos et al.
Title Page
Abstract Introduction
Conclusions References
Tables Figures
◭ ◮
◭ ◮
Back Close
Full Screen / Esc
Printer-friendly Version Interactive Discussion
Discussion
P
a
per
|
Dis
cussion
P
a
per
|
Discussion
P
a
per
|
Discussio
n
P
a
per
|
AOD at 500 nm. This main pattern is more or less reproduced during the different seasons (Fig. 4b). Three points are worth noting: (i) the steep morning increase in autumn which then decreases in the afternoon, with diurnal departures in the range from−19% to 24%, (ii) the clear midday maximum in winter, and (iii) the noisy pattern
in spring due to the presence of dust storm episodes. Smirnov et al. (2002) report
5
similar diurnal variability at sites influenced by local urban/industrial sources, with AOD steadily increasing throughout the day, reaching a maximum in the afternoon. For sites relatively close to ours, this increase is less than 10% (Ispra, Italy) or between 10% and 15% (Rome and Bucharest), and in all cases comparable with the mean increase of 14% we find in Athens.
10
A distinct diurnal pattern is also revealed for ˚a (Fig. 4c). Year round, low ˚a values are encountered in the morning, steadily increasing towards evening, when they stabilise to a plateau value around 1.65. The pattern appears repeatable during the 3 years of this study. Less variability and smaller increase is observed in autumn, indicating less variable size of the aerosols. In winter and spring the annual pattern is followed,
15
however spring values are lower than winter by an average of 6% (about 0.1), indicating the presence of coarse dust particles in the area. Finally, in summer ˚a is much higher and its diurnal variability coincides with that of AOD, indicating the presence of finer particles.
The increase in both AOD and ˚a during the day seems to be due to a combination of
20
two factors: aerosol sources/processes in urban environments and local scale trans-port. The station is located to the east of the city centre and local industrial sources are situated at the western part of Athens. Automobile emissions peak in the morn-ing and are likely the major source of primary particles in the city. These facts, when combined with the prevailing local meteorology can explain the increasing tendency in
25
ACPD
10, 28273–28309, 2010Three-year ground based measurements
of Aerosol Optical Depth
E. Gerasopoulos et al.
Title Page
Abstract Introduction
Conclusions References
Tables Figures
◭ ◮
◭ ◮
Back Close
Full Screen / Esc
Printer-friendly Version Interactive Discussion
Discussion
P
a
per
|
Dis
cussion
P
a
per
|
Discussion
P
a
per
|
Discussio
n
P
a
per
|
During autumn and winter, winds are from the NW in the early morning and change to a westerly direction at about 8:00–9:00 UTC. The prevailing wind direction pattern at the station, combined with the increasing wind speed as an index of local transport and the location of the station in relation to the sources, support the increase of aerosol loading as seen in the AOD and the gradual dominance of finer particles from urban processes
5
as seen in the ˚a.
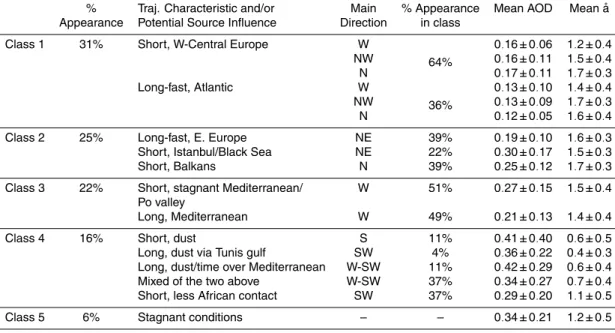
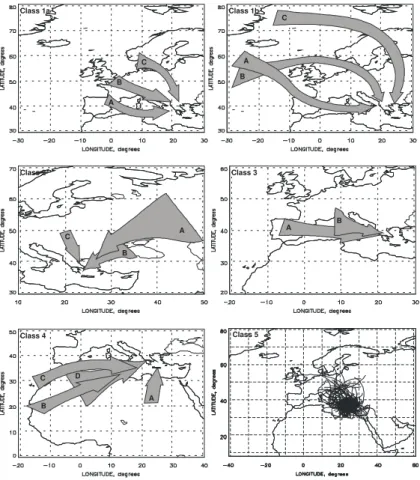
3.3 Major aerosol transport patterns
Cluster analysis of the HYSPLIT trajectories for the period of January 2006 to De-cember 2008 has revealed 16 distinct synoptic situations transporting air parcels over Athens. These clusters have been grouped into 5 main classes (Fig. 5), whose
char-10
acteristics are summarised in Table 2 and presented in the following sections.
3.3.1 Class 1: W-NW-N sector
This class accounts for 31% of the total trajectories and includes trajectories that have spent a significant portion of their time over western and central Europe, before arrival over Athens. We have discriminated additionally between short trajectories (Fig. 5,
15
Class 1a, 64% of the class trajectories) and long trajectories (Fig. 5, Class 1b, 36% of the class trajectories), in an attempt to quantify the influence from major continental European aerosol sources, such as urban agglomerations and industrial areas.
The average AOD corresponding to short trajectories (Fig. 5, Class 1a) is in the range 0.16–0.17, while ˚a presents a tendency to increase from 1.2 for cluster A
(west-20
erly directions) to 1.7 for cluster C (northerly directions). This tendency of increasing ˚a from west to north is indicative of different source types and mixed types of aerosols at the sector edges, namely sea salt (coarse particles) for cluster A and anthropogenic particles (fine particles) for cluster C. Trajectories in Class 1a are found mostly in sum-mer.
ACPD
10, 28273–28309, 2010Three-year ground based measurements
of Aerosol Optical Depth
E. Gerasopoulos et al.
Title Page
Abstract Introduction
Conclusions References
Tables Figures
◭ ◮
◭ ◮
Back Close
Full Screen / Esc
Printer-friendly Version Interactive Discussion
Discussion
P
a
per
|
Dis
cussion
P
a
per
|
Discussion
P
a
per
|
Discussio
n
P
a
per
|
The average AOD corresponding to long and fast trajectories (Fig. 5, Class 1b) is in the range 0.12–0.13, while again, ˚a increases going from westerly to northerly direc-tions. The vast majority of these trajectories originate at high altitudes over the Atlantic, bringing the cleanest possible air parcels towards the Eastern Mediterranean. At their latest stage they follow katabatic movement, sweeping in air from non-background
ar-5
eas. Even then, the influence is minor since the trajectories from Class 1b predominate in winter, when efficient wet-removal aerosol processes due to cloudy conditions and precipitation are encountered. In all cases, the average AOD of 0.12–0.13 from this class is the lowest found in this study and can be considered as typical background for Athens in the absence of major transported aerosol loads. Fotiadi et al. (2006) give a
10
mean AOD at 500 nm of around 0.1 in winter and identify it as near background con-ditions for Crete, which is, however, dominated by marine aerosols year round. That, in addition to the fact that under N-NW winds Crete is influenced by Athens pollution, makes it difficult to estimate the absolute background in the area and then to discrimi-nate the contribution of local/urban sources of Athens to AOD.
15
3.3.2 Class 2: N-NE sector
Class 2 accounts for 25% of the total trajectories and represents the N-NE sector, with trajectories coming from Eastern Europe and the Balkans (Fig. 5, Class 2). The average AOD corresponding to long and fast trajectories (cluster A) is 0.19 with ˚a equal to 1.6, characteristics similar to the long and fast trajectories of Class 1. This
20
cluster accounts for 39% of the trajectories of this class and presents a narrow summer maximum.
The second cluster of trajectories from the same direction (cluster B), representing 22% of the trajectories from Class 2, includes short trajectories from over Istanbul and the Black Sea. The average AOD corresponding to this cluster is 0.3 and the
25
ACPD
10, 28273–28309, 2010Three-year ground based measurements
of Aerosol Optical Depth
E. Gerasopoulos et al.
Title Page
Abstract Introduction
Conclusions References
Tables Figures
◭ ◮
◭ ◮
Back Close
Full Screen / Esc
Printer-friendly Version Interactive Discussion
Discussion
P
a
per
|
Dis
cussion
P
a
per
|
Discussion
P
a
per
|
Discussio
n
P
a
per
|
a strong source of anthropogenic particles, is expected to play a significant role in aerosol loadings at regional scales. The average AOD of this cluster is 60% higher than for cluster A from the same direction and more than double compared to the typical Athens winter background of 0.12, while the average ˚a (1.5, see Table 2) indicates mixing with marine aerosols over the Aegean Sea. Another significant source from
5
the same direction is the extended area of biomass burning around the north coast of the Black Sea, mainly during summer, which may contribute significantly to AOD (e.g. Balis et al., 2003). Both biomass burning and pollution episodes are considered to be episodes rather than a constant influence, a fact illustrated by the enhanced standard deviation of the average AOD, compared to the rest of the clusters of Classes 1 to 3
10
(see Table 2).
Finally, the third cluster of trajectories (cluster C) of Class 2, accounts for 39% of this class and has an average AOD of 0.25 and an average ˚a of 1.7. The high ˚a of this cluster is possibly representative of very fine particles from power plants in the Balkans (Zerefos et al., 2000).
15
3.3.3 Class 3: W sector
The third most frequent class is Class 3 representing 22% of the total trajectories (Fig. 5, Class 3). This class includes air masses arriving from the west, equally dis-tributed between long and short trajectories. The average AOD corresponding to the long trajectories (cluster A) is 0.21 and the average ˚a is 1.4. This cluster mainly brings
20
air masses from above the Mediterranean, enriched in marine aerosols, and in some cases it may include continental air masses from the south part of the Iberian and the Italian peninsulas. The contribution of fine aerosols of biomass burning from forest fires, typically detected in summertime in the Iberian and Italian Peninsulas, should also be considered (e.g. Elias et al., 2006; Basart et al., 2009). For short trajectories
25
ACPD
10, 28273–28309, 2010Three-year ground based measurements
of Aerosol Optical Depth
E. Gerasopoulos et al.
Title Page
Abstract Introduction
Conclusions References
Tables Figures
◭ ◮
◭ ◮
Back Close
Full Screen / Esc
Printer-friendly Version Interactive Discussion
Discussion
P
a
per
|
Dis
cussion
P
a
per
|
Discussion
P
a
per
|
Discussio
n
P
a
per
|
moreover they are partly displaced to the NW thereby sweeping polluted air masses from the Po valley industrial area towards the east, mainly during summer.
3.3.4 Class 4: S sector
The south sector, Class 4, is related to the highest aerosol loadings over the area, since it includes the transport of dust particles from desert and arid locations of North Africa.
5
Dust transport towards the Eastern Mediterranean, both horizontal and vertical, has been reported in a number of studies (e.g. Kalivitis et al., 2007; Amiridis et al., 2005; Giannakaki et al., 2010). Our cluster analysis has revealed the three major paths and also a cluster of trajectories with less contact to the African continent (Fig. 5, Class 4). The first cluster of trajectories (cluster A) arrives over Athens directly from the south,
10
transporting dust particles from extended arid areas in Libya and Egypt. The direction of this cluster centroid also points to the Bod ´el ´e Depression in southern Chad, which is among the major dust sources as seen from space measurements (e.g. Engelstaedter and Washington, 2007), with dust storms occurring on average about 100 days per year (Washington et al., 2005). The trajectories of this cluster traverse the shortest
15
distance over water before reaching Greece, compared to the rest of the clusters that bring dust from Africa. The average AOD for this cluster, which accounts for 11% of the trajectories of this class, is 0.41 with an ˚a of 0.6 and as all clusters in this class, the maximum frequency of occurrence is in spring.
The second cluster of trajectories (cluster B) includes only 4% of the south sector
20
cases and brings air masses from the heart of the Sahara in Mali and Mauritania, via the gulfs of Sirte and Tunis. The reason for including it as a separate cluster is that apart from the high aerosol loadings (average AOD 0.36) it is related to the lowest ˚a, equal to 0.4. Another 11% of the trajectories (cluster C) is related to dust mobilised over the W-NW parts of Sahara and then transported to the east having travelled all along the
25
ACPD
10, 28273–28309, 2010Three-year ground based measurements
of Aerosol Optical Depth
E. Gerasopoulos et al.
Title Page
Abstract Introduction
Conclusions References
Tables Figures
◭ ◮
◭ ◮
Back Close
Full Screen / Esc
Printer-friendly Version Interactive Discussion
Discussion
P
a
per
|
Dis
cussion
P
a
per
|
Discussion
P
a
per
|
Discussio
n
P
a
per
|
Finally, most of the trajectories fall into cluster D (74%) which is a mixture of clus-ters B and C, both in origins of air masses and characteristics. The average AOD corresponding to this cluster is 0.34 and the average ˚a is 0.7. However, half of these trajectories show less contact with the African continent and as a consequence have a lower AOD (0.29) and higher ˚a (1.1).
5
3.3.5 Class 5: stagnant conditions
The final class (Fig. 5, Class 5) includes short trajectories of local influence mainly found during stagnant conditions. Such conditions favour the impact of local sources and the accumulation of aerosols in the area. The average AOD of the class is 0.34 and the average ˚a is 1.2 indicating strong presence of marine aerosols.
10
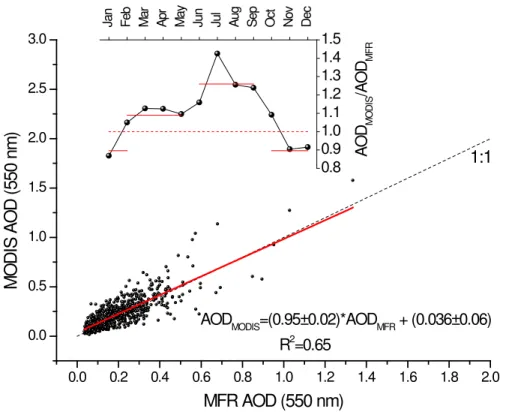
3.4 Comparison between ground based and satellite derived AODs
In order to compare the AODs from the MFR to the MODIS derived AODs for Athens, we have first calculated the AOD at 550 nm. For that we used ˚Angstr ¨om’s (1929) empirical formula and the ˚a calculated from 415 and 867 nm. Smirnov et al. (2002), using data from AERONET, found that the daily mean AOD values are very close to
15
the mean values in the time window frame within ±30 min of the MODIS overpass.
However, this depends on the diurnal variability of the individual site.
For this reason, two data sets were produced from the MFR measurements for the purpose of the comparison, one with daily averages (AODMFR-daily) and one with the 30 min averages centred around the time of the satellite overpass over Athens
20
(AODMFR-ovps) at around 09:30 UTC. The overpass time coincides with the middle of the diurnal increasing branch (see Fig. 4a), thus the two time series are expected to be significantly correlated. Indeed, the calculation of the regression line between the two data sets gives a slope of 1.02, an intercept of 0.004 andR2 equal to 0.89, after the exclusion of only 10 points for which the overpass averages exceed the daily averages
25
ACPD
10, 28273–28309, 2010Three-year ground based measurements
of Aerosol Optical Depth
E. Gerasopoulos et al.
Title Page
Abstract Introduction
Conclusions References
Tables Figures
◭ ◮
◭ ◮
Back Close
Full Screen / Esc
Printer-friendly Version Interactive Discussion
Discussion
P
a
per
|
Dis
cussion
P
a
per
|
Discussion
P
a
per
|
Discussio
n
P
a
per
|
is better with the use of the daily averages dataset (R20.65 vs 0.55), thus we use the AODMFR-dailyfor the further analysis.
The average AOD at 550 nm during the common days between the two data sets is 0.19±0.13 from the MFR while from MODIS it is 0.22±0.15. The regression line be-tween the two is shown in Fig. 6. Both the slope and the intercept are in agreement with
5
similar comparisons between MODIS and AERONET data (e.g. Remer et al., 2008; Pa-padimas et al., 2009). The insert panel in Fig. 6 shows the ratio AODMODIS/AODMFR, highlighting that throughout the year the deviation between MODIS with the ground based data lies within±10% (there is underestimation in winter and an overestimation
in the transition periods), but in summer MODIS may overestimate AOD values on
av-10
erage 30%. As a consequence, the main seasonal pattern is reproduced by MODIS, namely the spring maximum; however summer levels are relatively enhanced and ap-pear as a secondary maximum.
The relation between MFR and MODIS has also been investigated in AOD bins of 0.1, with the highest AOD bin typically representing fewer observations than the other
15
bins, however no particular pattern was revealed.
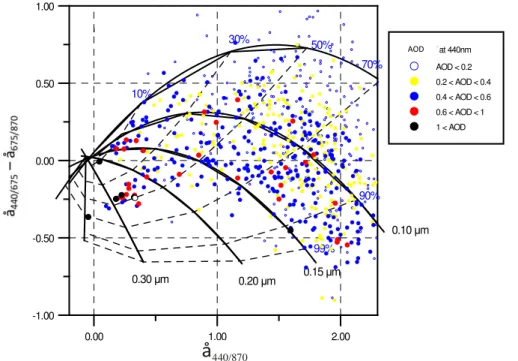
3.5 Contribution of fine and coarse particles to AOD
AOD and ˚a give information on the columnar aerosol loading over an area and a first indication of the particle sizes. It is obvious that for more information on the com-position of this aerosol, full chemical analysis is needed, which however describes the
20
aerosol composition only at the surface. Gobbi et al. (2007) have presented a graphical framework for classifying additional aerosol properties using AOD observations. Their method relies on the combined analysis of ˚a and its spectral curvature, which allows for the inference of fine mode aerosol size and fractional contribution to the total AOD. In addition, it permits the separation of AOD growth by aerosol humidification and/or
25
ACPD
10, 28273–28309, 2010Three-year ground based measurements
of Aerosol Optical Depth
E. Gerasopoulos et al.
Title Page
Abstract Introduction
Conclusions References
Tables Figures
◭ ◮
◭ ◮
Back Close
Full Screen / Esc
Printer-friendly Version Interactive Discussion
Discussion
P
a
per
|
Dis
cussion
P
a
per
|
Discussion
P
a
per
|
Discussio
n
P
a
per
|
˚a difference are∼20% and∼50%, respectively. For this reason, AOD>0.15 are used
in Gobbi et al. (2007), in order to avoid errors >30%. Here we have used the AOD retrievals from the MFR measurements to classify the aerosol properties as a function of ˚a440/870 and the difference of ˚a440/675– ˚a675/870, for bimodal, lognormal size distri-butions. This graphical method is used to visually investigate the contribution of fine
5
aerosol to the AOD (through the fine mode fraction) and the size of the fine aerosols (Fig. 7).
The black solid lines account for a fixed effective radius (Rf) of the fine mode and the dashed lines for a fixed fraction contribution (η) of the fine mode to the AOD. For the three years of measurements analyzed for Athens, it can be seen that a variety of fine
10
mode fractions can be found for typical AOD values, with an average fine modeRf of about 0.12 µm. A great number of cases with ˚a lower than 0.5 demonstrates the high impact of coarse particles at the site. As already shown in the cluster analysis section, most of the cases with maximum AODs are characterized by the presence of dust par-ticles from the Sahara. Characteristically, 23% and 44% of the cases with AOD>0.3
15
are related to ˚a<0.5 and ˚a<1, respectively. In Fig. 7 we can distinguish two cases with high AOD combined with low ˚a: (a) η < 30% and Rf∼0.12 µm and (b) η <50%
andRf>0.20 µm. In the first case the fact that ˚a440/675– ˚a675/870>0 indicates the pres-ence of two separate particle modes, suggesting dust mixed with fine anthropogenic particles. In the second case ˚a440/675– ˚a675/870<0 shows the dominance of one mode,
20
associated to coarse dust particles.
Basart et al. (2009) provided an atmospheric aerosol characterization for the Mediterranean among other areas, based on AERONET data for the period 1994– 2007, applying the same graphical method. The closest sites to Athens presented in this work are Thessaloniki to the north and Crete to the south. In the first case
25
high AODs mainly cluster in the fine mode corresponding toη∼=85% andRf∼=0.13 µm,
ACPD
10, 28273–28309, 2010Three-year ground based measurements
of Aerosol Optical Depth
E. Gerasopoulos et al.
Title Page
Abstract Introduction
Conclusions References
Tables Figures
◭ ◮
◭ ◮
Back Close
Full Screen / Esc
Printer-friendly Version Interactive Discussion
Discussion
P
a
per
|
Dis
cussion
P
a
per
|
Discussion
P
a
per
|
Discussio
n
P
a
per
|
toη <30%, with particles related to long-range transport of mineral dust from the south.
The pattern revealed for Athens, which is located in the middle of the two other sites, shows great similarities to the one recorded for Rome, Italy (Gobbi et al., 2007; Basart et al., 2009). Both cities are located at the middle of the Mediterranean Basin in the north-south direction and at about the same distance from the main sources of
par-5
ticulate matter in the area, e.g. dust from Sahara and anthropogenic particles from continental Europe. Moreover, both cities have similar population and are influenced by distinct sources of pollution from the north, namely Istanbul, Black Sea biomass burning and Balkan power plants on one hand, and the Po valley on the other hand.
4 Conclusions
10
Three years of observations (2006–2008) of the Aerosol Optical Depth (AOD) in the urban environment of Athens, in the eastern Mediterranean, were analysed and pre-sented in this work. This is the first long term, ground based data set available for this area, which is being continued by the newly established “Athens-NOA” AERONET station at the same location. The main conclusions of this work can be summarized as
15
follows:
– The daily average AOD at 500 nm over Athens is 0.23±0.17 and the ˚Angstr ¨om
coefficient ( ˚a) calculated between 415 and 867 nm, is 1.41±0.48. Similar values are found along a north-south axis in the eastern Mediterranean Basin, indica-tive of strong sources of particulate matter in the area, which contribute to the
20
degradation of regional quality.
– The position of Athens in the middle of the above mentioned axis defines the an-nual cycle of AOD and ˚a. The patterns observed in Athens appear to be closer to that of the southern stations, which exhibit a pronounced spring mode, reflecting dust transport from the Sahara, rather than that of northern stations, where the
ACPD
10, 28273–28309, 2010Three-year ground based measurements
of Aerosol Optical Depth
E. Gerasopoulos et al.
Title Page
Abstract Introduction
Conclusions References
Tables Figures
◭ ◮
◭ ◮
Back Close
Full Screen / Esc
Printer-friendly Version Interactive Discussion
Discussion
P
a
per
|
Dis
cussion
P
a
per
|
Discussion
P
a
per
|
Discussio
n
P
a
per
|
summer mode prevails, reflecting continental (Balkans and central-east Europe) sources of pollution.
– A diurnal cycle of AOD typical for urban sites is found in Athens, with AOD steadily increasing throughout the day. A similar increase is observed in ˚a, and both patterns are shown to be a combination of aerosol sources/processes in urban
5
environments and local scale transport.
– Three general points are concluded from the trajectory cluster analysis: (i) the variation of both aerosol columnar loadings and size are controlled by well distin-guished regional rather than local sources of pollution, (ii) short trajectories versus long trajectories, from the same direction, are responsible for more efficient
par-10
ticle transport, since their motion is closer to the surface, thus sweeping polluted air masses from within the boundary layer, (iii) a tendency of increasing ˚a from west to north-northeast exists, indicative of different types of sources and mixed types of aerosols at the sector edges, namely sea salt (coarse particles) for clus-ters close to the Mediterranean Sea and anthropogenic particles (fine particles)
15
for continental clusters.
– The cleanest conditions are found under N-NW winds and long trajectories that originate from high altitudes over the Atlantic. An average AOD of 0.12–0.13 can be considered as typical background for Athens, in the absence of major transported aerosol loads, and it is mainly encountered during winter.
20
– Maximum aerosol loads (AOD of 0.34–0.42) are found in spring in conjunction with low ˚a values, representing the significant contribution of dust particles trans-ported from desert and arid locations of North Africa (e.g. Sahara). The second most important source area of high aerosol loadings originates from the direc-tion of the Istanbul metropolitan area and the extended areas of biomass burning
25
ACPD
10, 28273–28309, 2010Three-year ground based measurements
of Aerosol Optical Depth
E. Gerasopoulos et al.
Title Page
Abstract Introduction
Conclusions References
Tables Figures
◭ ◮
◭ ◮
Back Close
Full Screen / Esc
Printer-friendly Version Interactive Discussion
Discussion
P
a
per
|
Dis
cussion
P
a
per
|
Discussion
P
a
per
|
Discussio
n
P
a
per
|
plants) also seem to cause elevated AODs (0.25) associated with finer particles mainly during summer.
– The comparison between MFR and MODIS revealed that the main seasonal pat-tern is reproduced by MODIS, namely the spring maximum, however summer lev-els from MODIS are relatively enhanced and appear as a secondary maximum.
5
– The contribution of fine particles to typical AOD ranges widely from 10% to 90%, indicative of a mixture of aerosol types over Athens. A predominant number of cases with ˚a lower than 0.5 demonstrates the high impact of dust particles at the site. Dust particles can either be present without altering the local fine mode size, or they can be associated with fine mode growth mechanisms at the same time.
10
This analysis is intended to provide data on the climatological aspects of aerosol loadings over an urban environment in the eastern Mediterranean, based on ground measurements. Such data sets are essential for the validation of satellite products, which can then be used for long term climatic studies. However, for the detailed iden-tification and apportionment of sources, chemical composition of aerosols is needed.
15
With such information it will then be feasible to estimate the contribution of distinct sources at local or regional scales versus the pollution from urban activities, in an area characterized by diverse mixtures of aerosols and processes.
Acknowledgements. The research leading to these results has received funding from the
project CITYZEN of the European Union’s Seventh Framework Programme (FP7/2007-2013)
20
under Grant Agreement no. 212095.
References
Amiridis, V., Balis, D. S., Kazadzis, S., Bais, A., Giannakaki, E., Papayannis, A., and Zerefos, C.: Four-year aerosol observations with a Raman lidar at Thessaloniki, Greece, in the framework of EARLINET, J. Geophys. Res., 110, D21203, doi:10.1029/2005JD006190, 2005.
ACPD
10, 28273–28309, 2010Three-year ground based measurements
of Aerosol Optical Depth
E. Gerasopoulos et al.
Title Page
Abstract Introduction
Conclusions References
Tables Figures
◭ ◮
◭ ◮
Back Close
Full Screen / Esc
Printer-friendly Version Interactive Discussion
Discussion
P
a
per
|
Dis
cussion
P
a
per
|
Discussion
P
a
per
|
Discussio
n
P
a
per
|
Amiridis, V., Kafatos, M., Perez, C., Kazadzis, S., Gerasopoulos, E., Mamouri, R. E., Papayan-nis, A., Kokkalis, P., Giannakaki, E., Basart, S., Daglis, I., and Zerefos, C.: The potential of the synergistic use of passive and active re-mote sensing measurements for the validation of a regional dust model, Ann. Geophys., 27, 3155–3164, 2009,
http://www.ann-geophys.net/27/3155/2009/.
5
Andreae, T. W., Andreae, M. O., Ichoku, C., Maenhaut, W., Cafmeyer, J., Karnieli, A., and Orlovsky, L.: Light scattering by dust and anthropogenic aerosol at a remote site in the Negev desert, Israel, J. Geophys. Res., 107, 4008, doi:10.1029/2001JD900252, 2002. ˚
Angstr ¨om, A.: On the atmospheric transmission of sun radiation and on dust in the air, Geogr. Ann., 12, 130–159, 1929.
10
Balis, D., Amiridis, V., Zerefos, C., Gerasopoulos, E., Andreae, M. O., Zanis, P., Kazantzidis, A., Kazadzis S., and Papayannis, A.: Raman lidar and sunphotometric measurements of aerosol optical properties over Thessaloniki, Greece during a biomass burning episode, At-mos. Environ., 37, 4529–2538, 2003.
Balis, D. S., Amiridis, V., Zerefos, C., Kazantzidis, A., Kazadzis, S., Bais, A. F., Meleti, C.,
15
Gerasopoulos, E., Papayannis, A., Matthias, V., Dier, H., and Andreae, M. O.: Study of the effect of different type of aerosols on UV-B radiation from measurements during EARLINET, Atmos. Chem. Phys., 4, 307–321, doi:10.5194/acp-4-307-2004, 2004.
Barnaba, F. and Gobbi, G. P.: Aerosol seasonal variability over the Mediterranean region and relative impact of maritime, continental and Saharan dust particles over the basin from
20
MODIS data in the year 2001, Atmos. Chem. Phys., 4, 2367–2391, doi:10.5194/acp-4-2367-2004, 2004.
Basart, S., P ´erez, C., Cuevas, E., Baldasano, J. M., and Gobbi, G. P.: Aerosol characterization in Northern Africa, Northeastern Atlantic, Mediterranean Basin and Middle East from direct-sun AERONET observations, Atmos. Chem. Phys., 9, 8265–8282,
doi:10.5194/acp-9-8265-25
2009, 2009.
Chu, D. A., Kaufman, Y. J., Ichoku, C., Remer, L. A., Tanr ´e, D., and Holben, B. N.: Valida-tion of MODIS aerosol optical depth retrieval over land, Geophys. Res. Lett., 29(12), 8007, doi:10.1029/2001GL013205, 2002.
Dorling, S. R., Davies, T. D., and Pierce, C. E.: Cluster Analysis: A Technique for
Estimat-30
ing the Synoptic Meteorological Controls on Air and Precipitation Chemistry – Method and Applications, Atmos. Environ., 26A, 2575–2581, 1992.
ACPD
10, 28273–28309, 2010Three-year ground based measurements
of Aerosol Optical Depth
E. Gerasopoulos et al.
Title Page
Abstract Introduction
Conclusions References
Tables Figures
◭ ◮
◭ ◮
Back Close
Full Screen / Esc
Printer-friendly Version Interactive Discussion
Discussion
P
a
per
|
Dis
cussion
P
a
per
|
Discussion
P
a
per
|
Discussio
n
P
a
per
|
dispersion and deposition, Aust. Meteorol. Mag., 47, 295–308, 1998.
El-Askary, H., Sarkar, S., Kafatos, K., and El-Ghazawi, T. A.: A multisensor approach to dust storm monitoring over the Nile delta, IEEE Trans. On Geos. and Remote Sen., 41(10), 2386– 2391, 2003.
El-Askary, H. and Kafatos, M.: Dust storm and black cloud influence on aerosol optical
proper-5
ties over Cairo and the greater delta region, Egypt, Int. J. of Rem. Sens., 29(24), 7199–7211, 2008.
El-Askary, H., Farouk, R., Ichoku, C., and Kafatos, M.: Transport of dust and anthropogenic aerosols across Alexandria, Egypt, Ann. Geophys., 27(7), 2869–2879, 2009.
Elias, T., Silva, A. M., Belo, N., Pereira, S., Formenti, P., Helas, G., and Wagner, F.: Aerosol
10
extinction in a remote continental region of the Iberian Peninsula during summer, J. Geophys. Res., 111(D14), D14204, doi:10.1029/2005JD006610, 2006.
Engel-Cox, J. A., Holloman, C. H., Coutant, B. W., and Hoff, R. M.: Qualitative and quantitative evaluation of MODIS satellite sensor data for regional and urban scale air quality, Atmos. Environ., 38, 2495–2509, 2004.
15
Engelstaedter, S. and Washington, R.: Atmospheric controls on the annual cycle of North African dust, , J. Geophys. Res., 112, D03103, doi:10.1029/2006JD007195, 2007.
Formenti, P., Andreae, M. O., Andreae, T. W., Galani, E., Vasaras, A., Zerefos, C., Amiridis, V., Orlovsky, L., Karnieli, A., Wendisch, M., Wex, H., Holben, B. N., Maenhaut, W., and Lelieveld, J.: Aerosol optical properties and large scale transport of air masses: Observations at a
20
coastal and a semiarid site in the eastern Mediterranean during summer 1998, J. Geophys. Res., 106, 9807–9826, 2001.
Fotiadi, A., Hatzianastassiou, N., Drakakis, E., Matsoukas, C., Pavlakis, K. G., Hatzidimitriou, D., Gerasopoulos, E., Mihalopoulos, N., and Vardavas, I.: Aerosol physical and optical prop-erties in the Eastern Mediterranean Basin, Crete, from Aerosol Robotic Network data, Atmos.
25
Chem. Phys., 6, 5399–5413, doi:10.5194/acp-6-5399-2006, 2006.
Gerasopoulos, E., Andreae, M. O., Zerefos, C. S., Andreae, T. W., Balis, D., Formenti, P., Merlet, P., Amiridis, V., and Papastefanou, C.: Climatological aspects of aerosol optical properties in Northern Greece, Atmos. Chem. Phys., 3, 2025–2041, doi:10.5194/acp-3-2025-2003, 2003. Gerasopoulos, E., Kouvarakis, G., Babasakalis, P., Vrekoussis, M., Putaud, J.-P., and
Mi-30
halopoulos, N.: Origin and variability of particulate matter (PM10) mass concentrations over the Eastern Mediterranean, Atmos. Environ., 40(25), 4679–4690, 2006.
ACPD
10, 28273–28309, 2010Three-year ground based measurements
of Aerosol Optical Depth
E. Gerasopoulos et al.
Title Page
Abstract Introduction
Conclusions References
Tables Figures
◭ ◮
◭ ◮
Back Close
Full Screen / Esc
Printer-friendly Version Interactive Discussion
Discussion
P
a
per
|
Dis
cussion
P
a
per
|
Discussion
P
a
per
|
Discussio
n
P
a
per
|
Hillamo, R., and Mihalopoulos, N.: Size-segregated mass distributions of aerosols over Eastern Mediterranean: seasonal variability and comparison with AERONET columnar size-distributions, Atmos. Chem. Phys., 7, 2551–2561, doi:10.5194/acp-7-2551-2007, 2007. Gerasopoulos, E., Kokkalis, P., Amiridis, V., Liakakou, E., Perez, C., Haustein, K., Eleftheratos,
K., Andreae, M. O., Andreae, T. W., and Zerefos, C. S: Dust specific extinction cross sections
5
over the Eastern Mediterranean using the BSC-DREAM model and sun photometer data: the case of urban environments, Ann. Geophys., 27, 2903–2912, 2009,
http://www.ann-geophys.net/27/2903/2009/.
Giannakaki, E., Balis, D. S., Amiridis, V., and Zerefos, C.: Optical properties of different aerosol types: seven years of combined Raman-elastic backscatter lidar measurements in
Thessa-10
loniki, Greece, Atmos. Meas. Tech., 3, 569–578, doi:10.5194/amt-3-569-2010, 2010. Giavis, G. M., Kambezidis, H. D., Sifakis, N., Toth, Z., Adamopoulos, A. D., and Zevgolis,
D.: Diurnal variation of the aerosol optical depth for two distinct cases in the Athens area, Greece, Atmos. Res., 78(1–2), 79–92, doi:10.1016/j.atmosres.2005.03.003, 2005.
Gobbi, G. P., Kaufman, Y. J., Koren, I., and Eck, T. F.: Classification of aerosol properties
15
derived from AERONET direct sun data, Atmos. Chem. Phys., 7, 453–458, doi:10.5194/acp-7-453-2007, 2007.
Griffin, D. W., Kubilay, N., Kocak, M., Gray, M. A., Borden, T. C., Shinn, E. A.: Airborne desert dust and aeromicrobiology over the Turkish Mediterranean coastline, Atmos. Environ., 41, 4050–4062, doi:10.1016/j.atmosenv.2007.01.023, 2007.
20
Harrison, L. and Michalsky, J.: Objective algorithms for the retrieval of optical depths from ground-based measurements, Appl. Optics, 33, 5126–5132, 1994.
Harrison, L., Michalsky, J., and Berndt, J.: Automated multifilter rotating shadow-band radiome-ter: an instrument for optical depth and radiation measurements, Appl. Optics, 33, 5118– 5125, 1994.
25
Hatzianastassiou, N., Gkikas, A., Mihalopoulos, N., Torres, O., and Katsoulis, B. D.: Natural versus anthropogenic aerosols in the eastern Mediterranean basin derived from multiyear TOMS and MODIS satellite data, J. Geophys. Res., 114, D24202, doi:10.1029/2009JD011982, 2009.
IPCC: Intergovernmental Panel on Climate Change, Climate Change 2001: The Scientific
Ba-30
ACPD
10, 28273–28309, 2010Three-year ground based measurements
of Aerosol Optical Depth
E. Gerasopoulos et al.
Title Page
Abstract Introduction
Conclusions References
Tables Figures
◭ ◮
◭ ◮
Back Close
Full Screen / Esc
Printer-friendly Version Interactive Discussion
Discussion
P
a
per
|
Dis
cussion
P
a
per
|
Discussion
P
a
per
|
Discussio
n
P
a
per
|
IPCC: Intergovernmental Panel on Climate Change 2007: Climate Change 2007: The Physical Science Basis, Summary for Policymakers, Paris, February 2007.
Israelevich, P. L., Levin, Z., Joseph, J. H., and Ganor, E.: Desert aerosol transport in the Mediterranean region as inferred from the TOMS aerosol index, J. Geophys. Res., 107(D21), 4572, doi:10.1029/2001JD002011, 2002.
5
Jacovides, C. P., Kaltsounides, N. A., Asimakopoulos, D. N., and Kaskaoutis, D.G.: Spectral aerosol optical depth and ˚Angstr ¨om parameters in the polluted Athens atmosphere, Theor. Appl. Climatol., 81, 161–167, doi:10.1007/s00704-004-0110-3, 2005.
Kazadzis, S., Bais, A., Amiridis, V., Balis, D., Meleti, C., Kouremeti, N., Zerefos, C. S., Rapso-manikis, S., Petrakakis, M., Kelesis, A., Tzoumaka, P., and Kelektsoglou, K.: Nine years of
10
UV aerosol optical depth measurements at Thessaloniki, Greece, Atmos. Chem. Phys., 7, 2091–2101, doi:10.5194/acp-7-2091-2007, 2007.
Kalivitis, N., Gerasopoulos, E., Vrekoussis, M., Kouvarakis, G., Kubilay, N., Hatzianastas-siou, N., Vardavas, I., and Mihalopoulos, N.: Dust transport over the Eastern Mediter-ranean from TOMS, AERONET and surface measurements, J. Geophys. Res., 112, D03202,
15
doi:10.1029/2006JD007510, 2007.
Kanakidou, M., Mihalopoulos, N., Kindap, T., Im, U., Vrekoussis, M., Dermitzaki, E., Gera-sopoulos, E. , Unal, A., Koc¸ak, M., Markakis, K., Melas, D., Youssef, A. F., and Moubasher, H.: Megacities as hot spots of air pollution in the East Mediterranean, submitted to Atmos. Environ., 2010.
20
Karnieli, A., Derimian, Y., Indoitu, R., Panov, N., Levy, R. C., Remer, L. A., Maenhaut, W., and Holben, B. N.: Temporal trend in anthropogenic sulfur aerosol transport from central and eastern Europe to Israel, J. Geophys. Res., 114, D00D19, doi:10.1029/2009JD011870, 2009.
Kaskaoutis, D. G., Kosmopoulos, P., Kambezidis, H. D., and Nastos, P. T.: Aerosol climatology
25
and discrimination of different types over Athens, Greece, based on MODIS data, Atmos. Environ., 41, 7315–7329, doi:10.1016/j.atmosenv.2007.05.017, 2007.
Kaufman, Y. J., Herring, D. D., Ranson, K. J., and Collatz, G. J.: Earth Observing System AM1 mission to Earth, IEEE T. Geosci. Remote. , 36(4), 1045–1055, 1998.
Koukouli, M. E., Kazadzis, S., Amiridis, V., Ichoku, C., Balis, D. S., and Bais, A. F.: Signs of
30
a negative trend in the MODIS aerosol optical depth over the Southern Balkans, Atmos. Environ., 44, 1219–1228, 2010.
ACPD
10, 28273–28309, 2010Three-year ground based measurements
of Aerosol Optical Depth
E. Gerasopoulos et al.
Title Page
Abstract Introduction
Conclusions References
Tables Figures
◭ ◮
◭ ◮
Back Close
Full Screen / Esc
Printer-friendly Version Interactive Discussion
Discussion
P
a
per
|
Dis
cussion
P
a
per
|
Discussion
P
a
per
|
Discussio
n
P
a
per
|
Makela, T., Hillamo, R., and Mihalopoulos, N.: Chemical composition and sources of fine and coarse aerosol particles in the Eastern Mediterranean, Atmos. Environ., 42(26), 6542– 6550, doi:10.1016/j.atmosenv.2008.04.0102008, 2008.
Kouvarakis, G., Doukelis, Y., Mihalopoulos, N., Rapsomanikis, S., Sciare, J., and Blumthaler, M.: Chemical, physical and optical characterisation of aerosols during PAUR II experiment,
5
J. Geophys. Res., 107(18), 8141, doi:10.1029/2000JD000291, 2002.
Kubilay, N., Cokacar, T., and Oguz, T.: Optical properties of mineral dust out-breaks over the northeastern Mediterranean, J. Geophys. Res., 108(D21), 4666, doi:10.1029/2003JD003798, 2003.
Lelieveld, J., Berresheim, H., Borrmann, S., Crutzen, P. J., Dentener, F. J., Fischer, H.,
Fe-10
ichter, J., Flatau, P. J., Heland, J., Holzinger, R., Korrmann, R., Lawrence, M. G., Levin, Z., Markowicz, K. M., Mihalopoulos, N., Minikin, A., Ramanathan, V., de Reus, M., Roelofs, G. J., Scheeren, H. A., Sciare, J., Schlager, H., Schultz, M., Siegmund, P., Steil, B., Stephanou, E. G., Stier, P., Traub, M., Warneke, C., Williams, J., and Ziereis, H.: Global air pollution crossroads over the Mediterranean, Science 298, 794–799, 2002.
15
Liakakou, E., Bonsang, B., Williams, J., Kalivitis, N., Kanakidou, M., and Mihalopoulos, N.: C2– C8 NMHCs over the Eastern Mediterranean: Seasonal variation and impact on regional oxi-dation chemistry, Atmos. Environ., 5611–5621, doi:10.1016/j.atmosenv.2009.07.067, 2009. Masuoka, E., Fleig, A., Wolfe, R. W., and Patt, F.: Key characteristics of the MODIS data
products, IEEE Trans. Geosci. Remote Sens, 36(4), 1313–1323, doi:10.1109/36.701081,
20
1998.
Matthias, V., Balis, D., Bosenberg, J., Eixmann, R., Iarlori, M., Komguem, L., Mattis, I., Pa-payannis, A., Pappalardo, G., Perrone, M. R., and Wang, X.: Vertical aerosol distribution over Europe: Statistical analysis of Raman lidar data from 10 European Aerosol Research Lidar Network (EARLINET) stations, 109, D18201, doi:10.1029/2004JD004638, 2004.
25
Mitsakou, C., Kallos, G., Papantoniou, N., Spyrou, C., Solomos, S., Astitha, M., and Housiadas, C.: Saharan dust levels in Greece and received inhalation doses, Atmos. Chem. Phys., 8, 7181–7192, doi:10.5194/acp-8-7181-2008, 2008.
Papadimas, C. D., Hatzianastassiou, N., Mihalopoulos, N., Kanakidou, M., Katsoulis, B. D., and Vardavas, I.: Spatial and temporal variability in aerosol properties over the
Mediter-30
ranean basin based on 6-year (2000–2006) MODIS data, J. Geophys. Res., 113, D11205, doi:10.1029/2007JD009189, 2008.