www.nonlin-processes-geophys.net/15/457/2008/ © Author(s) 2008. This work is distributed under
the Creative Commons Attribution 3.0 License.
in Geophysics
Assessing soil surface roughness decay during simulated rainfall by
multifractal analysis
E. Vidal V´azquez1, R. Garc´ıa Moreno2, J. G. V. Miranda3, M. C. D´ıaz2, A. Sa´a Requejo2, J. Paz Ferreiro1, and
A. M. Tarquis4
1Facultad de Ciencias, Universidade da Coru˜na, Spain
2Departamento de Edafolog´ıa, E.T.S. Ingenieros Agr´onomos, UPM, Ciudad Universitaria, Madrid, Spain 3Instituto de F´ısica, Universidade Federal da Bahia, Brazil
4Dpto. de Matem´atica Aplicada, E.T.S. Ingenieros Agr´onomos, UPM, Ciudad Universitaria, Madrid, Spain
Received: 13 November 2007 – Revised: 15 May 2008 – Accepted: 19 May 2008 – Published: 23 June 2008
Abstract. Understanding and describing the spatial charac-teristics of soil surface microrelief are required for modelling overland flow and erosion. We employed the multifractal ap-proach to characterize topographical point elevation data sets acquired by high resolution laser scanning for assessing the effect of simulated rainfall on microrelief decay. Three soil surfaces with different initial states or composition and rather smooth were prepared on microplots and subjected to succes-sive events of simulated rainfall. Soil roughness was mea-sured on a 2×2 mm2grid, initially, i.e. before rain, and after
each simulated storm, yielding a total of thirteen data sets for three rainfall sequences. The vertical microrelief component as described by the statistical index random roughness (RR) exhibited minor changes under rainfall in two out of three study cases, which was due to the imposed wet initial state constraining aggregate breakdown. The effect of cumulative rainfall on microrelief decay was also assessed by multifrac-tal analysis performed with the box-count algorithm. Gen-eralized dimension,Dq, spectra allowed characterization of the spatial variation of soil surface microrelief measured at the microplot scale. TheseDq spectra were also sensitive to temporal changes in soil surface microrelief, so that in all the three study rain sequences, the initial soil surface and the surfaces disturbed by successive storms displayed great dif-ferences in their degree of multifractality. Therefore, Multi-fractal parameters best discriminate between successive soil stages under a given rain sequence. Decline of RR and mul-tifractal parameters showed little or no association.
Correspondence to:E. Vidal V´azquez
(evidal@udc.es)
1 Introduction
The surface of agricultural soils is built up from clods and ag-gregates arranged in a complex system of successive macro and/or microstructures. Soil surface roughness (SSR) is de-fined as the configuration of soil microrelief at small scales, of less than one meter (Allmaras et al., 1966; Linden and van Doren, 1986; Huang and Bradford, 1990; Merril et al., 2001). Soil surface roughness, taken on a scale ranging from cm to mm, plays a very important role in increasing water infiltration and the amount of crop water available and reduc-ing runoff on cultivated lands (Podmore and Huggins, 1981; Armstrong, 1986; Kamphorst et al., 2000). Besides, SSR has been demonstrated to influence water infiltration, splash amount, overland flow and runoff routing (Govers et al., 2000; R¨omkens et al., 2001; G´omez and Nearing, 2005), to reduce runoff velocity and, thus, to decrease soil detachment and transport (Cogo et al., 1983) caused by water erosion.
Oriented roughness due to tillage tools exhibit periodic patterns and is easy to quantify by geometric models. How-ever, random roughness assessment implies a quantifica-tion of the spatial distribuquantifica-tion of microrelief elements with various that are randomly oriented, which has been more challenging (Huang 1998a). This notwithstanding random roughness (RR) is calculated as the standard error (Allmaras et al., 1966) or as the standard deviation (Kamphorst et al., 2000) of point elevations relative to a reference plane. There-fore, this index represents a statistical measure of vertical topographic variations, implicitly assuming that there is no spatial variation in surface roughness (Eltz and Norton, 1997; Kamphorst et al., 2000).
The relationship between rainfall energy and microtopo-graphic features controls many transfer processes on and across the soil surface, including overland flow and erosion. The effects of soil roughness are mainly evident during the early stages of erosion processes, when soil detachment by raindrop impact, seal development and runoff generation are major factors and surface flow and concentrated flow are ab-sent or limited (Mitchell and Jones, 1978; Helming et al., 1998). In these stages, depressional storage affects incip-ient runoff and soil detachment by raindrop impact due to the presence of pounded water. One important effect is the higher infiltration rate of the soil with greater roughness, although the influence of microrelief tends to decrease or even disappear due to surface sealing as rainfall progresses (Moore and Singer, 1990). Depressional storage also re-duces runoff, and the importance of this effect also decreases with cumulative rainfall. Therefore, the usual observations reported in the literature and the common manner that mod-els account for roughness effects on erosion indicate that a smooth surface generally yields more runoff and sediment than does a rough one (Zobeck and Onstad, 1987; Renard et al., 1997; Hairsine and Rose, 1992). On the other hand, soil erosion may be lessened under conditions of greater rough-ness not only from the reduction of runoff but also due to the greater level of hydraulic resistance that dissipates the flow energy (Einstein et al., 1951). Spatial configuration of soil microrelief is decisive for a description of depressional stor-age areas filled with water and for assessing the connectivity of runoff pathways (Onstad, 1984).
Erosion processes, i.e. sediment detachment, transport and deposition interact on both the micro- and macroscales (Fos-ter, 1982). On the microscale feedback and interaction may occur with the structural units responsible for random and oriented roughness. On a soil surface with random roughness features, detachment on the peaks of the largest clods and aggregates produces a local sediment load that exceeds the local transport capacity causing deposition in small depres-sions. Detachment reduces clod height and deposition fills local hollows, decreasing both the vertical roughness com-ponent and the depressional storage through time (Helming et al., 1998; Kamphorst et al., 2000). As clods and aggre-gates are eroded and depressions are filled the gap between
detachment and deposition decreases, so that deposition ends as the soil surface becomes smooth. Although detachment is not selective, entrainment and specially deposition are highly selective, resulting in coarse particles being left behind at the soil surface and fine particles being deposited in depressions, which may cause severe topography changes at small scales. Therefore, the total flow energy is unavailable to transport sediments (Foster, 1982; Abrahams and Parsons, 1991). In addition, the resistance of soil to detachment affects erosion by raindrop impact due to the modification of the clod size distribution (R¨omkens and Wang, 1986; Moldenhauer and Kemper, 1969).
All of the former effects tend to cause erosion on rough soil surfaces to be less than that on a corresponding smoother one, for a given slope. Nevertheless, these effects are mainly active during the early stages of rainfall, although they are also perceptible until runoff fills and interconnects the soil depressions, and a complete drainage network is developed. Most studies on the effect of the roughness induced by tillage have been focused on these early stages of rainfall and have been conducted on small laboratory or field plots, where a full drainage network can hardly build up. However, when the effect of the initial roughness on runoff and soil losses was studied at a scale large enough for the overland flow to reach a natural velocity, the experimental results have chal-lenged the conventional view previously commented, show-ing little effect of roughness on runoff and overall higher sed-iment yield on the rougher surface at steep slopes (Helming et al., 1998; G´omez and Nearing, 2005). Moreover, these experiments showed that during the initial stages of rain-fall, runoff and erosion were delayed on the rougher surfaced soils. But, as the experiment progressed, both runoff and ero-sion were less affected by the roughness treatments. At the end, the total runoff amounts did not vary as a function of the roughness treatment, and the total erosion rates were ac-tually greater for the rougher soil surface treatments. This may be explained in terms of the surface features being of the same order of magnitude or larger in size than the flow depth, which affected the spatial distribution of the overland flow (Abrahams and Parsons, 1990) and induced a higher de-gree of flow concentration on the rough surfaces (R¨omkens et al., 2001).
This effect occurred for both drainage and seepage condi-tions and persisted even after the surface storage capacity became low. Then, the authors concluded that the results showed that roughness had no significant effect on particle flux and concentration both under drainage and seepage con-ditions.
The above literature review indicates that the roughness effect on erosion can be further compounded by surface and subsurface factors and processes occurring at different scales. Surface microtopography influence surface processes like erosion, deposition, infiltration, etc. and many of these surface processes also causes a change in surface morphol-ogy (Huang, 1998a). It follows that microrelief is the product of several feedbacks and multiscale interactions involving a complex spatial and temporal variability.
Soil surface roughness has been the subject of an increas-ing number of studies since the pioneerincreas-ing work of Burwell et al. (1963) and Allmaras et al. (1966). Soil surface rough-ness has also been described using fractal models (Arm-strong, 1986; Huang and Bradford, 1992; Gallant et al., 1994; Eltz and Norton, 1997; Huang, 1998; Davis and Hall, 1999; Vidal V´azquez et al., 2005, 2006, 2007). In general, for natural surfaces correlation distance has been found to be equal or smaller than the size of the greatest structural units, aggregates or clods on the soil surface, i.e. in the range from a few centimetres to a few decimetres (Huang and Bradford, 1992; Helming, 1993; Vidal V´azquez et al., 2005). Never-theless, the effects of short-distance correlation on overland flow generation are thought to be negligible at the plot or mi-crotopography (Darboux and Huang, 2005). Actually, most depression storage models assume a completely uncorrelated soil surface (Mitchell and Jones, 1978; Moore and Larson, 1979, 1978; Kamphorst et al., 2000). This may be the reason why, in soil microrelief studies, fractals have been relegated to a narrow range of scales and to specialized technical ap-plications (Vidal V´azquez et al., 2005).
A fractal model refers to a set and can be characterized by a single parameter, such as the fractal dimension,D, while a multifractal model refers to a measure and can be charac-terized by a continuous spectrum of fractal dimensions usu-ally referred to as the generalized dimension, Dq. Multi-fractals are spatially intertwined Multi-fractals. Basic information on the multifractal concept and on procedures to character-ize multifractals can be found in several books (Everstz and Mandelbrot, 1992; Falconer, 1997). Multifractal analysis has been recently used in many fields including soil sciences (Folorunso et al., 1994; Caniego et al., 2005; Bird et al., 2006; Dathe et al., 2006; Grau et al., 2006; Ib´a˜nez et al., 2006; Roisin, 2007). However, very little information has been reported about the possible application of multifractal concepts for characterizing soil microrelief (Garc´ıa Moreno, 2006; Garc´ıa Moreno et al., 2008).
The aim of this study is to describe the characteristics of soil surface microrelief decay under simulated rainfall em-ploying multifractal concepts and to compare the widely used statistical index RR with the multifractal quantification.
2 Material and methods
2.1 Soils
Two medium textured soils were selected from Mabegondo (Coru˜na province) and Pastoriza (Lugo province), both lo-cated in Northern Spain, on the basis of differences in clay and silt fractions, organic matter content and structural sta-bility. Next, these soils will be referred to as MA for Mabegondo and LU for Pastoriza. The soils were Umbrisols (FAO) equivalent with Inceptisols (Umbrepts) according to the US. Soil Taxonomy (Table 1). Briefly, the Mabegondo soil had been continuously cropped to corn (Zea mays, L.) in summer and left fallow in winter for several decades, whereas the Pastoriza soil had been under corn and winter cereal (Lolium multiflorum, L.) rotation. Organic matter con-tent of the later soil was much higher than that of the former. Silt and sand content differences were also remarkable, with higher silt values and lower sand values for the Mabegondo soil. Aggregate stability was significantly greater in the soil from Pastoriza than in the soil from Mabegondo.
2.2 Microrelief data sets
Roughness measurements were performed in laboratory con-ditions. Soil surfaces were prepared using air dry aggregates from the top layer of the studied soils and packing them in small containers or trays horizontally disposed. The largest aggregates were 20–40 mm in diameter. The depth of the soil in the containers was 0.05 m. A sand layer below the artifi-cial soil layer allowed free drainage. Aggregates with the largest diameters were randomly located on the soil surface, avoiding sorting. The initial soil surface was gentle leveled before starting laser scanning.
These initial conditions were reconstructed to simulate a natural seedbed so that random roughness was rather low. Disturbed situations were obtained by simulated rain. Two different rainfall simulators were used. The Mabegondo soil (MA4 and MA6) was subjected to simulated rainfall under a drop-forming device at intensity of 30 mm h−1. The
Pastor-iza soil (LU1) was subjected to simulated rainfall produced by a nozzle system at intensity of 65 mm h−1.
Table 1.Composition and main characteristics of the soil surfaces used in this study.
Surface code
OM (%)
Clay (%)
Silt (%)
Sand (%)
Initial state
Plot size (m2)
Cells per surface
Rain simulator
Rain intensity
Scanned surfaces
MA4 1.2 19.8 56.0 24.2 wet 0.21 52900 dropper 30 mm h−1 4 MA6 1.2 19.8 56.0 24.2 dry 0.21 52900 dropper 30 mm h−1 5 LU1 5.7 22.3 47.0 30.7 wet 0.30 75625 nozzle 65 mm h−1 4
The configuration of soil topography was described by a set of points of knownx-,y- andz-coordinates. The eleva-tion values given as a funceleva-tion of the horizontal coordinate system provide a numerical representation of the surface and constitute a digital elevation model (DEM). From each ex-perimental data set of soil surface microtopography a DEM was obtained after trend removal, representing the random roughness condition.
2.3 Generalized fractal dimension
The concepts of fractals (Mandelbrot, 1983) and multifrac-tals (Everstz and Mandelbrot, 1992; Falconer, 1997) and its application to soil science (Pachepsky et al., 2000) and more specifically microtopography (Eltz and Norton, 1997; Huang, 1998a; Vidal V´azquez et al., 2005, 2006; Garc´ıa Moreno, 2006; Garc´ıa Moreno et al., 2008) has been well described in the literature, so we shall not reiterate it here. In our work the scaling of point elevation measurements is directly assessed to obtain multifractal parameters.
If a profile of point heights measurements in a two dimen-sional space is covered by boxes of side lengthδ, the number of such boxes, n (δ)needed to cover the experimental tran-sect whenδ→0 varies as:
n(δ)∝δ−D (1)
The fractal dimension, D, can be obtained by counting the numbernof boxes required to cover the object under inves-tigation for increasing box sizesδ and fitting the slope of a log-log plot.
Using the box-counting technique for estimation of a sin-gle fractal dimension implies that each box employed for covering a transect is counted regardless of the proportion of the area occupied with pixels of a given height class. In other words, monofractal calculation does not account for the mass contained in each box, so that all of them have the same weight.
However, the generalized dimension calculated using the box-counting (BC) method essentially reflects the mass con-tained in each box. Let us consider that a domain of sizeR2
as the support of the measure,δ. To assess the heterogeneity of the measure,δ, the unit initial squareL×Lis partitioned into n boxes of sizeδ×δ, by successive divisions in dyadic
scaling down. Thus, the intervals for downscaling are loga-rithmically spaced.
Multifractal methods can resolve highly complex patterns of arrangement of the point elevation measurements defin-ing soil surface microrelief. This complexity is character-ized by using a mesh of square boxes of side length δ so that to each region of the space the corresponding quantity
µ(δ) can be assigned. In practice, to implement the multi-fractal analysis of a distribution supported on a plane, a set of different meshes with cells or subintervals with equal length is required. The measureµi (δ) distributed over an inter-val of sizes was computed from the experimental point el-evation data,hi. FirstHi are normalized,Hi=(hi/Pihi),
i=1,2, ..., n,withPni=1Hi=1, and then the measureµi (δ)
assigned to those blocks was calculated by adding all contri-butionshiinside a box.
In our case the study regions were square areas of initial sizes 460 mm for MA data sets and 550 mm for LU data sets and the size of each cell was 2 mm. Thus, depending on the data set the range of scales in the available data varied from 1 to 230 cells and from 1 to 275 cells, respectively.
For each boxith the probability distribution is:
pi(δ)=µi(δ)=δαi (2)
whereαi is the H¨older exponent characterizing density in theith box. For multifractal measures, the numberNδ(α)of boxes of sizeδhere the probability has values in the interval obeys a power law:
N (α)∝δ−f (α) (3)
In practice, using the box counting method, for every box,i, the probability of “containing object”, also called the parti-tion funcparti-tion, is obtained for different momentsqwhich can vary from –∞to +∞. For multifractal distributed measures, the partition function scales with the block size as follows:
χ (q, δ) =
n(δ)
X
i=1
pqi(δ) =
n(δ)
X
i=1
µqi(δ) (4)
A log-log plot of the quantityχ (q,δ) versusδ for different values ofqyields:
whereτ (q)is the mass scaling function of orderq. Alsoτ q
can be written as:
τ (q) = lim
δ→0
logχ (q, δ)
logδ (6)
Multifractal measures are primarily characterized by their spectrum of dimensions. The concept of generalized dimen-sion,Dq, corresponds to the scaling exponent for theqth mo-ment of the measure. Based on the work of R´enyi (1955) generalized dimensions are defined as:
Dq = lim
δ→0
1
q−1
log [χ (q, δ)]
logδ (7)
Therefore,τ andDqare related as:
τ (q)=(q−1)Dq (8)
For a monofractal,Dqis a constant function ofq, so no addi-tional information is obtained by examining higher moments. However, for multifractal measures, the relationship between
Dq andq is not constant. In this case, the most frequently used generalized dimensions areD0 for q=0, D1 for q=1
andD2 forq=2 termed, respectively, capacity, information
(Shannon entropy) and correlation dimension.
The capacity or box-counting dimension,D0, is
indepen-dent of the quantity of mass in each box; it is the scaling exponent of the number of non-empty boxes and takes into account the fact that the boxes are occupied or not.
The information dimension, D1, gives the probability of
occupation of theith box of sizeδ, without taking into ac-count the way in which the measure is distributed within each box. Thus,D1provides a physical characterization
in-dicating how heterogeneity changes across a certain range of scales and it is also related to Shannon entropy index. D0
andD1take the same value if all the boxes have equal
prob-ability. Note that using Eq. (7)D1becomes indeterminate
because the value of denominator is zero. Therefore, for the particular case thatq=1, the following equation is used:
D1= lim
δ→0
n(δ)P
i=1
χi(1, δ)log [χi(1, δ)]
logδ (9)
The correlation dimension,D2, describes the uniformity of
the measure values among intervals. The generalized dimen-sion,Dq, is more useful for the comprehensive study of mul-tifractals. Differences betweenDqallow comparison of the complexity between measured soil microrelief data sets.
Commonly the degree of multifractality is assessed from the curvature of functions involved in multifractal analysis, i.e. singularity spectraf (α), mass exponent function τ (q)
or generalized dimension, Dq (e.g. Cheng, 1999). In this work the main properties of the multifractality will be de-scribed by a few parameters taken from the functionsDqand
τ (q). A sigma shapedDq spectra is taken as an indication
that the measure is multifractal, whereas quasi-linear spectra
0 1 2 3 4 5 6 7
0 50 100 150 200
Cumulative rain (mm)
RR
(m
m)
MA4
MA6
LU1
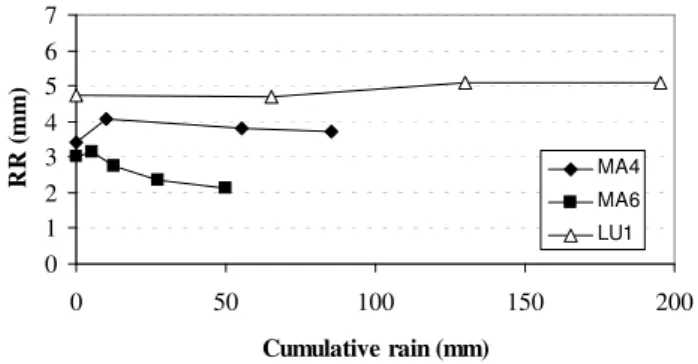
Fig. 1.Random roughness (RR) versus cumulative rainfall for three different initial soil surfaces, under given rain sequences.
are close to monofractals. Thus, in homogeneous structures
Dqare close, whereas in a monofractal they are equal. Notice that, for a monofractal distribution, values ofD0,D1andD2
become similar. Therefore, if a distribution has a tendency to multifractality it will be observed thatD0> D1>D2. On the
other hand, also the properties of the functionτ (q), specially the local properties ofτ (q)aroundq=1, have been found to be useful for describing multifractality (Cheng, 1997, 1999). Following Cheng’s work from the mass exponent function
τ (q)the main properties of the multifractality of the measure
can be characterized by the parameter τ(0)–2τ+τ, named here the multifractality index (MI). If MI<0 the measure cor-responds to a multifractal, whereas MI=0 indicates a single fractal or a non-fractal. Other general indices derived from
τ (q) as 1τ (q)−2τ (0)+τ (−q) are usually proportional to
the MI (Cheng, 1999).
3 Results and discussion
3.1 Evolution of the vertical roughness component The evolution of random roughness (RR) with cumulative rainfall is shown in Fig. 1. This statistical parameter var-ied from 3.39 to 4.09 mm in the MA4 sequence, from 3.00 to 2.13 in the MA6 sequence and from 4.72 to 5.10 mm in the LU1 sequence. In natural conditions RR may vary ap-proximately between 1 and 40 mm (Kamphorst et al., 2000). Consequently, the studied soil surfaces were rather smooth, as it is expected for seedbeds.
0 1 2 3 4 5 -120 -80 -40 0 40 80 120 160
0 mm rain
δ
μ
(q,
δ
)
'-10 '-9 '-8 '-7 '-6 '-5 '-4 '-3 '-2 '-1 '0 '1 '2 '3 '4 '5 '6 '7 '8 '9 '100 1 2 3 4 5
-120 -80 -40 0 40 80 120 160
5 mm rain
δ
μ
(q
,
δ
)
'-10 '-9 '-8 '-7 '-6 '-5 '-4 '-3 '-2 '-1 '0 '1 '2 '3 '4 '5 '6 '7 '8 '9 '10Fig. 2.Plots on a log-log diagram of the partition function,χ (q,δ), versus measurement scale,δ of two soil surfaces from the MA6 sequence.
after sudden wetting. In the wet surfaces MA4 and LU1 air entrapment was avoided and therefore the main driving force of microrelief decay was raindrop kinetic energy. Moreover, during the experiment with simulated rainfall the soil sur-faces were partly covered by a water layer acting as mulch that protected the artificial seedbed from the drop impact.
Therefore, in our study cases, slaking by air entrapment caused a faster roughness breakdown of the initially dry sur-face MA6. Notice also that the small increase in random roughness with increasing rain may be the result of surface consolidation effects and aggregate rearrangements induced by rainfall, which have been reported before (Eltz and Nor-ton, 1997). These effects have been also observed in MA6 surface when comparing the initial dry stage and the stage after 5.0 mm rain.
0 1 2 3 4 5
-120 -80 -40 0 40 80 120 160
0 mm rain
μ
(q
,
δ
)
δ
'-10 '-9 '-8 '-7 '-6 '-5 '-4 '-3 '-2 '-1 '0 '1 '2 '3 '4 '5 '6 '7 '8 '9 '100 1 2 3 4 5
-120 -80 -40 0 40 80 120 160
δ
μ
(q,
δ
)
195 mm rain
'-10 '-9 '-8 '-7 '-6 '-5 '-4 '-3 '-2 '-1 '0 '1 '2 '3 '4 '5 '6 '7 '8 '9 '10
Fig. 3. Plots on a log-log diagram of the partition functionχ (q,
δ), versus measurement scale,δof two soil surfaces from the LU1 sequence.
3.2 Multifractal parameters of soil surface microrelief 3.2.1 Partition function
Values of the partition functionχ (q,δ) have been estimated for the whole available box size range in steps of 2k, 0<k<7. The log-log plots of the normalized measuresχ (q,δ)versus measurement scales,δ, calculated with Eq. (5) were exam-ined to find out whether the spatial pattern of soil surface microrelief obeys power low scaling. Figure 2 shows two se-lected plots for the MA6 surface, those of the dry initial stage and the subsequent stage after 5 mm rain. Figure 3 shows two more plots that correspond to the LU1 surface at the wet ini-tial state and after cumulative 195 mm rain, respectively.
Forq>0 the partition functions of all investigated data sets
close to unity and for momentsq equal or close to –10. Vi-sually, the most noticeable departure from the straight-line model was detected forq=–10 atδ values close to unity on the initial stage of the MA6 surface, as illustrated in Fig. 2. In other words, the largest grid length deviates most from the straight line, although there is also some curvature at the opposite end, i.e. the smallest grid length. Estimations ofD0
using 8 regression points resulted in values higher than 2.000, with no physical meaning. Therefore, the point correspond-ing at the largest grid length in Figs. 2 and 3 was excluded from the regression analysis. Thus, all the calculations were done choosing 7 regression points, so that the last point on the left was discarded.
One of the most important steps in multifractal analysis is to determine the range of δ andq exhibiting linear be-haviour. Particularly forq<0,Dq values may vary depend-ing on whether all the regression points or only the points of the straight line region are used in the analysis. This issue is recurrent ever since multifractal analysis was first applied and a careful study of coefficients of determination is re-quired (e.g. Evertsz and Mandelbrot, 1992; Bird et al., 2006; Grau et al., 2006, among others). Coefficients of determina-tion,R2, of the straight line logχ (q,δ)versus logδ, standard errors of the slope, together with the corresponding D values for selectedq moments, are listed in Table 2. All the calcu-lations were done choosing 7 regression points as explained above. Forq=–10, values ofR2were higher than 0.999. For
q=10, values ofR2were higher than 0.992. It follows that for all the studied microrelief conditions and statistical moments (q=–10 to 10) the logarithm of the normalized measures ver-sus the logarithm of the measurement scales fit a straight line withR2>0.992.
The distribution of a measure is considered as a mono-or multifractal when the moments obey power laws, i.e. the double log plots ofχ (q,δ)against logδvaries linearly. There were, however, differences in the degree of power law scal-ing between and within the three artificial surfaces submit-ted to simulasubmit-ted rain sequences. Moreover, for a given data set the linear fittings for momentsq≫1 and forq≪1 often showed divergences. For instance, the coefficients of deter-mination of the generalized dimension values,Dmax,
calcu-lated forq=10 were greater in all the surfaces of the LU1 se-quence, than in those of the MA4 and MA6 sequences. How-everDminvalues calculated forq=–10 showed lower
coeffi-cients of determination in the surfaces of the LU1 sequence. Consequently, analysis of the partition function indicates by now different degrees of multifractality, which will be next addressed by analyzing the generalized dimension function,
Dq, and some derived parameters.
3.3 Generalized dimensions
Generalized dimensionsDqwere calculated with Eqs. 7 and 9 from the slopes of the partition functionχ (q, δ), versus distance,δ, on a log-log plot. The obtained Dq curves of
1.8 1.9 2.0 2.1 2.2 2.3 2.4 2.5
-10 -8 -6 -4 -2 0 2 4 6 8 10
q Dq
0 mm 10 mm 55 mm 85 mm
MA4
MA6
LU1 1.8
1.9 2.0 2.1 2.2 2.3 2.4 2.5
-10 -8 -6 -4 -2 0 2 4 6 8 10
q
D
q
0 mm 5 mm 12.5 mm 27.5 mm 50 mm
1.8 1.9 2.0 2.1 2.2 2.3 2.4 2.5
-10 -8 -6 -4 -2 0 2 4 6 8 10
q Dq
0 mm 65 mm 130 mm 195 mm
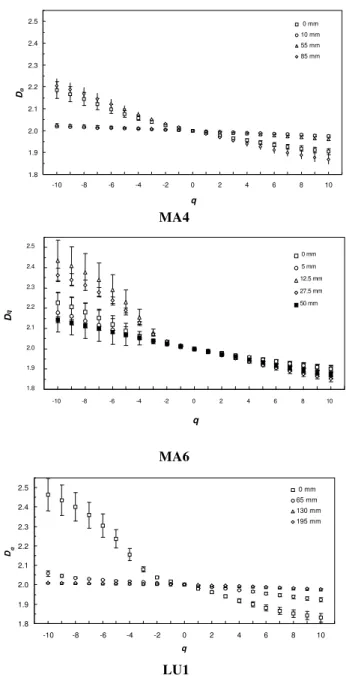
Fig. 4.Generalized dimensions and standard errors as a function of
qfor MA4, MA6 and LU1 sequences.
the 13 studied data sets computed for –10<q<10 together with their standard errors are shown in Fig. 4. TheseDq, curves are grouped according with the three different rain sequences. In general,Dq is larger for low values ofq and decreases with increasingq. This, notwithstanding, a wide variety of R´enyi spectra was found within each of the three rain sequences.
Table 2.Cumulative rain and multifractal parameters for three soil surfaces with different initial state conditions subjected to simulated rain. Multifractal parameters are: generalized dimensions forq=–10 andq=+10, and for the three positive moments,q=0, 1 and 2, respectively.
rain (mm) qmin qmax Dmin R2 Dmax R2 D0 R2 D1 R2 D2 R2
MA4, initially wet, dropper rain simulator
0.0 –10 10 2.185±0.039 0.998 1.904±0.013 1.000 2.000±0 1.000 1.988±0.002 1.000 1.977±0.004 1.000
10.0 –10 10 2.018±0.003 1.000 1.976±0.004 1.000 2.000±0 1.000 1.998±0.000 1.000 1.996±0.001 1.000
55.0 –10 10 2.027±0.004 1.000 1.961±0.007 1.000 2.000±0 1.000 1.997±0.001 1.000 1.993±0.001 1.000
85.0 –10 10 2.204±0.033 0.999 1.869±0.021 0.999 2.000±0 1.000 1.985±0.003 1.000 1.970±0.005 1.000
MA6, initially dry, dropper rain simulator
0.0 –10 10 2.227±0.052 0.997 1.900±0.014 1.000 2.000±0 1.000 1.989±0.002 1.000 1.978±0.003 1.000
5.0 –10 10 2.179±0.032 0.999 1.902±0.013 1.000 2.000±0 1.000 1.989±0.002 1.000 1.978±0.003 1.000
12.5 –10 10 2.436±0.099 0.992 1.868±0.016 1.000 2.000±0 1.000 1.985±0.002 1.000 1.971±0.003 1.000
27.5 –10 10 2.364±0.097 0.992 1.852±0.017 1.000 2.000±0 1.000 1.984±0.001 1.000 1.968±0.003 1.000
50.0 –10 10 2.143±0.015 1.000 1.871±0.015 1.000 2.000±0 1.000 1.987±0.001 1.000 1.974±0.003 1.000
LU1, initially wet, nozzle rain simulator
0.0 –10 10 2.463±0.083 0.994 1.831±0.022 0.999 2.000±0 1.000 1.981±0.002 1.000 1.961±0.005 1.000
65.0 –10 10 2.058±0.014 1.000 1.922±0.010 1.000 2.000±0 1.000 1.994±0.001 1.000 1.988±0.001 1.000
130.0 –10 10 2.011±0.001 1.000 1.975±0.004 1.000 2.000±0 1.000 1.998±0.000 1.000 1.997±0.000 1.000
195.0 –10 10 2.010±0.001 1.000 1.978±0.003 1.000 2.000±0 1.000 1.998±0.000 1.000 1.997±0.000 1.000
to slightly concave up on the right. Consequently, the largest variation in1qwas observed in the range of negativeq val-ues. Moreover, for negative values ofq, different rates of
Dqdecrease are clearly observed. R´enyi spectra were quasi linear in 3 out of 13 microrelief data sets, namely MA4 with 10 and 55 mm cumulative rain and LU1 with 195 mm of cu-mulative rain. Again these results indicate different degrees of heterogeneity in the point height measurements. As be-fore stated a sigma shapedDqis taken as an indication that the measure is multifractal, whereas quasi-linear spectra are close to monofractals.
Results for D0, D1, and D2 are listed in Table 2.
Val-ues for the capacity dimension,D0, were always 2.0 for the
two soils, Mabegondo (MA) and Pastoriza (LU), indicating that the support of the measure is the Euclidean plane. The information dimension,D1, ranged from 1.998 to 1.984 and
from 1.998 to 1.981 in the MA and the LU soils, respectively. The correlation dimension,D2, oscillated between 1.996 and
1.968 in the MA soil and between 1.997 and 1.961 in the LU soil. Coefficients of determination forD0,D1, andD2were
equal to 1.000 both, for the Mabegondo and Pastoriza soils. Standard errors given in Table 2 are the standard errors of the slope obtained with linear regression. The errors forD0
were equal to 0.0 in both, Mabegondo (MA) and Pastoriza (LU) soils. In the MA surfaces the±deviation ranged from 0.000 to 0.003 and from 0.001 to 0.005 forD1andD2,
re-spectively. In the LU surface the ±deviation for D1 and
D2oscillated from 0.000 to 0.002 and from 0.000 to 0.005,
respectively.
Statistical moment, q, acts as a scanning tool scrutiniz-ing the denser and rarer regions of the measure. Forq≫1, regions with a high degree of concentration are amplified,
while regions with a small degree of concentration are mag-nified forq≪1. Values of D forq=–10 andq=10, i.e.Dmin
andDmax, respectively also are shown in Table 2.
Coeffi-cients of determination forDminandDmaxwere lower than
those for the three first moments, as quoted above. ForD−10
the highest standard error was 0.099, which corresponded to the MA6, surface with cumulative 55 mm of rain. Likewise forD10the highest standard error was 0.022 in the LU1
ini-tial soil surface.
The value of the information dimension,D1, has been also
considered as a good index of the heterogeneity in spatial dis-tribution of a measure. The closer theD1value to the
capac-ity dimension,D0, the more homogeneous is the distribution
of the measure. In general, the width of the multifractal spec-trum could be a practical parameter for characterizing and comparing soil surface roughness in microplots. However, the width parameter may be assessed in different ways. Fre-quently, either it has been referred to as the deviation of the
D (q>0) from theD0values, as given by the ratioDmin/D0,
or it has been considered as the amplitude of the maximum and minimum dimensions, D(qmin)−D(qmax), and, in this
case, positive or negativeq=10 are commonly retained. No-tice also that uncertainties in estimatingDq values forq<0 lead to errors in the width parameter when estimated both by theDmin/D0ratio or by the amplitude of positive and
neg-ativeqmax=10, i.e. (Dmin−Dmax)as discussed by Tarquis et
al. (2003). Therefore, the degree of multifractality depends also on the uncertainty, i.e. ± errors of these parameters. Standard errors are additive, and from Table 3 it follows that for1(D−10−D10)they range between from 0.004 to 0.115.
the worse the linearity of plotsχ (q, δ)versusδ, and also the higher the uncertainty as measured by the standard errors. Consequently, in retrospective, the uncertainty of the width parameter when calculated by the amplitude of positive and negativeqmax=10, i.e. (D−10−D+10), would be greater than
the1(D0−D2)counterpart had been used. However, when
extreme values are of interest indices defined on the basis of higher order statistical moments,q, may be advantageous.
On the other hand it has been reported (Cheng, 1997, 1999) that the MI index, earlier defined asτ–2τ+τ charac-terizes the main property of the multifractality of a measure. MI usually gives the best index in terms of minimum errors, because of the uncertainty increase as moment of orderq in-creases. Notice also that from Eq. (8) it follows thatτ(0)=–
D0andτ=D2, butτ <>D1. For conservative multifractals,
as in the case of the measure defined in our work, the MI becomes MI=–1(D0−D2).
As indicators of soil surface heterogeneity, and mul-tifractal behavior Table 3 lists three roughness indices:
1(Dmin−Dmax), Dmin/D0 and the MI index. First, both,
1(D−10−D10)andDmin/D0are positive for all the studied
data sets. Second, the MI has negative values in accordance with the above discussion and with the convex property of
τ (q)function atq=1.
The degree of multifractality in the LU1 sequence clearly decreased with increasing cumulative rain, as indicated by the four multifractal indices analysed (Table 3). In the MA4 sequence, with the soil surface initially wet, 1(D0−D2),
1(D−10−D10), andDmin/D0displayed and decreased trend
during the first rainfall events and then further increased with cumulative rain, whereas (D0–2D1+D2)approached zero. In
the MA6 sequence with the soil surface initially dry, param-eters,1(D0−D2),1(D−10−D10), andDmin/D0showed no
a definite trend by increased rainfall whereas MI was<0 for the two last rainfall events.
A larger width of theDqspectra is associated with a higher heterogeneity of the soil microrelief features, whereas a de-creasing trend inDq width could be regarded as a measure of homogenization. Similarly MI values closer to cero are indicative of a relatively low degree of multifractality. Ini-tial soil surfaces are constituted by aggregates with a range of sizes relatively heterogeneous. All the three initial soil surfaces are characterised by quite large values of the pa-rameters1(D−10−D10)andDmin/D0.Likewise, these three initial soil surfaces exhibit MI values that are somewhat dis-tant from cero. During the first rain events the transport capacity at the microscale is limited and the dominant pro-cesses causing soil surface disturbance are crusting and depo-sition. Crusting leads to vanishing of small-sized aggregates, whereas deposition of sediments produced by raindrop im-pact or eventually other mechanisms such as air entrapment, will reduce microrelief differences. Consequently, a more spatially homogeneous soil surface microrelief is observed. The lower degree of multifractality in the LU1 sequence with increased simulated rain matches these observations.
How-Table 3.Cumulative rain, random roughness (RR), and roughness indexes derived from multifractal parameters for three soil surfaces with different initial state conditions subjected to simulated rain. These indices are: 1(Dmin−Dmax), differences between
gener-alized dimensions forq=–10 andq=+10, Dmin/D0, or ratio
be-tweenD−10andD0, and MI or multifractality index calculated as τ−2τ+τ.
rain (mm) RR (mm) 1(Dmin−Dmax) Dmin/D0 MI
MA4, initially wet, dropper rain simulator
0.0 3.39 0.281 1.092 –0.0230
10.0 4.09 0.042 1.009 –0.0043
55.0 3.82 0.065 1.013 –0.0068
85.0 3.70 0.336 1.102 –0.0301
MA6, initially dry, dropper rain simulator
0.0 3.00 0.327 1.114 –0.0219
5.0 3.13 0.277 1.089 –0.0216
12.5 2.73 0.568 1.218 –0.0292
27.5 2.34 0.512 1.182 –0.0315
50.0 2.13 0.272 1.071 –0.0259
LU1, initially wet, nozzle rain simulator
0.0 4.72 0.039 1.232 –0.0386
65.0 4.70 0.012 1.029 –0.0121
130.0 5.11 0.003 1.005 –0.0035
195.0 5.10 0.003 1.005 –0.0032
ever, when erosion starts to overtake the deposition process, some of the previously deposited materials are removed and small micro-rilling may start, causing increasing heterogene-ity at small scales. The trend to first decrease and then in-crease the degree of multifractality with increasing rain ob-served in the MA4 sequence as well as the rather opposite trend in the MA6 sequence may correspond to changes in the relative intensity of erosion and deposition processes by increased cumulative rainfall.
3.4 Vertical roughness decay and multifractal parameter evolution
The importance of taking into account, not only the com-monly used fractal dimension parameter, D, but also a crossover length parameter, l, which gives insight into the vertical scale, when using the fractal approach, for charac-terizing differences in soil surface roughness between mi-croplots, was emphasized by Huang (1998a). Besides, ad-vantages of the joint use of these two parameters to quantify soil microtopography have been illustrated (Eltz and Norton, 1997; Vidal V´azquez et al., 2006, 2007).
Figure 5 shows the evolution of multifractal parameters
1(Dmin−Dmax),Dmin/D0as well as the multifractality
0 .0 0 .1 0 .2 0 .3 0 .4 0 .5 0 .6 0 .7
1 2 3 4 5 6
RR (m m )
(
Dm
in
-D
m
a
x
)
M A4
M A6
LU1
8 5 mm
5 5 mm 1 0 mm
0 mm 0 mm
5 mm 1 2 .5 mm
2 7 .5 mm
5 0 mm
0 mm
6 5 mm
1 3 0 mm 1 9 5 mm
1.0 1.1 1.1 1.2 1.2 1.3
1 2 3 4 5 6
RR (mm)
(
Dm
in
/D0
)
MA4
MA6
LU1
85 mm
55 mm 10 mm
0 mm 0 mm
5 mm 12.5 mm
27.5 mm
50 mm
0 mm
65 mm 130 mm
195 mm
- 0 .0 4 0
- 0 .0 3 0
- 0 .0 2 0
- 0 .0 1 0
0 .0 0 0
1 2 3 4 5 6
RR (m m )
M
.I.
M A4 M A6 L U1
0 mm
5 0 mm 0 mm
2 7 .5 mm 1 2 .5 mm
5 mm 8 5 mm
5 5 mm
1 0 mm 0 mm
6 5 mm
1 3 0 mm
1 9 5 mm
Fig. 5. Width of the generalized dimension spectra as measured by1(Dmin−Dmax),Dmin/D0, and multifractality index, MI, as a
function of random roughness, RR.
RR following successive rainstorms. However, the corre-sponding changes in width of the D spectrum, as assessed by1(Dmin−Dmax)orDmin/D0, as well as multifractality
in-dex MI, allow to discriminate between data sets of a given rain sequence. In general, all of these three indices show a similar behaviour when plotted against RR, even if they are not proportional.
The LU1 sequence was the only where the values of 1(Dmin−Dmax), Dmin/D0 decreased whereas MI
ap-proached to cero as a function of cumulative rain (Table 3). In this case study, however, changes in RR were negligible.
1(Dmin−Dmax)andDmin/D0varied from 0.632 to 0.032 and
from 1.232 to 1.005 respectively, whereas MI changed be-tween –0.0386 and –0.0032 when the initial (0 mm rain) and final (195 mm rain) soil surfaces were compared. These in-dices exhibits great differences between data sets measured at 0, 65 and 130 mm rain, but they were virtually equal at 130 and 195 mm rain. These results imply that, with increas-ing rain, the soil surface becomes more homogeneous as the parameters accounting for width of theDspectrum decrease and as the multifractality index comes close to cero.
The MA4 sequence also goes through minor changes in RR when submitted to successive storms. Parameters de-scribing spatial heterogeneity,1(Dmin−Dmax)andDmin/D0
decrease and the MI varies from –0.0230 to –0.0043 with the first rain event of 10 mm at 30 mmh−1 intensity. The sec-ond event raises cumulative rain to 55 mm, but this results in rather slight changes in the value of the above parameters. However, increasing rainfall from 55 to 85 mm dramatically increases the heterogeneity of the soil surface, as shown by differences in the values of1(Dmin−Dmax), Dmin/D0 and
MI. This may be indicative of dominant erosion processes at the small scale during the last event of this rain sequence.
Finally, in the initially dry MA6 sequence, both RR and multifractal parameters change with increasing rainfall, but these fluctuations are unalike. The initial RR slightly in-creases after 5 mm rain due to consolidation at the soil sur-face and them steadily decreases wit cumulative rain. After-wards values of1(D0−D2),1(Dmin−Dmax)andDmin/D0
exhibit a slight decrease by 5 mm rain and then they enlarge by 12.5 and 27.5 mm rain. Again, values of these parame-ters decrease by 50 mm rainfall. The MI parameter follows a comparable trend. This means that the spatial heterogeneity may be increasing or decreasing whereas the vertical compo-nent of roughness is decreasing. Imbalances, between ero-sion and deposition, dominant processes may be the cause of this type of soil surface evolution.
4 Conclusions
Multifractal formalism was appropriated for analyzing the variability of point heights measurements on a 2×2 mm2grid and could be a practical way of assessing the spatial hetero-geneity of soil surface microrelief. Several multifractal pa-rameters, such as1(Dmin−Dmax),Dmin/D0, and the
multi-fractal index MI defined asτ–2τ may be useful for express-ing the microrelief irregularities of the soil surface. The val-ues of these indices were consistent with experimental obser-vations and reflected different degrees of multifractality of the soil surface microrelief data sets. All of the three indices have been found to be sensitive to assess soil spatial hetero-geneities, but the MI was the best index in term of errors in the calculations.
In general, changes in multifractal parameters obtained from the generalized dimension,Dq for the mass exponent function,τ (q) under simulated rainfall showed no or little correspondence with the evolution of the statistical parame-ter random roughness, RR, which explains the vertical decay of soil microrelief. Multifractals were able to discriminate soil microrelief data sets with similar values of vertical com-ponent of roughness, thus accounting for the spatial configu-ration of microtopography.
Acknowledgements. This work was financially supported by
project research CGL2005-0849-C02-01 from MEC, Spain. The authors extend great appreciation to the editor, Qiuming Cheng of the York University, Toronto, Canada, and they also are grateful to two anonymous referees for providing valuable comments.
Edited by: Q. Cheng
Reviewed by: two anonymous referees
References
Abrahams, A. D. and Parsons, A. J.: Determining the mean depth of overland flow in field studies of flow hydraulics, Water Resour. Res., 26, 501–503, 1990.
Abrahams, A. D. and Parsons, A. J.: Resistance to overland flow on desert pavement and its implications for sediment transport modeling, Water Resour. Res., 27, 1827–1836, 1991.
Allmaras, R. R., Burwell, R. E., Larson, W. E., and Holt, R. F.: Total porosity and random roughness of the inter row zone as influenced by tillage, USDA Conservation Res. Rep., 7, 22 pp., 1966.
Armstrong, A. C.: On the fractal dimensions of some transient soil properties, J. of Soil Sci., 37, 641–652, 1986.
Bird, N., D´ıaz, M. C., Saa, A., and Tarquis, A. M.: Fractal and Multifractal Analysis of Pore-Scale Images of Soil, J. Hydrol., 322, 211–219, 2006.
Bryan, R. B. and Rockwell, D. L.: Water table control on rill ero-sional response, Geomorphology, 23, 151–169, 1998.
Burwell, R. E., Allmaras, R. R., and Amemiya, M.: A field mea-surement of total porosity and surface microrelief of soils, Soil Sci. Soc. Am. Proc., 27, 697–700, 1963.
Caniego, F. J., Espejo, R., Mart´ın, M. A., and San Jos´e, F.: Mul-tifractal scaling of soil spatial variability, Ecological Modelling, 182, 291–303, 2005.
Cheng, Q.: Fractal/Multifractal Modelling and Spatial Analysis. Keynote lecture in Proceedings of the International Mathemat-ical Geology Association Conference, in:, Barcelona, Spain, 22– 27 September edited by: Pawlowsky-Glahn, V., 1, 57–72, 1997. Cheng, Q.: Multifractality and spatial statistics, Computers and
Geosciences 25, 949–961, 1999.
Cogo, N. P., Moldenhauer, W. C., and Foster. G. R.: Effect of crop residue, tillage-induced roughness and runoff velocity on size distribution of eroded soil aggregates, Soil Sci. Soc. Am. J., 47, 1005–1008, 1983.
Darboux, F. and Huang, C. H.: Does soil surface roughness increase or decrease water and particle transfer?, Soil Sci. Soc. Am. J., 69, 748–756, 2005.
Dathe, A., Tarquis, A. M., and Perrier, E.: Multifractal analysis of the pore- and solid-phases in binary two-dimensional images of natural porous structures, Geoderma, 134, 318–326, 2006. Davies, S. and Hall, P.: Fractal analysis of surface roughness by
using spatial data, Journal of the Royal Statistical Society (Series B), Statistical Methodology, 61, 3–37, 1999.
Einstein, H. A., Barbarossa, N., and Eltz, F. L.: River channel roughness, Trans. Am. Soc. Civ. Eng., 117, 1121–113, 1951. Eltz, F. and Norton L. D.: Surface roughness changes as affected by
rainfall erosivity, tillage, and canopy cover, Soil Sci. Soc. Am. J., 61, 1746–1755, 1997.
Everstz, C. J. G. and Mandelbrot, B. B.: Multifractal measures, in: Chaos and Fractals, edited by: Peitgen, H., J¨urgens, H., and Saupe, D., Springer, Berlin, 921–953, 1992.
Falconer, K.: Fractal geometry, Mathematical foundations and ap-plications, John Wiley and Sons, Chichester, 1997.
Folorunso, O. A., Puente, C. E., Rolston, D. E., and Pinz´on, J. E.: Statistical and fractal evaluation of the spatial characteristics of soil surface strength, Soil Sci. Soc. Am. J. 58, 284–294, 1994. Foster, G. R.: Modelling the erosion process, in: Hydrologic
Mod-elling of small Watersheds, edited by: Haan, C. T., Johnson, H. P., and Brakensiek, D. L., American Society of Agricultural En-gineers, St Joseph, MI, 297–382, 1982.
Garc´ıa Moreno, R.: Desarrollo de una metodolog´ıa para la medici´on de la rugosidad superficial del suelo, Ph. D. Thesis, Universidad Polit´ecnica de Madrid, 120 pp., 2006.
Garc´ıa Moreno, R., D´ıaz ´Alvarez, M. C., Tarquis Alfonso, A., Bar-rington, S., and Saa Requejo, A.: Tillage and soil type effects on soil surface roughness at semiarid climatic conditions, Soil and Tillage Research 98, 35–44, 2008.
Gallant, J. C., Moore, I. D., Hutchinson, M. F., and Gessler, P.: Es-timating fractal dimension of profiles: a comparison of methods, Mathematical Geology 26, 455–481, 1994.
G´omez, J. A. and Nearing, M. A.: Runoff and sediment losses from rough and smooth soil surfaces in a laboratory experiment, Catena 59, 253–266, 2005.
Govers, G., Takken, I., and Helming, K.: Soil roughness and over-land flow, Agronomie, 20, 131–146, 2000.
Grau, J., M´endez, V., Tarquis, A. M., Saa, A., and D´ıaz, M. C.: Comparison of gliding box and box-counting methods in soil im-age analysis, Geoderma, 134, 349–359, 2006.
Re-sour. Res., 28, 237–243, 1992.
Helming, K., R¨omkens, M. J. M., and Prasad, S. N.: Surface rough-ness related processes of runoff and soil loss: a flume study, Soil Sci. Soc. Am. J., 62, 243–250, 1998.
Huang, C., and Bradford, J. M.: Depressional storage for Markov-Gaussian surfaces, Water Resour. Res. 26, 2235–2242, 1990. Huang, C. and Bradford, J. M.: Applications of a laser scanner to
quantify soil microtopography, Soil Sci. Soc. Am. J., 56, 14–21, 1992.
Huang, C.: Quantification of soil microtopography and surface roughness, in: Fractals in Soil, edited by: Baveye, P., Parlange, J. Y., and Stewart, B. A., Science, 377 pp., 1998a.
Huang, C.: Sediment regimes under different slope and surface hy-drologic conditions, Soil Sci. Soc. Am. J., 62, 423–430, 1998b. Huang, C. and Laflen, J. M.: Seepage and soil erosion for a clay
loam soil, Soil Sci. Soc. Am. J., 60, 408–416, 1996.
Ib´a˜nez, J. J., Ruiz-Ramos, M., Tarquis, A. M.: Mathematical struc-tures of biological and pedological taxonomies, Geoderma 134, 360–372, 2006.
Kamphorst, E. C., Jetten, V., Guerif, J., Pitkanen, J., Iversen, B. V., Douglas, J. T., and Paz, A.: How to predict maximum water storage in depressions from soil roughness measurements, Soil Sci. Soc. Am. J., 64, 1749–1758, 2000.
Linden D. R. and van Doren, D. M.: Parameters for characterizating tillage induced soil surface roughness, Soil Sci. Soc. Am. J., 50, 1560–1565, 1986.
Mandelbrot, B. B.: The fractal geometry of nature, Freeman, San Francisco, 1983.
Merril, S. D., Huang, C., Zobeck, T. M., and Tanaka, D. L.: Use of the chain set for scale-sensitive and erosion-relevant measure-ments of soil surface roughness, in: Sustaining the global farm, edited by: Stott, D. E., Mothar, R. H., and Steihardt, D. C., 594– 600, 2001.
Mitchell, J. K. and Jones, B. A.: Microrelief surface depression storage: changes during rainfall events and their application to rainfall-runoff models, Water Resources Bulletin, 14, 777–802, 1978.
Moldenhauer, W. C. and Kemper, W. D.: Interdependence of water drop energy and clod size on infiltration and clod stability, Proc. Soil Sci. Soc. Am. 33, 297–301, 1969.
Moore, D. C. and Singer, M. J.: Crust formation effects on soil erosion processes, Soil Sci. Soc. Am. J., 54, 1117–1123, 1990. Moore, D. C. and Larson, C. I.: Estimating microrelief surface
stor-age from point data, Trans. ASAE 20, 1073–1077, 1979.
Onstad, C. A.: Effect of rainfall on tilled soil properties. ASAE paper No. 84-2525. ASAE, St. Joseph, MI., 1984.
Owoputi, L. O. and Stolte, W. J.: The role of seepage in erodibility, Hydrol. Processes, 15, 13–22, 2001.
Pachepsky, Y., Crawford, J. W., and Rawls, W. J.: Fractals in Soil Science, Developments in Soil Science, Elsevier, Amsterdam, 295 pp., 2000.
Podmore, T. H. and Huggins. L. F.: An automated profile meter for surface roughness measurements, Trans. ASAE 24, 663–665, 669, 1981.
R´enyi, A.: On a new axiomatic theory of probability, Acta Mathe-matica Hungarica, VI (3–4), 285–335, 1955.
Renard, K. G., Foster, G. R., Weesies, G. A., McCool, D. K., and Yoder, D. C.: Predicting soil erosion by water: a guide to con-servation planning with the revised universal soil loss equation (RUSLE), USDA-ARS Agric. Handb., vol. 703, US Gov. Print. Office, Washington DC., 1997.
Roisin, C. J.: A multifractal approach for assessing the structural state of tilled soils, Soil Sci. Soc. Am. J., 71, 15–25, 2007. R¨omkens, M. J. M. and Wang, J. Y.: Effect of tillage on surface
roughness, Trans, ASAE, 29, 193–2002, 1986.
R¨omkens, M. J. M., Helming, K., and Prasad, S. N.: Soil erosion under different rainfall intensities, surface roughness and soil wa-ter regimes, Catena, 46, 103–123, 2001.
Tarquis, A., Gim´enez, D., Saa, A., D´ıaz, M. C., and Gasc´o, J. M.: Scaling and multiscaling of soil pore systems determined by im-age analysis, in: Scaling Methods in Soil Physics, edited by: Pachepsky, J., Radcliffe, D. E., and Selim, H. M., CRC Press, 434 pp., 2003.
Vidal V´azquez, E., Paz Gonz´alez, A., and Vivas Miranda, J. G.: Characterizing isotropy and heterogeneity of soil surface mi-crotopography using fractal models, Ecological Modelling, 182, 337–353, 2005.
Vidal V´azquez, E., Miranda, J. G. V., Alves, M. C., and Paz Gonz´alez, A.: Effect of tillage on fractal indices describing soil surface microrelief of a Brazilian Alfisol, Geoderma, 134(3–4), 428–439, 2006.
Vidal V´azquez, E., Miranda, J. G. V., and Paz Gonz´alez, A.: De-scribing soil surface microrelief by crossover length and fractal dimension, Nonlin. Processes Geophys., 14, 223–235, 2007, http://www.nonlin-processes-geophys.net/14/223/2007/. Zobeck, T. M. and Onstad, C. A.: Tillage and rainfall effects on