HESSD
11, 5953–5989, 2014Using14C and3H to
understand groundwater flow and
recharge
A. P. Atkinson et al.
Title Page
Abstract Introduction
Conclusions References
Tables Figures
◭ ◮
◭ ◮
Back Close
Full Screen / Esc
Printer-friendly Version
Interactive Discussion
Discussion
P
a
per
|
Discus
sion
P
a
per
|
Discussion
P
a
per
|
Discussion
P
a
per
|
Hydrol. Earth Syst. Sci. Discuss., 11, 5953–5989, 2014 www.hydrol-earth-syst-sci-discuss.net/11/5953/2014/ doi:10.5194/hessd-11-5953-2014
© Author(s) 2014. CC Attribution 3.0 License.
This discussion paper is/has been under review for the journal Hydrology and Earth System Sciences (HESS). Please refer to the corresponding final paper in HESS if available.
Using
14
C and
3
H to understand
groundwater flow and recharge in an
aquifer window
A. P. Atkinson1,2, I. Cartwright1,2, B. S. Gilfedder3, D. I. Cendón4,5, N. P. Unland1,2, and H. Hofmann6
1
School of Geosciences, Monash University, Clayton, Vic, 3800, Australia
2
National Centre for Groundwater Research and Training, G.P.O. Box 2100, Flinders University, Adelaide, SA 5001, Australia
3
Department of Hydrology, University of Bayreuth, Bayreuth, Germany
4
Australian Nuclear Science and Technology Organisation, Menai, NSW 2232, Australia
5
School of Biological Earth and Environmental Sciences, The University of New South Wales, Sydney, NSW 2052, Australia
6
School of Earth Sciences, The University of Queensland, Brisbane, QLD 4072, Australia
Received: 24 April 2014 – Accepted: 14 May 2014 – Published: 6 June 2014
Correspondence to: A. P. Atkinson ([email protected])
HESSD
11, 5953–5989, 2014Using14C and3H to
understand groundwater flow and
recharge
A. P. Atkinson et al.
Title Page
Abstract Introduction
Conclusions References
Tables Figures
◭ ◮
◭ ◮
Back Close
Full Screen / Esc
Printer-friendly Version
Interactive Discussion
Discussion
P
a
per
|
Discus
sion
P
a
per
|
Discussion
P
a
per
|
Discussion
P
a
per
|
Abstract
Knowledge of groundwater residence times and recharge locations are vital to the sustainable management of groundwater resources. Here we investigate groundwater residence times and patterns of recharge in the Gellibrand Valley, southeast Australia, where outcropping aquifer sediments of the Eastern View Formation form an “aquifer 5
window” that may receive diffuse recharge and recharge from the Gellibrand River. To determine recharge patterns and groundwater flowpaths, environmental isotopes (3H, 14
C, δ13C, δ18O, δ2H) are used in conjunction with groundwater geochemistry and continuous monitoring of groundwater elevation and electrical conductivity. Despite the water table fluctuating by 0.9–3.7 m annually producing estimated recharge rates of 10
90 and 372 mm yr−1, residence times of shallow (11– 29 m) groundwater determined by 14C ages are between 100 and 10 000 years. 3H activities are negligible in most of the groundwater and groundwater electrical conductivity in individual areas remains constant over the period of study. Although diffuse local recharge is evident, the depth to which it penetrates is limited to the upper 10 m of the aquifer. Rather, groundwater 15
in the Gellibrand Valley predominantly originates from the regional recharge zone, the Barongarook High, and acts as a regional discharge zone where upward head gradients are maintained annually, limiting local recharge. Additionally, the Gellibrand River does not recharge the surrounding groundwater and has limited bank storage. 14
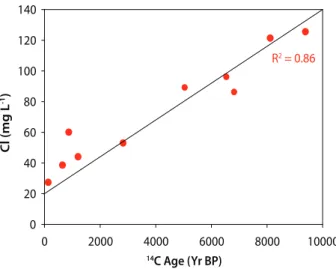
C ages and Cl concentrations are well correlated and Cl concentrations may be used 20
to provide a first-order estimate of groundwater residence times. Progressively lower chloride concentrations from 10 000 years BP to the present day are interpreted to indicate an increase in recharge rates on the Barongarook High.
1 Introduction
Groundwater residence time can be defined as the period of time elapsed since the 25
HESSD
11, 5953–5989, 2014Using14C and3H to
understand groundwater flow and
recharge
A. P. Atkinson et al.
Title Page
Abstract Introduction
Conclusions References
Tables Figures
◭ ◮
◭ ◮
Back Close
Full Screen / Esc
Printer-friendly Version
Interactive Discussion
Discussion
P
a
per
|
Discus
sion
P
a
per
|
Discussion
P
a
per
|
Discussion
P
a
per
|
accurately, the mean time that a mixture of waters of different ages have resided in an aquifer (Bethke and Johnson, 2008). The residence time of water within an aquifer is a key parameter in describing catchment storage and may be used to estimate historical recharge rates (Le Gal La Salle et al., 2001; Cook et al., 2002; Cartwright and Morgenstern, 2012; Zhai et al., 2013), elucidate groundwater flowpaths (Gardner 5
et al., 2011; Smerdon et al., 2012), calibrate hydraulic models (Mazor and Nativ, 1992; Reilly et al., 1994; Post et al., 2013) and characterize the rate of contaminant spreading (Böhlke and Denver, 1995; Tesoriero et al., 2005). From a water resource perspective, information on groundwater residence times is required for sustainable aquifer management by identifying the risk posed to groundwater reserves against 10
over-exploitation (Foster and Chilton, 2003), climate change (Manning et al., 2012) and contamination (Böhlke, 2002).
Unconfined aquifers may be recharged over broad regions leading to young groundwater at shallow depths (Cendón et al., 2014). On the other hand, the residence time of groundwater in confined aquifers generally increases away from discrete 15
recharge areas. The geology of catchments is often complex and heterogeneous and, where aquifer material is exposed in more than one location, this offers a potential “window” for groundwater recharge (Meredith et al., 2012). It is important to document groundwater flow in such aquifer windows. If they act as recharge areas, changes in land-use such as agricultural development may introduce contaminants to the 20
deeper regional groundwater systems. By contrast, if they are local discharge areas, use of regional groundwater may impact rivers, lake or wetlands that are receiving groundwater.
High river flows may also recharge shallow groundwater if the hydraulic gradient between the river and the groundwater is reversed during high flows (Doble et al., 25
HESSD
11, 5953–5989, 2014Using14C and3H to
understand groundwater flow and
recharge
A. P. Atkinson et al.
Title Page
Abstract Introduction
Conclusions References
Tables Figures
◭ ◮
◭ ◮
Back Close
Full Screen / Esc
Printer-friendly Version
Interactive Discussion
Discussion
P
a
per
|
Discus
sion
P
a
per
|
Discussion
P
a
per
|
Discussion
P
a
per
|
flow, water from rivers is likely stored temporally in the banks (McCallum et al., 2010; Unland et al., 2014); however, the depth and lateral extent to which bank exchange water infiltrates the aquifer is not well documented. Understanding the capacity of rivers to recharge regional groundwater is important in understanding exchange within the hydrological cycle (Stichler et al., 1986; Chen and Chen, 2003). Furthermore, 5
where surface-waters transport contaminants and have the potential to recharge the surrounding aquifer, this may lead to contamination and degradation of groundwater quality (Newsom and Wilson, 1988; Stuyfzand, 1989). Lastly, knowledge of residences times of groundwater in close proximity to the river can provide important information on groundwater-river interactions (Gardner et al., 2011). Local groundwater flowpaths 10
in connection with rivers are often underlain by deeper regional flowpaths (Tóth, 1963) however the role these flowpaths play in contributing to river baseflow remains unclear (Sklash and Farvolden, 1979; McDonnell, 2010; Frisbee and Wilson, 2013; Goderniaux et al., 2013). This may be elucidated from understanding residence times of near-river groundwater (Smerdon et al., 2012).
15
1.1 Radiogenic tracers
Radioactive environmental isotopes, in particular14C and3H have proven useful tools for determining groundwater residence times (Vogel, 1974; Wigley, 1975). Produced in the atmosphere via the interaction of N2 with cosmic rays,
14
C has a half life of 5730 years and can be used to trace groundwater with residence times up to 30 20
ka. The use of 14C in dating groundwater was first discussed by Muennich (1957), and has subsequently been widely used due to the ubiquitous presence of dissolved inorganic carbon (DIC) in groundwater (Cartwright et al., 2012; Samborska et al., 2012; Stewart, 2012). The calculation of 14C ages may be complicated if groundwater DIC is derived from a mixture of sources (Clark and Fritz, 1997). Where a large proportion 25
HESSD
11, 5953–5989, 2014Using14C and3H to
understand groundwater flow and
recharge
A. P. Atkinson et al.
Title Page
Abstract Introduction
Conclusions References
Tables Figures
◭ ◮
◭ ◮
Back Close
Full Screen / Esc
Printer-friendly Version
Interactive Discussion
Discussion
P
a
per
|
Discus
sion
P
a
per
|
Discussion
P
a
per
|
Discussion
P
a
per
|
during methanogenesis may provide additional sources of14C-free DIC. Groundwaters recharged post 1950 may have anomalously high14C activities (a14C) due to the14C produced during atmospheric nuclear tests. Objective14C dating requires recognition and quantification of these processes. A number of models based on both major ion and stable C isotope geochemistry have been proposed to correct apparent14C ages 5
(Han and Plummer, 2013).
With a significantly shorter half-life (12.33 years), 3H can be used to date groundwater with residence times of up to 100 years (Vogel et al., 1974). With the decay of the 1960s 3H bomb-pulse peak in the Southern Hemisphere to near background levels unique ages may now be determined from single3H measurements 10
(Morgenstern et al., 2010). As 3H is part of the water molecule, there is negligible change to3H activities other than decay, providing an excellent tracer for the movement of water through hydrological systems (Michel, 2004). Used in conjunction with 14C data,3H may also be used to study mixing in shallow aquifers (Le Gal La Salle, 2001; Cartwright and Morgenstern, 2012).
15
2 Study site
The Otway Basin is located in southwest Victoria, covering an area of 150 000 km2. The basin was formed during the Cretaceous rifting of Australia and Antarctica (Briguglio et al., 2013) and is infilled with Upper Cretaceous and Cenozoic siliciclastic and calcareous sediments that form several aquifers and aquitards. The basin is divided into 20
a number of sub-basins with regional groundwater flow paths originating at topographic highs. The Gellibrand catchment is one of these sub-basins. This study focuses on a 250 km2 upland area of the catchment, the Gellibrand River Valley, which lies at the foothills of the Otway Ranges, directly south of the Barongarook High, a regional recharge zone, from which groundwater flows southwest along the Gellibrand River 25
HESSD
11, 5953–5989, 2014Using14C and3H to
understand groundwater flow and
recharge
A. P. Atkinson et al.
Title Page
Abstract Introduction
Conclusions References
Tables Figures
◭ ◮
◭ ◮
Back Close
Full Screen / Esc
Printer-friendly Version
Interactive Discussion
Discussion
P
a
per
|
Discus
sion
P
a
per
|
Discussion
P
a
per
|
Discussion
P
a
per
|
Cretaceous Otway Group sediments of the Eumeralla Formation form the basement of the catchment and crop out in areas of higher relief. The Eumeralla Formation consists of thickly bedded siltstone, mudstone and volcanolithic sandstone. It has a low primary porosity and hydraulic conductivity and acts as a poor aquifer (Lakey and Leonard, 1982). Cenozoic sediments of the Wangerrip group overlie the bedrock 5
and form major aquifers in the region to which groundwater flow is constrained (Van den Berg, 2009). The primary aquifer in the study area is the Eastern View Formation or equivalent Dilwyn Formation (Van den Berg, 2009; Petrides and Cartwright, 2006; Atkinson et al., 2013), composed of gravel, fine to coarse grained sand and major clays. The Eastern View Formation comprises predominantly quartz, feldspars and 10
carbonates (<2 %) and has hydraulic conductivities of 10−2
to 102m d−1
(Hortle et al., 2011). The Eastern View Formation is underlain by another productive aquifer, the Pebble Point Formation, however this is much thinner and is separated from the above layers by the Pember Mudstone. To the north the Eastern View Formation is confined by the Gellibrand Marl, a regional aquitard, which comprises 100–200 m of clay, and fine-15
grained silts of the Demons Bluffformation. Basaltic intrusions of the Quaternary Newer Volcanics are also present. The floodplain is covered with recent alluvial deposits of sand and clay.
The Gellibrand Valley contains a mixture of cool temperate rainforest on the valley sides and cleared agricultural pasture through which the Gellibrand River flows. Rainfall 20
across the catchment averages ∼1000 mm yr−1, with the majority of rainfall falling in the Australian winter between June and September (Bureau of Meteorology, 2013). The Gellibrand River is gaining and groundwater contributes between 10 and 50 % to total river flow dependent on flow conditions (Atkinson et al., 2013). River flows are between 5×10⁴m3day−1 to 2×10⁶m3day−1 (Fig. 2c), with low flows during 25
HESSD
11, 5953–5989, 2014Using14C and3H to
understand groundwater flow and
recharge
A. P. Atkinson et al.
Title Page
Abstract Introduction
Conclusions References
Tables Figures
◭ ◮
◭ ◮
Back Close
Full Screen / Esc
Printer-friendly Version
Interactive Discussion
Discussion
P
a
per
|
Discus
sion
P
a
per
|
Discussion
P
a
per
|
Discussion
P
a
per
|
there is also potential for localised recharge within the Gellibrand River Valley, as the Eastern View Formation crops out there.
Though groundwater residence times in the Otway Basin have been explored in the Gambier Embayment (Love et al., 1994) and nearby Barwon River catchment (Petrides and Cartwright, 2006), little is known of the residence times of groundwater in the 5
Gellibrand River catchment. Here we evaluate groundwater residence times in the upper Gellibrand River Catchment, where the Eastern View Formation is exposed and regular episodic river floods occur, to identify whether groundwater recharge occurs in this part of the groundwater system. This is important in understanding the potential impacts of landuse change and pollution in the catchment as well as understanding 10
the dynamics of recharge in catchments where aquifer material is exposed in more than one location. Radioactive tracers14C and 3H are used to determine residence times and define groundwater flow paths whilst major ion chemistry is employed to determine dominant geochemical processes. Water table fluctuations and groundwater electrical conductivities are also continuously monitored. These easily measurable, 15
robust parameters can be used to observe changes in storage and infer sources of aquifer recharge (Vogt et al., 2010) and allow for comparison with radioisotopes in understanding the dynamics of groundwater systems.
3 Methods
A number of groundwater monitoring bores which form part of the Victorian State 20
Observation Bore networks are present in the Gellibrand Valley (Victorian Water Resources Data Warehouse, 2013). These are screened in the Eastern View Formation, with depths of between 0 and 42 m. Bores located within 25 m from the Gellibrand River generally have screen depths between 11 and 15 m, whilst bores located on the flood plain have depths between 21 and 42 m. Groundwater from 25
HESSD
11, 5953–5989, 2014Using14C and3H to
understand groundwater flow and
recharge
A. P. Atkinson et al.
Title Page
Abstract Introduction
Conclusions References
Tables Figures
◭ ◮
◭ ◮
Back Close
Full Screen / Esc
Printer-friendly Version
Interactive Discussion
Discussion
P
a
per
|
Discus
sion
P
a
per
|
Discussion
P
a
per
|
Discussion
P
a
per
|
taken from bores situated on the flood plain between 1 and 2 km from the river. Groundwater was sampled using an impeller pump set in the screen with 2 to 3 bore volumes purged before sampling. Electrical conductivity (EC) and pH of groundwater were measured in the field using a calibrated TPS WP-81 conductivity/pH meter and probes. To assess transient changes in groundwater levels and EC, Aqua Troll 200 5
(in situ) data loggers were deployed in June 2011. A significant drop in EC in near-river groundwater is shown in some bores following flooding in June 2012 when bores were overtopped. However immediately upon pumping in October 2012 (B108934, B108940) and April 2013 (B108916), the EC of the groundwater returned to pre-flood EC values. We interpret this as floodwater that infiltrated down the bore which was not 10
displaced by groundwater prior to pumping, and these data have been omitted. Rainfall samples were also collected in the catchment throughout the study period for chemical analysis.
Cations were analysed on a Thermo Finnigan X Series II Quadrupole ICP-MS on samples that had been filtered through 0.45 µm cellulose nitrate filters and acidified to 15
pH<2. Anions were measured on filtered unacidified samples using a Metrohm ion chromatograph. The precision of major ion concentrations based on replicate analyses is±2 %. Charge balances are within±5 %. Stable isotope ratios were measured using Finnigan MAT 252 and ThermoFinnigan DeltaPlus Advantage mass spectrometers. δ18O values were measured via equilibration with He-CO2 at 32◦C for 24–48 h in
20
a Finnigan MAT Gas Bench whilst δ2H values were measured by the reaction of water samples with Cr at 850◦C using a Finnigan MAT H/Device. Both δ18O andδ2H were measured against an internal standard that has been calibrated using the IAEA, SMOW, GISP and SLAP standards. Data was normalised following methods outlined by Coplen (1988) and are expressed relative to V-SMOW whereδ18O andδ2H values 25
of SLAP are−55.5 and−428 ‰ respectively. Precision is±1 ‰ forδ2H and±0.2 ‰ for δ18O.
14
HESSD
11, 5953–5989, 2014Using14C and3H to
understand groundwater flow and
recharge
A. P. Atkinson et al.
Title Page
Abstract Introduction
Conclusions References
Tables Figures
◭ ◮
◭ ◮
Back Close
Full Screen / Esc
Printer-friendly Version
Interactive Discussion
Discussion
P
a
per
|
Discus
sion
P
a
per
|
Discussion
P
a
per
|
Discussion
P
a
per
|
Laboratory, Institute of Geological and Nuclear Sciences (GNS), (New Zealand). For 14
C analysis performed at ANSTO, CO2was extracted from water samples in a vacuum line using orthophosphoric acid and converted to graphite through reduction with excess H2 gas in the presence of an iron catalyst at 600◦C.14C concentrations were measured using a 10 kV tandem accelerator mass spectrometer.δ13C values for these 5
samples are derived from the graphite fraction used for radiocarbon via EA-IRMS. For14C samples measured at GNS, CO2was extracted from groundwater samples through addition of orthophosphoric acid. CO2 was made into a graphite target and analysed by AMS. An aliquot of the extracted CO2 was used for δ
13
C analysis. 14
C activities are expressed as pMC (percent modern carbon) where pMC = 100 % 10
corresponds to 95 % of the14C concentration of NBS oxalic acid standard (Stuiver and Polach, 1977), with a precision of 14C/12C ratios of ±0.5 (Fink et al., 2004). At both ANSTO and GNS, samples for3H were distilled and electrolytically enriched prior to being analysed by liquid scintillation counting as described by Neklapilova et al. (2008a, b) and Morgenstern and Taylor (2009).3H activities are expressed in Tritium Units (TU) 15
with a relative uncertainty of±5 % and a quantification limit of 0.13–0.14 TU at ANSTO and 0.02 TU and a relative uncertainty of 2 % at GNS.
4 Results
4.1 Groundwater elevations
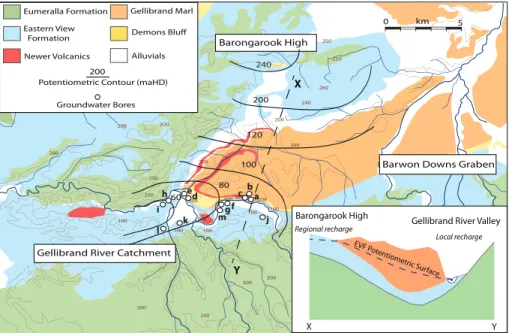
Groundwater elevations decrease from 230 m relative to the Australian Height Datum 20
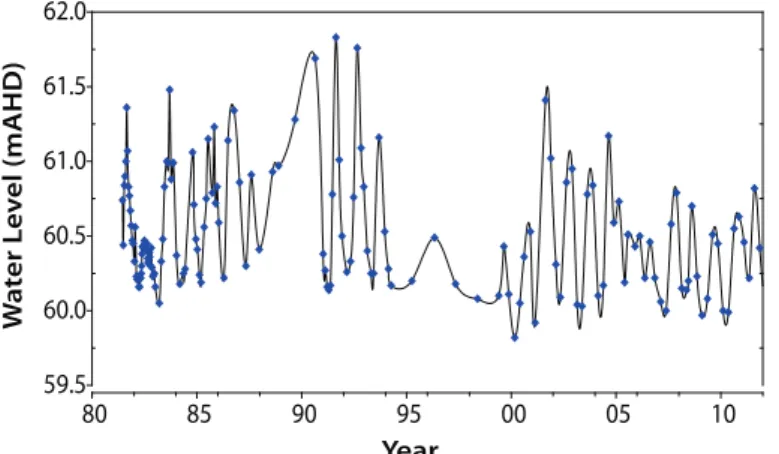
(AHD) on the Barongarook High to<60 mAHD within the Gellibrand Valley (Fig. 1), with groundwater flowing from the Barongarook High towards the Gellibrand Valley and then westward. Groundwater elevations from all depths and positions within the Gellibrand Valley are in phase and fluctuate between 1 and 3 m annually (Fig. 2a). Rising water tables follow winter rainfall between June and August (Fig. 2c) and head gradients 25
HESSD
11, 5953–5989, 2014Using14C and3H to
understand groundwater flow and
recharge
A. P. Atkinson et al.
Title Page
Abstract Introduction
Conclusions References
Tables Figures
◭ ◮
◭ ◮
Back Close
Full Screen / Esc
Printer-friendly Version
Interactive Discussion
Discussion
P
a
per
|
Discus
sion
P
a
per
|
Discussion
P
a
per
|
Discussion
P
a
per
|
that result in flooding during winter months (June–August) and low flows in summer (December–March) (Fig. 2c).
4.2 Groundwater geochemistry
The chemistry of groundwater in the Gellibrand Valley is summarised in Table 1. Groundwater has electrical conductivities between 140 and 600 µS cm−1 and pH
5
ranging from 4.8 to 6.0. Groundwater from close proximity to the river generally has higher EC values (144–545 µS cm−1) than groundwater further back on the floodplain (149–220 µS cm−1). The major ion chemistry of groundwater is similar across the
catchment, and the groundwater is Na-Cl type. Cl constitutes between 68 and 92 % of total anions on a molar basis, with HCO3 accounting for 0–25 %. Increases in Cl 10
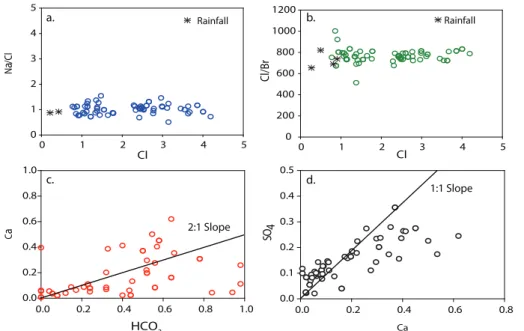
concentrations are associated with a decrease in HCO3. Na comprises between 60 and 85 % of total cations with Ca constituting 1–10 %, Mg constituting 0–10 % and K constituting 0–10 %. Increased Na concentrations are associated with decreases in both Ca and Mg concentrations. Molar Cl/Br ratios are between 400 and 600 and do not increase with increasing Cl (Fig. 3b), molar Na/Cl ratios are 0.7–1.3 and also 15
remain stable with increasing Cl concentrations (Fig. 3a). Both Cl/Br and Na/Cl ratios of groundwater samples are similar to those measured in rainfall in southeast Australia (Blackburn and Mcleod, 1983). There is a weak correlation between Ca and HCO3 (Fig. 3c) and between Ca and O4(Fig. 3d).
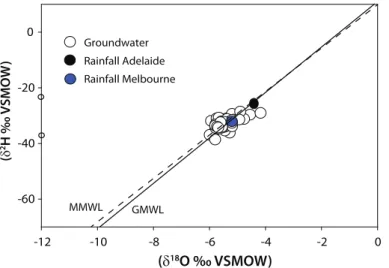
4.3 Stable Isotopes (δ2H,δ18O,δ13C)
20
δ18O and δ2H values of groundwater define a narrow field (δ18O=−4 to −6 ‰ and δ2H=−30 to −40 ‰) that is close to both the global and local meteoric water lines (Fig. 4). The Gellibrand Valley is located between Melbourne and Adelaide, with groundwater generally plotting between the average isotopic compositions of meteoric waters located in these areas.δ13C values of DIC from groundwater range from−19.8 25
HESSD
11, 5953–5989, 2014Using14C and3H to
understand groundwater flow and
recharge
A. P. Atkinson et al.
Title Page
Abstract Introduction
Conclusions References
Tables Figures
◭ ◮
◭ ◮
Back Close
Full Screen / Esc
Printer-friendly Version
Interactive Discussion
Discussion
P
a
per
|
Discus
sion
P
a
per
|
Discussion
P
a
per
|
Discussion
P
a
per
|
4.4 13C,a14C and3H concentrations
The a14C of groundwater ranges from 29 to 101.5 pM C. 3H activities are below detection for the majority of groundwater samples (Table 1), with the exception of bores 80 732, 80 735 and 110 737 which have activities of 1.02, 1.47 and 1.24 TU, respectively. Groundwater from these bores has a14C>90 pM C. The distribution of 5
a14C and 3H values across the catchment is heterogeneous with no relationship to depth or along lateral groundwater flowpaths. A strong inverse correlation (R2=
0.87) is observed with Cl values. High a14C groundwater is associated with low Cl concentrations, with the decrease in a14C through radioactive decay matched by an enrichment of chloride ions. A similar correlation is also observed for Na (R2=0.855), 10
K (R2=0.82), Ca (R2=0.6) and Mg (R2=0.54).
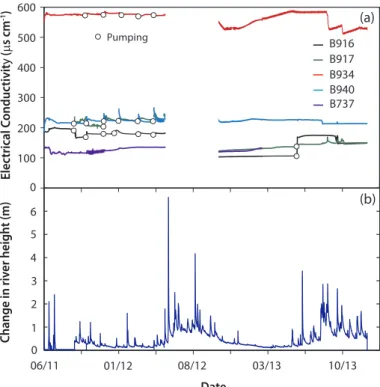
4.5 Continuous electrical conductivity
Continuous groundwater EC records for a number of near-river bores (excluding B110737, situated on the flood-plain) are shown in conjunction with changes in river height for the study period (Fig. 6). Groundwater EC in all bores for the majority of 15
the dataset show little or no response to changes in river height. Minor changes in EC correlate to sampling events in which groundwater bores were pumped.
5 Discussion
5.1 Groundwater chemistry
Understanding geochemical processes in groundwater is required for correction of14C 20
HESSD
11, 5953–5989, 2014Using14C and3H to
understand groundwater flow and
recharge
A. P. Atkinson et al.
Title Page
Abstract Introduction
Conclusions References
Tables Figures
◭ ◮
◭ ◮
Back Close
Full Screen / Esc
Printer-friendly Version
Interactive Discussion
Discussion
P
a
per
|
Discus
sion
P
a
per
|
Discussion
P
a
per
|
Discussion
P
a
per
|
and do not increase with increased TDS implies that evapotranspiration rather than halite dissolution is the major process controlling groundwater salinity (Herczeg et al., 2001; Cartwright et al., 2006). This conclusion is also consistent with an absence of halite in the aquifer lithologies. Theδ18O andδ2H values of groundwater do not define evaporation trends, implying that transpiration in the soil zone or upper parts of the 5
aquifer is likely to be more dominant over evaporation. Na/Cl ratios in groundwater are also similar to those in local rainfall (∼1.00) implying that silicate weathering is limited (Edmunds et al., 2002), whilst the increase in Na concentrations at the expense of Ca may indicate ion exchange reactions on the surface of clay minerals. That Ca and mHCO3 are poorly correlated suggests that only negligible dissolution 10
of calcite has occurred. A handful of groundwater samples have a 1 : 1 Ca : SO4 ratio indicating some minor gypsum dissolution may take place. Together, the major ion geochemistry suggests that water-rock interaction is limited with minimal silicate weathering, negligible dissolution of halite and carbonate minerals and some minor dissolution of gypsum. As is the case elsewhere in southeast Australia, including within 15
the Otway basin, the primary geochemical process is evapotranspiration promoted by the moderate rainfall and water-efficient native vegetation, and the groundwater salinity is largely controlled by the degree of evapotranspiration during recharge (Herczeg et al., 2001; Bennetts et al., 2006; Petrides and Cartwright, 2006).
5.2 Water table fluctuations
20
Annual cycles of groundwater elevations are present in all groundwater bores, which were screened 11–40 m below the ground surface. Fluctuations in groundwater levels across the Gellibrand River Valley are likely to reflect changes to the water table in response to rechargeThe magnitude of annual water table fluctuations recorded in data loggers is similar to those over the previous 30 years (Fig. 6). 25
HESSD
11, 5953–5989, 2014Using14C and3H to
understand groundwater flow and
recharge
A. P. Atkinson et al.
Title Page
Abstract Introduction
Conclusions References
Tables Figures
◭ ◮
◭ ◮
Back Close
Full Screen / Esc
Printer-friendly Version
Interactive Discussion
Discussion
P
a
per
|
Discus
sion
P
a
per
|
Discussion
P
a
per
|
Discussion
P
a
per
|
method Eq. (1):
R=Sy·∆h/∆t (1)
(Scanlon et al., 2002), where Sy is specific yield, ∆h is the change in water table height between the hydrograph recession and hydrograph peak and ∆t is time. The water table rise is estimated as the difference between peak groundwater levels and 5
the extrapolated antecedent recession. The estimate of recharge from this method is sensitive to the estimate of the specific yield.Sy is assumed to be 0.1 which is close to the measured effective porosity of the Eastern View Formation (Love et al., 1993), and takes into account the presence of finer sized sediments such as silt and clay in the aquifer. Annual water table fluctuations are between 0.9 and 3.7 m across all 10
bores, which for Sy values of 0.1, imply that R=130 to 372 mm yr− 1
in 2012 (mean of 200 mm yr−1) and 90–300 mm yr−1 in 2013 (mean of 164 mm yr−1). This equates to between 11 and 32 % of rainfall in 2012 and 12 and 28 % of rainfall in 2013. The bores are screened 11.2–42 m below the ground surface and thus these recharge estimates will be minima due to the attenuation of pressure variations with depth 15
(Scanlon et al., 2002). Recharge estimates are also susceptible to the value of specific yield, particularly where the aquifer is composed of finer sized sediments such as silt and clay. Regardless, estimates using bore hydrographs indicate that significant groundwater recharge to the unconfined Eastern View aquifer in the valley occurs via diffuse recharge.
20
5.3 14C ages
The groundwater in the Eastern View Formation is not anoxic (Victorian Water Resources Data Warehouse, 2013), nor are there coal seams hence methanogenesis is unlikely to be a source of DIC. Likewise there are no obvious sources of geogenic CO2 in this area. Based on the major ion geochemistry, only minor calcite dissolution 25
HESSD
11, 5953–5989, 2014Using14C and3H to
understand groundwater flow and
recharge
A. P. Atkinson et al.
Title Page
Abstract Introduction
Conclusions References
Tables Figures
◭ ◮
◭ ◮
Back Close
Full Screen / Esc
Printer-friendly Version
Interactive Discussion
Discussion
P
a
per
|
Discus
sion
P
a
per
|
Discussion
P
a
per
|
Discussion
P
a
per
|
are siliceous and contain only minor carbonate minerals. While only minor carbonate dissolution is likely, determination of groundwater residence times requires this to be taken into account. If it is assumed that closed system dissolution of calcite in the aquifers is the major process, the fraction of C derived from the soil zone (q) may be derived from the δ13C values of DIC (δ13CDIC), carbonate (δ13Ccc) and recharging 5
water (δ13Cr) via Eq. (2):
q=δ
13
CDIC−δ13Ccc δ13C
r−δ13Ccc
(2)
(Clark and Fritz, 1997). The calcite is assumed to have aδ13C of ∼0 ‰ (Love et al., 1994; Petrides and Cartwright, 2006) as is appropriate for marine sediments. δ13Cr is calculated from theδ13C of the soil carbon in the recharge zone. Pre-land clearing 10
vegetation in southeast Australia was dominated by eucalypts that haveδ13C values of −30 to −27 ‰ (Quade et al., 1995). Assuming a ∼4 ‰ 13C fractionation during outgassing (Cerling et al., 1991), δ13C values of soil CO2 would be −26 to −23 ‰ (average of −24.5 ‰). At 20◦C and pH 6.5, δ13Cr calculated from the fractionation data of Vogel et al. (1970) and Mook et al. (1974) is∼ −20 ‰. Although the calculated 15
δ13Crvalues require the pH and temperature of recharge and theδ 13
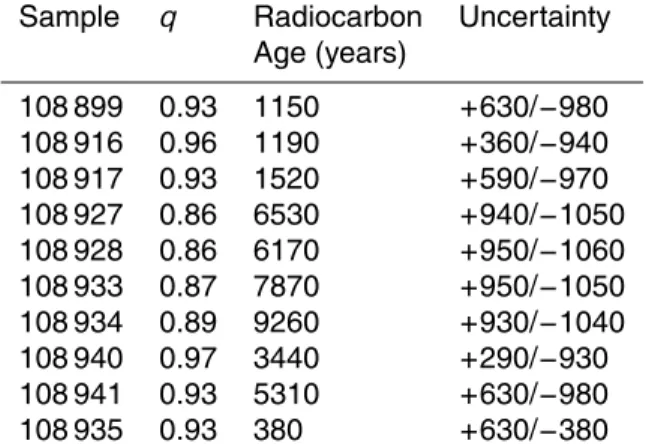
C of the soil zone CO2to be estimated, they are similar to those from other studies in southeast Australia and consistent with the predictedδ13C values of DIC in equilibrium with calcite in the regolith (Quade et al., 1995; Cartwright, 2010). Calculatedq values are between 0.85 and 0.97 (Table 2), implying that only 10–15 % of DIC in groundwater from the Eastern 20
View formation is derived from calcite in the aquifer, this is similar to the expected contribution of calcite dissolution in siliceous aquifers (Vogel et al., 1970) and similar to other estimates from the Otway Basin (Love et al., 1994; Petrides and Cartwright, 2006).
Using the q values from Table 2, 14C ages (t) corrected for closed-system calcite 25
HESSD
11, 5953–5989, 2014Using14C and3H to
understand groundwater flow and
recharge
A. P. Atkinson et al.
Title Page
Abstract Introduction
Conclusions References
Tables Figures
◭ ◮
◭ ◮
Back Close
Full Screen / Esc
Printer-friendly Version
Interactive Discussion
Discussion
P
a
per
|
Discus
sion
P
a
per
|
Discussion
P
a
per
|
Discussion
P
a
per
|
DIC, andao 14
C is the activity during recharge (assumed to be 100 pM C).
t=−8376 ln a 14
C q·ao14C
!
(3)
Radiocarbon ages for groundwater in the Eastern View Formation range from 380 to 9260 years (Table 2) with the exception of bores B110737, B80732, B80735 which have a14C>100 pM C and represent groundwater that has a large component of 5
water recharged during or after the atmospheric nuclear tests in the 1950s to 1960s. The majority of 14C ages however, suggest that groundwater in the valley has long residence times (Fig. 7).
5.4 3H activities and recharge rates
With a shorter half-life, 3H activities can infer the presence of modern groundwater. 10
The water table fluctuations imply that the Gellibrand Valley receives considerable recharge year (90–370 mm yr−1). Although head gradients at nested sites are upwards implying that the valley is a groundwater discharge zone (Fig. 2b), these may be reversed during periods of high rainfall. If local recharge is significant in recharging the groundwater system across the valley, it would be expected that the groundwater would 15
have relatively high3H activities. Recently-recharged groundwater in other Victorian catchments has3H activities up to 3.6 TU (Cartwright and Morgenstern, 2012).
3
H activities in most of the groundwater from the Gellibrand Valley are negligible. Much of this groundwater is from within 5–10 m of the water table, suggesting that any recharge penetrates only to a limited depth, and does not mix with the bulk of the water 20
HESSD
11, 5953–5989, 2014Using14C and3H to
understand groundwater flow and
recharge
A. P. Atkinson et al.
Title Page
Abstract Introduction
Conclusions References
Tables Figures
◭ ◮
◭ ◮
Back Close
Full Screen / Esc
Printer-friendly Version
Interactive Discussion
Discussion
P
a
per
|
Discus
sion
P
a
per
|
Discussion
P
a
per
|
Discussion
P
a
per
|
The Gellibrand River has the potential to recharge regional groundwater during high river stages and episodic floods. Aquifer recharge from surface water can be assessed by combining data from groundwater EC values and3H activities. The EC of river water varies between 120 and 200 µS cm−1 and is lower than that of groundwater in the catchment throughout the year.3H activities of river water are between 1.24 and 2.0 TU 5
during baseflow conditions (Atkinson et al., 2013), and may be higher during high flow events as local modern rainfall, which is likely to comprise a significant component of river flow at thoese times, has activities of 2.4–3.2 TU (Tadros et al., 2014). Significant amounts of aquifer recharge through overbank events or bank exchange should result in groundwater with low EC values, and high3H activities near the river.
10
Except for in June 2012 when the bores were overtopped, groundwater EC was constant throughout the study period and there is no inverse relationship to river height (Fig. 6). This indicates there is little exchange of river water to the depth of the aquifer sampled by the bores. Additionally the activities of3H in near-river bores are negligible, again suggesting that recharge from the river does not penetrate more than a few 15
metres into the adjacent aquifer. Thus, flow through the river bank or river flooding does not appear to be a significant mechanism of recharge in the Gellibrand Valley.
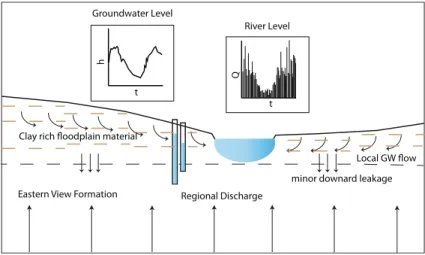
5.5 Groundwater flowpaths and conceptual model
Radiocarbon ages are up to 10 ka implying that the groundwater in the Gellibrand Valley has a long residence time; in turn this implies that the area is a regional discharge zone. 20
Most of the groundwater originates on the Barongarook High, and this region potentially provides a substantial proportion of baseflow to the Gellibrand River. The large range of 14
C ages in the valley is a likely result of heterogeneous geology, where the presence of low hydraulic conductivity sediments such as silt and clays in the Eastern View formation lead to variable velocities along groundwater flowpaths. Groundwater travel 25
HESSD
11, 5953–5989, 2014Using14C and3H to
understand groundwater flow and
recharge
A. P. Atkinson et al.
Title Page
Abstract Introduction
Conclusions References
Tables Figures
◭ ◮
◭ ◮
Back Close
Full Screen / Esc
Printer-friendly Version
Interactive Discussion
Discussion
P
a
per
|
Discus
sion
P
a
per
|
Discussion
P
a
per
|
Discussion
P
a
per
|
10 000 years, which are similar to those implied by the14C ages. This supports the idea that groundwater in the valley is predominantly regional groundwater derived by recharge on the Barongarook High. The high 3H activities in groundwater bores situated away from the river imply local recharge in that area to depths of 21–42 m. However for the most-part, shallow groundwater in the Gellibrand valley, including in the 5
near-river environment is predominantly regional groundwater. Though groundwater elevations display clear annual cycles and winter months are punctuated by high river flow, localised recharge from both of these processes combined is stored in the upper <10 m of the aquifer. The presence of silts and clays on the floodplain and riverbanks combined with strong upwards hydraulic gradients in the Eastern View Formation, 10
driven by groundwater flow from the Barongarook High, ensure that recharge in the near-river environment does not penetrate deep within the aquifer (Fig. 8).
5.6 14C ages and Cl
The good correlation of a14C with chloride implies that chloride concentrations correspond to groundwater age (Fig. 9). Correlations between 14C and Cl have also 15
been documented in groundwater from the Eastern View Formation in other regions of the Otway Basin (Love et al., 1994). In assessing this relationship, chloride sources must be considered. That the Cl/Br ratios in the groundwater are similar to those of rainfall preclude significant halite dissolution by the groundwater from the Eastern View Formation, and there are no extensive occurrences of halite in the aquifer matrix. 20
We propose two explanations of this trend. Firstly, the relationship between a14C and Cl may be explained by mixing of low salinity groundwater that is locally recharged within the valley and high salinity regional groundwater from the Barongarook High. However, the groundwater with higha14C and low Cl also has high3H activities (0.99– 1.47 TU) and if mixing has occurred it must do so at a very slow rate otherwise 25
HESSD
11, 5953–5989, 2014Using14C and3H to
understand groundwater flow and
recharge
A. P. Atkinson et al.
Title Page
Abstract Introduction
Conclusions References
Tables Figures
◭ ◮
◭ ◮
Back Close
Full Screen / Esc
Printer-friendly Version
Interactive Discussion
Discussion
P
a
per
|
Discus
sion
P
a
per
|
Discussion
P
a
per
|
Discussion
P
a
per
|
that mixing between the shallow groundwater system and the deeper groundwater is limited.
Alternatively the recharge on the Barongarook High may be spatially variable due to the heterogenous nature of the Eastern View Formation or may have undergone changes over time due to climate fluctuations. If evapotranspiration is a dominant 5
process Cl concentrations are likely to be inversely correlated with recharge rates. In the Otway Basin Love et al. (1994) report a decrease in Cl concentrations in groundwater recharged between 18 and 10 ka, followed by an increase in Cl concentrations in groundwater recharged from 10 ka to the present day, which they attribute to increased evapotranspiration rates during a warm Holocene climate. 10
However, in this study decreasing Cl concentrations with increasinga14C would imply that recharge rates on the Barongarook high increased from 10 000 years BP to the present, which is not likely given the warming trend. There is also the possibility that recharge is spatially variable on the Barongarook High, resulting in groundwater flowpaths with a large distribution of groundwater ages and that the high Cl lowa14C 15
groundwater is derived from regions with locally low recharge rates (as is the case in the Murray Basin of southeast Australia: Cartwright et al., 2006). Regardless of which model is correct, the chloride measurements provide a useful first order estimate of groundwater residence times.
6 Conclusion
20
Though widely available water-table measurements offer an insight into recharge, the dynamics of groundwater flow systems and recharge patterns can only be fully understood when combined with geochemical data, in particular radiogenic tracers such as 3H and 14C. These can be used to assess the importance of recharge and discharge in aquifer windows, which in turn defines groundwater pathways and allows 25
HESSD
11, 5953–5989, 2014Using14C and3H to
understand groundwater flow and
recharge
A. P. Atkinson et al.
Title Page
Abstract Introduction
Conclusions References
Tables Figures
◭ ◮
◭ ◮
Back Close
Full Screen / Esc
Printer-friendly Version
Interactive Discussion
Discussion
P
a
per
|
Discus
sion
P
a
per
|
Discussion
P
a
per
|
Discussion
P
a
per
|
(90–370 mm yr−1). However, the groundwater at 5–10 m below the water table has14C ages between 350 and 10 000 years, and below detection3H activities. Furthermore, there is no indication of water from the river penetrating more than∼10 m following flood events. In the Gellibrand River Valley, outcropping aquifer sediments act as a regional discharge zone. Upwards head gradients are maintained for long periods of 5
time and aided by the presence of silts and clays on the floodplain, this limits the depth to which diffuse and localised recharge (via over-bank events and bank exchange) penetrate the aquifer.
There is most likely a shallow local flow system within the Gellibrand River Valley that has limited connectivity with the deeper groundwater. This potentially limits 10
the spread of pollutants such as nitrate and pesticides that may derive from the agricultural activities into the regional groundwater. Future land-use, climate change or groundwater exploitation that occurs on the Barongarook High is likely to affect both the chemistry of groundwater within the valley, and groundwater fluxes to the Gellibrand River, highlighting the importance of regional recharge zones.
15
Acknowledgements. We would like to thank colleagues who assisted in labarotary analysis. In particular, Massimo Raveggi and Rachelle Pierson (Monash University) for stable isotope, anion and cation analyses, and Simon Varley (ANSTO) for14C determinations.
References
Alley, W. M., Healy, R. W., LaBaugh, J. W., and Reilly, T. E.: Flow and storage in groundwater 20
systems, Science, 296, 1985, doi:10.1126/science.1067123, 2002.
Atkinson, A. P., Cartwright, I., Gilfedder, B. S., Hofmann, H., Unland, N. P., Cendón, D. I., and Chisari, R.: A multi-tracer approach to quantifying groundwater inflows to an upland river; assessing the influence of variable groundwater chemistry, Hydrol. Process., doi:10.1002/hyp.10122, in press, 2013.
25
HESSD
11, 5953–5989, 2014Using14C and3H to
understand groundwater flow and
recharge
A. P. Atkinson et al.
Title Page
Abstract Introduction
Conclusions References
Tables Figures
◭ ◮
◭ ◮
Back Close
Full Screen / Esc
Printer-friendly Version
Interactive Discussion
Discussion
P
a
per
|
Discus
sion
P
a
per
|
Discussion
P
a
per
|
Discussion
P
a
per
|
Bethke, C. M. and Johnson, T. M.: Groundwater age and groundwater age dating, Annu. Rev. Earth Pl. Sc., 36, 121–152, doi:10.1146/annurev.earth.36.031207.124210, 2008.
Blackburn, G. and Mcleod, S.: Salinity of atmospheric precipitation in the Murray–Darling drainage division, Australia, Aust. J. Soil Res., 21, 411–434, doi:10.1071/SR9830411, 1983. Böhlke, J. K.: Groundwater recharge and agricultural contamination, Hydrogeol. J., 10, 153– 5
179, doi:10.1007/s10040-001-0183-3, 2002.
Böhlke, J. K. and Denver, J. M.: Combined use of groundwater dating, chemical, and isotopic analyses to resolve the history and fate of nitrate contamination in two agricultural watersheds, Atlantic coastal plain, Maryland, Water. Resour. Res., 31, 2319–2339, doi:10.1029/95wr01584, 1995.
10
Briguglio, D., Kowalczyk, J., Stilwell, J. D., Hall, M., and Coffa, A.: Detailed paleogeographic evolution of the Bass Basin: Late Cretaceous to present, Aust. J. Earth Sci., 60, 719–734, doi:10.1080/08120099.2013.826282, 2013.
Bureau of Meteorology: Commonwealth of Australia Bureau of Meteorology, available at: http: //www.bom.gov.au, last access: 14 January 2014.
15
Campana, M. E. and Simpson, E. S.: Groundwater residence times and recharge rates
using a discrete-state compartment model and 14C data, J. Hydrol., 72, 171–185,
doi:10.1016/0022-1694(84)90190-2, 1984.
Cardenas, M. B.: Potential contribution of topography-driven regional groundwater flow to fractal stream chemistry: residence time distribution analysis of Tóth flow, Geophys. Res. Lett., 34, 20
L05403, doi:10.1029/2006gl029126, 2007.
Cartwright, I. and Morgenstern, U.: Constraining groundwater recharge and the rate of geochemical processes using tritium and major ion geochemistry: ovens catchment, southeast Australia, J. Hydrol., 475, 137–149, doi:10.1016/j.jhydrol.2012.09.037, 2012. Cartwright, I., Weaver, T. R., and Fifield, L. K.: Cl/Br ratios and environmental isotopes as 25
indicators of recharge variability and groundwater flow: an example from the southeast Murray Basin, Australia, Chem. Geol., 231, 38–56, doi:10.1016/j.chemgeo.2005.12.009, 2006.
Cartwright, I., Weaver, T. R., Cendón, D. I., Fifield, L. K., Tweed, S. O., Petrides, B., and Swane, I.: Constraining groundwater flow, residence times, inter-aquifer mixing, and aquifer 30
HESSD
11, 5953–5989, 2014Using14C and3H to
understand groundwater flow and
recharge
A. P. Atkinson et al.
Title Page
Abstract Introduction
Conclusions References
Tables Figures
◭ ◮
◭ ◮
Back Close
Full Screen / Esc
Printer-friendly Version
Interactive Discussion
Discussion
P
a
per
|
Discus
sion
P
a
per
|
Discussion
P
a
per
|
Discussion
P
a
per
|
Cartwright, I., Fifield, L. K., and Morgenstern, U.: Using3H and 14C to constrain the degree of closed-system dissolution of calcite in groundwater, Appl. Geochem., 32, 118–128, doi:10.1016/j.apgeochem.2012.10.023, 2013.
Cendón, D. I., Larsen, J. R., Jones, B. G., Nanson, G. C., Rickleman, D., Hankin, S. I., Pueyo, J. J., and Maroulis, J.: Freshwater recharge into a shallow saline groundwater 5
system, Cooper Creek floodplain, Queensland, Australia, J. Hydrol., 392, 150–163, doi:10.1016/j.jhydrol.2010.08.003, 2010.
Cendón, D. I., Hankin, S. I., Williams, J. P., Van Der Ley, M., Peterson, M., Hughes, C. E., Meredith, K., Graham, I. T., Hollins, S. E., Levchenko, V., and Chisari, R.: Groundwater residence time in a dissected and weathered sandstone 10
plateau: Kulnura-Mangrove Mountain aquifer, NSW, Australia, Aust. J. Earth Sci., 1–25, doi:10.1080/08120099.2014.893628, 2014.
Cerling, T. E., Solomon, D. K., Quade, J., and Bowman, J. R.: On the isotopic composition of carbon in soil carbon dioxide, Geochim. Cosmochim. Ac., 55, 3403–3405, doi:10.1016/0016-7037(91)90498-T, 1991.
15
Chen, X. and Chen, X.: Stream water infiltration, bank storage, and storage zone changes due to stream-stage fluctuations, J. Hydrol., 280, 246–264, doi:10.1016/S0022-1694(03)00232-4, 2003.
Clark, I. D. and Fritz, P.: Environmental Isotopes in Hydrogeology, Lewis, New York, USA, 1997. Cook, P. G. and Robinson, N. I.: Estimating groundwater recharge in fractured rock from 20
environmental3H and 36Cl, Clare Valley, South Australia, Water. Resour. Res., 38, 11–13, doi:10.1029/2001wr000772, 2002.
Cook, P. G., Herczeg, A., and Kalin, R.: Radiocarbon dating of groundwater systems, in: Environmental Tracers in Subsurface Hydrology, Springer, USA, 111–144, 2000.
Coplen, T. B.: Normalization of oxygen and hydrogen isotope data, Chem. Geol., 72, 293–297, 25
doi:10.1016/0168-9622(88)90042-5, 1988.
Doble, R. B. P., McCallum, J., and Cook, P.: An analysis of river bank slope and unsaturated flow
effect on bank storage, Groundwater, 50, 77–86, doi:10.1111/j.1745-6584.2011.00821.x,
2012.
Edmunds, W. M., Carrillo-Rivera, J. J., and Cardona, A.: Geochemical evolution of groundwater 30
HESSD
11, 5953–5989, 2014Using14C and3H to
understand groundwater flow and
recharge
A. P. Atkinson et al.
Title Page
Abstract Introduction
Conclusions References
Tables Figures
◭ ◮
◭ ◮
Back Close
Full Screen / Esc
Printer-friendly Version
Interactive Discussion
Discussion
P
a
per
|
Discus
sion
P
a
per
|
Discussion
P
a
per
|
Discussion
P
a
per
|
Fink, D., Hotchkis, M., Hua, Q., Jacobsen, G., Smith, A. M., Zoppi, U., Child, D., Mifsud, C., van der Gaast, H., Williams, A., and Williams, M.: The ANTARES AMS facility at ANSTO, Nucl. Instrum. Meth. B, 223–224, 109–115, 2004.
Foster, S. S. D. and Chilton, P. J.: Groundwater: the processes and global significance of aquifer degradation, Philos. T. R. Soc. B, 358, 1957–1972, doi:10.1098/rstb.2003.1380, 2003. 5
Frisbee, M. D., Wilson, J. L., Gomez-Velez, J. D., Phillips, F. M., and Campbell, A. R.: Are we missing the tail (and the tale) of residence time distributions in watersheds?, Geophys. Res. Lett., 40, 4633–4637, doi:10.1002/grl.50895, 2013.
Gardner, W. P., Harrington, G. A., Solomon, D. K., and Cook, P. G.: Using terrigenic4He to identify and quantify regional groundwater discharge to streams, Water. Resour. Res., 47, 10
W06523, doi:10.1029/2010wr010276, 2011.
Goderniaux, P., Davy, P., Bresciani, E., de Dreuzy, J. R., and Le Borgne, T.: Partitioning a regional groundwater flow system into shallow local and deep regional flow compartments, Water. Resour. Res., 49, 2274–2286, doi:10.1002/wrcr.20186, 2013.
Han, L. F. and Plummer, L. N.: Revision of Fontes & Garnier’s model for the initial14C content 15
of dissolved inorganic carbon used in groundwater dating, Chem. Geol., 351, 105–114, doi:10.1016/j.chemgeo.2013.05.011, 2013.
Herczeg, A. L., Dogramaci, S. S., and Leaney, F. W. J.: Origin of dissolved salts in a large, semi-arid groundwater system: Murray Basin, Australia, Mar. Freshwater Res., 52, 41–52, doi:10.1071/MF00040, 2001.
20
Hilscherova, K., Dusek, L., Kubik, V., Cupr, P., Hofman, J., Klanova, J., and Holoubek, I.: Redistribution of organic pollutants in river sediments and alluvial soils related to major floods, J. Soil. Sediment., 7, 167–177, doi:10.1065/jss2007.04.222, 2007.
Hortle, A., de Caritat, P., Stalvies, C., and Jenkins, C.: Groundwater monitoring at the Otway project site, Australia, Energy Procedia, 4, 5495–5503, doi:10.1016/j.egypro.2011.02.535, 25
2011.
Hughes, C. E. and Crawford, J.: A new precipitation weighted method for determining the meteoric water line for hydrological applications demonstrated using Australian and global GNIP data, J. Hydrol., 464, 344–351, doi:10.1016/j.jhydrol.2012.07.029, 2012.
Krüger, F., Meissner, R., Gröngröft, A., and Grunewald, K.: Flood induced heavy metal and 30
HESSD
11, 5953–5989, 2014Using14C and3H to
understand groundwater flow and
recharge
A. P. Atkinson et al.
Title Page
Abstract Introduction
Conclusions References
Tables Figures
◭ ◮
◭ ◮
Back Close
Full Screen / Esc
Printer-friendly Version
Interactive Discussion
Discussion
P
a
per
|
Discus
sion
P
a
per
|
Discussion
P
a
per
|
Discussion
P
a
per
|
Leonards, J., Lakey, R., and Cumming, S.: Gellibrand Groundwater Investigation Interim Report, Geologic Survey of Victoria, Department of Minerals and Energy, Unpublished Report, 1981.
Le Gal La Salle, C., Marlin, C., Leduc, C., Taupin, J. D., Massault, M., and Favreau, G.:
Renewal rate estimation of groundwater based on radioactive tracers (3H, 14C) in an
5
unconfined aquifer in a semi-arid area, Iullemeden Basin, Niger, J. Hydrol., 254, 145–156, doi:10.1016/S0022-1694(01)00491-7, 2001.
Love, A. J., Herczeg. A. L., Armstrong, D., Stadter, F., and Mazor, E.: Groundwater flow regime within the Gambier Embayment of the Otway Basin, Australia: evidence from hydraulics and hydrochemistry, J. Hydrol., 143, 297–338, doi:10.1016/0022-1694(93)90197-H, 1993. 10
Love, A. J., Herczeg, A. L., Leaney, F. W., Stadter, M. F., Dighton, J. C., and Armstrong, D.: Groundwater residence time and palaeohydrology in the Otway Basin, South Australia:2H,
18
O and14C data. J. Hydrol., 153, 157–187, doi:10.1016/0022-1694(94)90190-2, 1994. Manning, A. H., Clark, J. F., Diaz, S. H., Rademacher, L. K., Earman, S., and Plummer, N. L.:
Evolution of groundwater age in a mountain watershed over a period of thirteen years, J. 15
Hydrol., 460, 13–28, doi:10.1016/j.jhydrol.2012.06.030, 2012.
Mazor, E. and Nativ, R.: Hydraulic calculation of groundwater flow velocity and age: examination of the basic premises, J. Hydrol., 138, 211–222, doi:10.1016/0022-1694(92)90165-R, 1992. McCallum, J. L., Cook, P. G., Brunner, P., and Berhane, D.: Solute dynamics during bank
storage flows and implications for chemical base flow separation, Water Resour. Res., 46, 20
W07541, doi:10.1029/2009wr008539, 2010.
McDonnell, J. J., McGuire, K., Aggarwal, P., Beven, K. J., Biondi, D., Destouni, G., Dunn, S., Kirchner, J. A., Kraft, P., Lyon, S., Maloszewski, P., Newman, B., Pfister, L., Rinaldo, A., Rodhe, A., Sayama, T., Seibert, J., Solomon, K., Soulsby, C., Stewart, M., Tetzlaff, D., Tobin, C., Troch, P., Weiler, M., Western, A., Wörman, A., and Wrede, S.: How old is 25
streamwater? Open questions in catchment transit time conceptualization, modelling and analysis, Hydrol. Process., 24, 1745–1754, doi:10.1002/hyp.7796, 2010.
Meredith, K. T., Cendón, D. I., Pigois, J- P., Hollins, S. E., and Jacobsen, G.: Using14C and3H to delineate a recharge “window” into the Perth Basin aquifers, North Gnangara groundwater system, Western Australia, Sci. Total Environ., 414, 456–469, 2012.
30
HESSD
11, 5953–5989, 2014Using14C and3H to
understand groundwater flow and
recharge
A. P. Atkinson et al.
Title Page
Abstract Introduction
Conclusions References
Tables Figures
◭ ◮
◭ ◮
Back Close
Full Screen / Esc
Printer-friendly Version
Interactive Discussion
Discussion
P
a
per
|
Discus
sion
P
a
per
|
Discussion
P
a
per
|
Discussion
P
a
per
|
Moench, A. F. and Barlow, P. M.: Aquifer response to stream-stage and recharge variations. I. Analytical step-response functions, J. Hydrol., 230, 192–210, doi:10.1016/S0022-1694(00)00175-X, 2000.
Mook, W. G., Bommerson, J. C., and Staverman, W. H.: Carbon isotope fractionation between dissolved bicarbonate and gaseous carbon dioxide, Earth Planet. Sc. Lett., 22, 169–176, 5
doi:10.1016/0012-821X(74)90078-8, 1974.
Morgenstern, U. and Taylor, C. B.: Ultra low-level tritium measurement using electrolytic enrichment and LSC, Isot. Environ. Healt. S., 45, 96–117, 2009.
Morgenstern, U., Stewart, M. K., and Stenger, R.: Dating of streamwater using tritium in a post nuclear bomb pulse world: continuous variation of mean transit time with streamflow, Hydrol. 10
Earth Syst. Sci., 14, 2289–2301, doi:10.5194/hess-14-2289-2010, 2010.
Muennich, K. O.: Messung des14C-Gehaltes von hartem Grundwasser, Naturwissenschaften,
34, 32–33, 1957.
Neklapilova, B.: Conductivity measurements and large volumes distillation of samples for tritium analysis, ANSTO Internal Guideline, Technical Report ENV-I-070-002, ANSTO – Institute for 15
Environmental Research, Australia, 2008a.
Neklapilova, B.: Electrolysis and small volume distillation of samples for tritium activity analysis, ANSTO Internal Guideline, Technical Report ENV-I-070-003, ANSTO – Institute for Environmental Research, Australia, 2008b.
Newsom, J. M. and Wilson, J. L.: Flow of ground water to a well near a stream – effect
20
of ambient ground-water flow direction, Ground Water, 26, 703–711, doi:10.1111/j.1745-6584.1988.tb00420.x, 1988.
Payton Gardner, W., Susong, D. D., Kip Solomon, D., and Heasler, H.: Snowmelt hydrograph interpretation: revealing watershed scale hydrologic characteristics of the Yellowstone volcanic plateau, J. Hydrol., 383, 209–222, doi:10.1016/j.jhydrol.2009.12.037, 2010.
25
Petrides, B. and Cartwright, I.: The hydrogeology and hydrogeochemistry of the Barwon Downs Graben aquifer, southwestern Victoria, Australia, Hydrogeol. J., 14, 809–826, doi:10.1007/s10040-005-0018-8, 2006.
Post, V. E. A., Vandenbohede, A., Werner, A. D., Maimun, S., and Teubner, M. D.:
Groundwater ages in coastal aquifers, Adv. Water Resour., 57, 1–11,
30
HESSD
11, 5953–5989, 2014Using14C and3H to
understand groundwater flow and
recharge
A. P. Atkinson et al.
Title Page
Abstract Introduction
Conclusions References
Tables Figures
◭ ◮
◭ ◮
Back Close
Full Screen / Esc
Printer-friendly Version
Interactive Discussion
Discussion
P
a
per
|
Discus
sion
P
a
per
|
Discussion
P
a
per
|
Discussion
P
a
per
|
Quade, J., Chivas, A. R., and McCulloch, M. T.: Strontium and carbon isotope tracers and the origins of soil carbonate in South Australia and Victoria, Palaeogeogr. Palaeocl., 113, 103– 117, doi:10.1016/0031-0182(95)00065-T, 1995.
Reilly, T. E., Plummer, L. N., Phillips, P. J., and Busenberg, E.: The use of simulation and multiple environmental tracers to quantify groundwater flow in a shallow aquifer, Water Resour. Res., 5
30, 421–433, doi:10.1029/93wr02655, 1994.
Samborska, K., Różkowski, A., and Małoszewski, P.: Estimation of groundwater residence time using environmental radioisotopes (14C,T) in carbonate aquifers, southern Poland, Isot. Environ. Healt. S., 49, 73–97, doi:10.1080/10256016.2012.677041, 2012.
Scanlon, B., Healy, R., and Cook, P.: Choosing appropriate techniques for quantifying 10
groundwater recharge, Hydrogeol. J., 10, 18–39, doi:10.1007/s10040-001-0176-2, 2002. Shentsis, I. and Rosenthal, E.: Recharge of aquifers by flood events in an arid region, Hydrol.
Process., 17, 695–712, doi:10.1002/hyp.1160, 2003.
Sklash, M. G. and Farvolden, R. N.: The role of groundwater in storm runoff, J. Hydrol., 43, 45–65, doi:10.1016/0022-1694(79)90164-1, 1979.
15
Smerdon, B. D., Payton Gardner, W., Harrington, G. A., and Tickell, S. J.: Identifying the contribution of regional groundwater to the baseflow of a tropical river (Daly River, Australia), J. Hydrol., 464–465, 107–115, doi:10.1016/j.jhydrol.2012.06.058, 2012.
Stewart, M. K.: A 40-year record of carbon-14 and tritium in the Christchurch groundwater system, New Zealand: dating of young samples with carbon-14, J. Hydrol., 430, 50–68, 20
doi:10.1016/j.jhydrol.2012.01.046, 2012.
Stichler, W., Maeszewski, P., and Moser, H.: Modelling of river water infiltration using oxygen-18 data, J. Hydrol., 83, 355–365, doi:10.1016/0022-1694(86)90161-7, 1986.
Stuvier, M. and Polach, H. A.: Reporting of14C data, Radiocarbon, 19, 355–363, 1977. Stuyfzand, P. J.: Hydrology and water quality aspects of rhine bank groundwater in the 25
Netherlands, J. Hydrol., 106, 341–363, doi:10.1016/0022-1694(89)90079-6, 1989.
Tadros, C. V., Hughes, C. E., Crawford, J., Hollins, S. E., and Chisari, R.: Tritium in Australian precipitation: a 50 year record, J. Hydrol., 513, 262–273, doi:10.1016/j.jhydrol.2014.03.031, 2014.
Tesoriero, A. J., Spruill, T. B., Mew, H. E., Farrell, K. M., and Harden, S. L.: Nitrogen transport 30
HESSD
11, 5953–5989, 2014Using14C and3H to
understand groundwater flow and
recharge
A. P. Atkinson et al.
Title Page
Abstract Introduction
Conclusions References
Tables Figures
◭ ◮
◭ ◮
Back Close
Full Screen / Esc
Printer-friendly Version
Interactive Discussion
Discussion
P
a
per
|
Discus
sion
P
a
per
|
Discussion
P
a
per
|
Discussion
P
a
per
|
Tóth, J.: A theoretical analysis of groundwater flow in small drainage basins, J. Geophys. Res., 68, 4795–4812, doi:10.1029/JZ068i016p04795, 1963.
Unland, N. P., Cartwright, I., Cendón, D. I., and Chisari, R.: Residence times and mixing of water in river banks: implications for recharge and groundwater – surface water exchange, Hydrol. Earth Syst. Sci. Discuss., 11, 1651–1691, doi:10.5194/hessd-11-1651-2014, 2014. 5
Van den Berg, A. H. M.: Rock unit names in western Victoria, Seamless Geology Project, Geological Survey of Victoria Report 130, GeoScience Victoria,State of Victoria, Department of Primary Industries, 2009.
Victorian Water Resources Data Warehouse: Victorian Department of Sustainability and Environment Water Resources Data Warehouse, available at: http://www.vicwaterdata.net, 10
last access: January 2014.
Vogel, J. C., Grootes, P. M., and Mook, W. G.: Isotopic fractionation between gaseous and dissolved carbon dioxide, Z. Phys., 230, 225–238, doi:10.1007/bf01394688, 1970.
Vogel, J. C., Thilo, L., and Van Dijken, M.: Determination of groundwater recharge with tritium, J. Hydrol., 23, 131–140, doi:10.1016/0022-1694(74)90027-4, 1974.
15
Vogt, T., Hoehn, E., Schneider, P., Freund, A., Schirmer, M., and Cirpka, O. A.: Fluctuations of electrical conductivity as a natural tracer for bank filtration in a losing stream, Adv. Water. Resour., 33, 1296–1308, doi:10.1016/j.advwatres.2010.02.007, 2010.
Wigley, T. M. L.: Carbon 14 dating of groundwater from closed and open systems, Water Resour. Res., 11, 324–328, doi:10.1029/WR011i002p00324, 1975.
20
HESSD
11, 5953–5989, 2014Using14C and3H to
understand groundwater flow and
recharge
A. P. Atkinson et al.
Title Page
Abstract Introduction
Conclusions References
Tables Figures
◭ ◮
◭ ◮
Back Close
Full Screen / Esc
Printer-friendly Version
Interactive Discussion
Discussion
P
a
per
|
Discus
sion
P
a
per
|
Discussion
P
a
per
|
Discussion
P
a
per
|
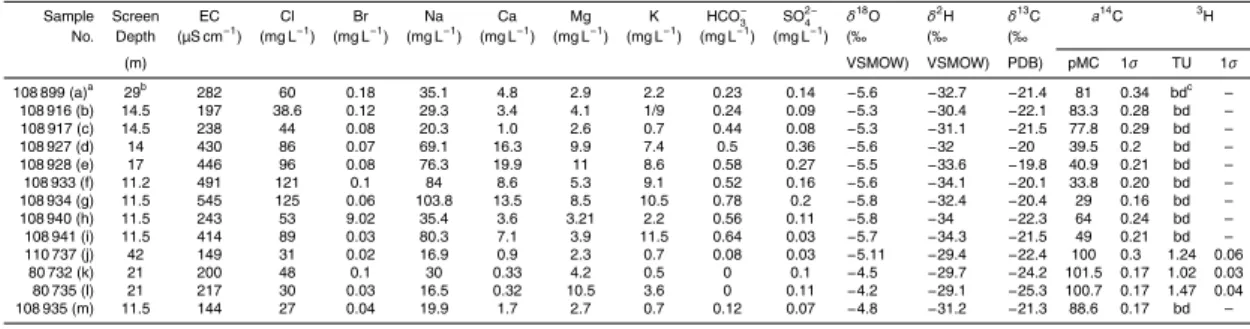
Table 1.Screen depth, Cl,18O,2H,13C,a14C and3H activities of groundwater samples.
Sample Screen EC Cl Br Na Ca Mg K HCO−
3 SO 2−
4 δ
18O
δ2H
δ13C
a14C 3H No. Depth (µS cm−1) (mg L−1) (mg L−1) (mg L−1) (mg L−1) (mg L−1) (mg L−1) (mg L−1) (mg L−1) (‰ (‰ (‰
(m) VSMOW) VSMOW) PDB) pMC 1σ TU 1σ
108 899 (a)a 29b 282 60 0.18 35.1 4.8 2.9 2.2 0.23 0.14
−5.6 −32.7 −21.4 81 0.34 bdc – 108 916 (b) 14.5 197 38.6 0.12 29.3 3.4 4.1 1/9 0.24 0.09 −5.3 −30.4 −22.1 83.3 0.28 bd – 108 917 (c) 14.5 238 44 0.08 20.3 1.0 2.6 0.7 0.44 0.08 −5.3 −31.1 −21.5 77.8 0.29 bd – 108 927 (d) 14 430 86 0.07 69.1 16.3 9.9 7.4 0.5 0.36 −5.6 −32 −20 39.5 0.2 bd – 108 928 (e) 17 446 96 0.08 76.3 19.9 11 8.6 0.58 0.27 −5.5 −33.6 −19.8 40.9 0.21 bd – 108 933 (f) 11.2 491 121 0.1 84 8.6 5.3 9.1 0.52 0.16 −5.6 −34.1 −20.1 33.8 0.20 bd – 108 934 (g) 11.5 545 125 0.06 103.8 13.5 8.5 10.5 0.78 0.2 −5.8 −32.4 −20.4 29 0.16 bd – 108 940 (h) 11.5 243 53 9.02 35.4 3.6 3.21 2.2 0.56 0.11 −5.8 −34 −22.3 64 0.24 bd – 108 941 (i) 11.5 414 89 0.03 80.3 7.1 3.9 11.5 0.64 0.03 −5.7 −34.3 −21.5 49 0.21 bd – 110 737 (j) 42 149 31 0.02 16.9 0.9 2.3 0.7 0.08 0.03 −5.11 −29.4 −22.4 100 0.3 1.24 0.06
80 732 (k) 21 200 48 0.1 30 0.33 4.2 0.5 0 0.1 −4.5 −29.7 −24.2 101.5 0.17 1.02 0.03 80 735 (l) 21 217 30 0.03 16.5 0.32 10.5 3.6 0 0.11 −4.2 −29.1 −25.3 100.7 0.17 1.47 0.04 108 935 (m) 11.5 144 27 0.04 19.9 1.7 2.7 0.7 0.12 0.07 −4.8 −31.2 −21.3 88.6 0.17 bd –
a
Refers to letter numbers on Fig. 1.
bMeasured as depth to the middle of the well screen.
c 3