F. O. Neves
Federal University of Sao Joao del Rei Praça Frei Orlando 170, Centro 36360-000 São João del-Rei, MG. Brazil [email protected]S. T. Button
C. Caminaga
and F. C. Gentile
State University of Campinas School of Mechanical Engineering Department of Materials Engineering C. P. 6122 13083-970 Campinas, SP. Brazil [email protected] [email protected] and [email protected]Numerical and Experimental Analysis
of Tube Drawing With Fixed Plug
Numerical simulation of manufacturing processes has become in the last years an important tool to improve these processes reducing lead times and try out, and providing products free of defects and with controlled mechanical properties. Finite Element Method (FEM) is one of the most important methods to simulate metal forming. In tube drawing with fixed plug both the outer diameter and the inner diameter of the tube are properly defined if correct process conditions are chosen for the die angle, drawing speed, lubrication and area reduction per pass. These conditions have great influence on drawing loads and residual stresses present in the product. In this work, the cold drawing of tubes with fixed plug was simulated by FEM with the commercial software MSC.Superform to find the best geometry of die and plug to reduce the drawing force. The numerical analysis supplied results for the reactions of the die and plug and the stresses in the tube, the drawing force and the final dimensions of the product. Those results are compared with results obtained from analytic models, and used tooling design. Experimental tests with a laboratory drawing bench were carried out with three different lubricants and two different lubrication conditions.
Keywords: Cold tube drawing, finite element analysis, die design, upper bound solution
Introduction
Superior quality products with precise dimensions, good surface finish and specified mechanical properties can be obtained with drawing processes. However, the design of optimized cold drawing by means of classical trials and errors procedures, based substantially on designers’ experience, has become increasingly heavy in terms of time and cost.1
In recent years, rapid development of computer techniques and the application of the theory of plasticity made possible to apply a more complex approach to problems of metals formability and plasticity. Numerical simulation is a very usefull tool to predict mechanical properties of the products and to optimize the tools design (Bethenoux et al., 1996). Pospiech (1997) presented a description of a mathematical model for the process of tube drawing with fixed mandrels. Karnezis and Farrugia (1966) had made an extensive study on tube drawing using finite element modelling. In addition, other studies have been done to relate reduction drawn force and process costs to process parameters and tool design (Jallon e Hergesheimer, 1993; Joun e Hwang, 1993; Chin e Steif, 1995; Dixit e Dixit, 1995; El-Domiat e Kassab, 1998). Lubrication is also an object of study, in order to obtain a perfect liquid film in the tool/part interface (Martinez, 1998; Button, 2001).
In this study, we present a tool device specially designed to reduce drawn force, formed by two dies assembled within a recipient wich can be sealed, generating a pressurized lubrication during the process. Die and plug geometry are obtained from the numerical simulation. Experimental tests with this tooling in a laboratory drawing bench were performed, using three different lubricants and pressurized and unpressurized lubrication. The experimental results were compared to numerical results and the performance of the process was analyzed with a statistical model.
Paper accepted August, 2005. Technical Editor: Anselmo Eduardo Diniz.
Nomenclature
Ri = external inlet radius of the tube Rii = internal inlet radius of the tube Rf = external outlet radius of the tube Rf = internal outlet radius of the tube L = bearing length
Wh = Homogeneous work Wr = redundant work Wa = fricition work Greek Symbols
α = die semi-angle
αp = plug semi-angle dp = nib diameter
β = semi-angle of the internal cone of the tube after drawing without plug
ε = true strain
µ1 = Coulomb friction between tube and die
µ2 = Coulomb friction between plug and tube
σ = stress
σtref=drawing stress
σ0 = average yield stress
τ1 = Velocity surface descontinuity on inner die
τ2 = Velocity surface descontinuity on outter die
τ3 = Contact surface in the work zone at die/workpiece interface
τ4 = C ontact surface in the die bearing/workpiece interface
τ5 = Contact surface in the plug bearing/workpiece interface
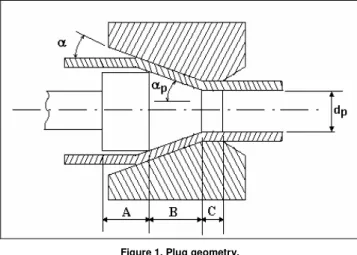
τ6 = contact surface in the work at zone plug/workpiece interface Plug Geometry
J. of the Braz. Soc. of Mech. Sci. & Eng. Copyright 2005 by ABCM October-December 2005, Vol. XXVII, No. 4 /427
Figure 1. Plug geometry.
Region C, called ‘nib’, is cylindrical and controls the inner diameter of the tube. In the present study the wall thickness of the tube was reduced by 0.1 mm. The length of the nib was fixed in 2 mm for all tests.
Finite Element Model
Tube drawing process was simulated with the software MSC.Superform 2002 using a 3D finite element model as shown in Fig. 2. Tubes with dimension 10 x 1.5 mm (outer diameter x thickness) were drawn to three diferent area reduction, using four die angles for each reduction, as shown on Tab. 1. In all simulations, the wall thickness was reduced from 1.5 mm to 1.4 mm.
A quarter piece of tube 100 mm long was modeled using 3200 bricks elements with 8 nodes to define the mesh. This length was tested in order to obtain the steady-state condition. The die geometry consisted of a 30º half entry angle, a 15º half exit angle and a bearing length of 0.4 times the outlet dameter.
Friction between die and tube and between tube and plug was estimated as 0.05, assumed to be Coulomb friction. Die and plug were modeled with an elastic material, assumed to be tugsten carbide (Young modulus of 700 GPa).
Figure 2. FE meshes of tube, die and plug used in the numerical simulation.
Table 1. Area reductions and die angles used in the numerical simulation.
Simulation # Area
reduction (%)
Die semi-angle (degrees)
Outlet diameter (mm)
1 34.4 7.0 7.94
2 34.4 8.8 7.94
3 34.4 10.0 7.94
4 34.4 14.0 7.94
5 26.5 7.0 8.40
6 26.5 8.8 8.40
7 26.5 10.0 8.40
8 26.5 14.0 8.40
9 20.0 7.0 8.76
10 20.0 8.8 8.76
11 20.0 10.0 8.76
12 20.0 14.0 8.76
An elasto-plastic model was used for the material of the tube. Tensile tests of stainless A304 steel tubes were carried out to obtain the stress-strain curve (σ x ε) to be used in the simulation. This stress-strain curve was approached by Holloman’s equation as shown in Eq. (1).
σ = 1137 ε0,52 [MPa] (1)
Young modulus of 210 GPa and a Poisson ratio of 0.3 were defined to the tube material, which was assumed to be isotropic and insensitive to strain rate. During experimental drawing it was noticed that the temperature at the tube was not higher than 100 ºC, thus allowing the tube material to be modelled independent on the temperature.
Analytical Model
An upper bound solution (UBS) of tube drawing with fixed plug was developed in this work. This solution was adapted from that obtained by Avitzur (1983) for tube sinking. This analytical model considered an isotropic strain-hardening material for the tube, Coulomb frictions, a cylindrical stress state, and the Tresca´s flow rule. The process geometry is represented in Fig. 3. Equation (2) is the analytical expression obtained with this solution for the tube drawing tension with fixed plug.
Figure 3. Tube drawing with fixed plug.
σtref = σ0
Wh + Wr + Wa2µ1 L Rf
(2)
Wh = 2f(α) ln Ri
Rf (3)
Wr = 2 3
α
sen2 (α) - cotg (α) -
β
sen2 (β) + cotg (β) (4)
DIE
Wa = B(1 – ln Ri Rf ) ln
Ri Rf + 2µ1
L Rf;1 + 2µ1
L
Rf (5)
B = 2{µ1 cotg (α)+µ2 cotg (β)} (6)
f(γ) = 1 sen2(α)
cos(β) 1-1112sen 2
(β) - cos(α) 1-11 12 sen
2 (α) +
+
1-1112sen 2
(β) 11
12cos(α) + 1-11 12sen
2 (α)
(7)
Experimental Tests
A304 stainless steel tubes were drawn in a laboratory drawing bench. Tubes with 10 x 1.5 mm (outer diameter x thickness) were reduced to 7.94 x 1.4 mm, which represents a drawing pass with 34.4% of area reduction. Two dies were used, both of tungsten carbide with die semi-angle α of 7º and bearing length of 3 mm. One die has an exit diameter of 9.8 mm and the other an exit diameter of 7.94 mm.
The tube initial length was 500 mm. First, it was cold swaged to reduce one of its ends and to allow it to pass through the dies. Figure 4 shows an illustration of the die support. The tooling was assembled with three chambers. The first chamber receives a die, called second reduction die, wich promotes the most significant tube reduction. It also receives the load cell, to measure the drawing force. A second chamber receives another die, called first reduction die, which will promote a very low reduction. This chamber length is greater than the die body lenght. A third chamber is designed to receive the lubricant. After the tube was located inside the die, the die support was filled with oil and closed to be pressurized. Then the tube was forced to pass through the dies. Therefore the first reduction die is pulled, increasing the pressured within the chambers, and forcing the lubricant to pass with the tube through the second reduction die, being the first reduction from 10 to 9.8 mm and the second, from 9.8 to 7.94 mm.
Tubes were drawn at speeds of 1 m/min, 2 m/min and 5 m/min. Three lubricants were used: a commercial mineral oil (22 cSt at 100 ºC), a semi-synthetic oil (190 cSt at 100 ºC), and a mineral oil formulated with extreme pressure additives and MoS2 grease, indicated to cold forming processes (69,3 cSt at 100 ºC).
The plug was made with AISI D6 tool steel, quenched and tempered to 52 HC. Plug semi-angle was 5.4º with a nib length of 2 mm. Tube cavity was filled with the same oil used in the die support. Finally the plug was positioned at the work zone and fastened with a stick to the drawing bench structure.
Figure 4. Schematic representation of the die support, dies and tube.
In Figure 4: 1 – tube
2 – first reduction die 3 – die support 4 – second reduction die 5 – load cell
6 – pressure chamber 7 – fixed plug
Experimental Design
To evaluate the drawing force, a random factorial analysis (Montgomery & Runger, 1994) was designed with the following variables:
- Lubricants: commercial mineral oil, semi-synthetic oil, and mineral oil with extreme pressure additives;
- Drawing speed: 1 m/min; 2 m/min and 5 m/min; - Lubrication: Pressurized and not-pressurized.
FEM Analysis
Figure 5 shows the drawn stress (longitudinal stress) obtained from numerical simulation with the Finite Element Method previously discussed. It is seen that the best die semi-angle is found between 7 to 10º for all area reductions simulated (20, 25 and 34,4%).
0 100 200 300 400 500 600 700 800 900
5 7 8,8 10,5 14
Die semi angle (degrees)
D
ra
w
n
S
tr
e
s
s
(
M
P
a
) 34.4% 26.5% 20%
Figure 5. Drawn stress x die semi-angle, predicted with FEM analysis.
Figure 6 shows the variation of equivalent stress for a point located at the outer surface of the tube, since the die entry until a point located 40 mm far from there, during the a drawing pass with 34.4% of area reduction for each die semi-angle simulated. Note that the average equivalent stress is very unstable until beyond 10 mm and thereafter the process becomes stable.
100 250 400 550 700 850
0 5 10 15 20 25 30 35 40
Point position (mm)
E
q
u
iv
al
en
t
S
tr
es
s
(M
P
a)
.
7º 8.8º 10º 14º
J. of the Braz. Soc. of Mech. Sci. & Eng. Copyright 2005 by ABCM October-December 2005, Vol. XXVII, No. 4 /429 In Fig. 7 it is shown the equivalent stress distribuition along the
tube with 34.4% of area reduction, die semi-angle of 7º and friction coefficent of 0.05 to plug-tube and die-tube interface. It can be noticed that there is a great variation of equivalent stress along the die length. Just after the die exit the equivalent stress reaches an uniform value. The inner and outer tube diameters at die exit did not show any significant variation in all simulations.
Figure 7. Equivalent stress distribution along the tube.
Analytical Results
Figure 8 shows the drawing stress variation with die semi-angle for the three area reductions studied where was assumed a Coulomb friction of 0.05 in all interfaces.
It can be seem that the results quite agree with drawn stress obtained from FE analisys. The best die semi-angles again were found between 7º and 10º, as FEM analisys had predicted.
0 200 400 600 800 1000 1200
0 1 2 3 4 5 6 7 8 9 10 11 12 13 14 15 16 Die semiangle (degrees)
D
ra
w
n
S
tr
e
s
s
(
M
P
a
)
34,4% 26,5% 20%
Figure 8. Drawing stress variation with die semi-angle and area reduction, obtained with the upper bound method.
Figure 9 shows the drawing stress for some values of friction coefficient adopted on die-tube interface and plug-tube interface. In curve 1 friction coefficient between die and plug was 0.05 and between tube and plug was 0.0, which represents a tube drawing without a plug. The friction coefficients used in curve 2 were 0.05 and 0.05, respectively. For curve 3, it was adopted 0.1 and 0.05, for curve 4, 0.1 and 0.1 and, finally, for curve 5, 0.05 and 0.1.
As it was expected, drawn stress increases with increasing friction on die-tube interface, as well as increasing friction on
plug-tube interface. However, it can be noticed that drawn stress increases more significantly with an increasing friction on plug-tube interface than on die-tube interface.
0 500 1000 1500 2000 2500
1 3 5 7 9 11
Die semi-angle (degrees)
D
ra
w
n
S
tr
e
ss
(
M
P
a
)
.
Curve 1
Curve 2
Curve 3
Curve 4
Curve 5
Figure 9. Drawn stress calculated with upper bound method varying the die semi-angle and the friction coefficient on die-tube and plug-tube interfaces.
Experimental Results
Figure 10 shows the three observations for drawing force using as lubricant the mineral oil SAE 20W50 and drawing speed of 1 m/min. Figures 11 and 12 shows the drawing force using the same lubricant for speeds of 2 and 5 m/min, respectively.
0 5000 10000 15000 20000 25000
0 3 6 9 12 15 18 21 24 27 30 33
Time (s)
D
ra
w
n
F
o
rc
e
(N
)
.
Figure 10. Measured Drawing Force x time – Lubricant: SAE 20W50 – v = 1 m/min.
0 2000 4000 6000 8000 10000 12000 14000
0 2 4 6 8 10 12 14 16 18
Time (s)
D
ra
w
n
F
o
rc
e
(
N
)
.
0 2000 4000 6000 8000 10000 12000 14000
0 1 2 3 4 5 6 7 8 9 10
Time (s) D ra w n F o rc e ( N )
Figure 12. Measured Drawing Force x time – Lubricant: SAE 20W50 – v = 5 m/min.
It can be seen that during the tests drawing force increases quickly and reaches a steady state. At the end of drawing process, occurs an instantaneous increase of drawing force that can be related to the moment in which the whole tube had passed through the second reduction die, opened the system and the pressure dropped down. The mean drawing force in the pressurized tests is verified from the point where this force reaches a steady state until the point where pressure drops. In not-pressurized tests the mean load is observed from this point till the end of the process.
Figures 13 to 15 show experimental results for the drawing force in tests with the lubricant Renoform MZA 20 and drawing speeds of 1, 2 and 3 m/min, respectively. Here, the transition from pressurized to not-pressurized lubrication can be seen more accuratelly than with the lubricant previously discussed. The effect is greather with the two highest drawing speeds. As in the previous analysis, drawing force increases when the process begins and keeps a steady state till the moment the whole tube passes through the second reduction die. 0 2000 4000 6000 8000 10000 12000 14000 16000 18000
0 5 10 15 20 25 30 35 40
Time (s) D ra w n F o rc e ( N ) .
Figure 13. Measured Drawing Force x time – Lubricant: Renoform MZA 20 – v = 1 m/min.
0 5000 10000 15000 20000
0 2 4 6 8 10 12 14 16 18 20
Time (s) D ra w n F o rc e (N ) .
Figure 14. Measured Drawing Force x time – Lubricant: Renoform MZA 20 – v = 2 m/min.
0 2000 4000 6000 8000 10000 12000 14000 16000
0 1 2 3 4 5 6 7 8
Time (s) D ra w n F o rc e ( N )
Figure 15. Measured Drawing Force x time – Lubricant: Renoform MZA 20 – v = 5 m/min.
Drawing force of tests using as lubricant Extrudoil MOS 319 is shown on Fig. 16 to 18, also with drawing speeds of 1, 2 and 5 m/min. The same caracteristics on drawn force behavior pointed in the previous case can be observed here. Note that behavior can be clearly observed also for drawing speed of 1 m/min. It isn’t so clear with the other lubricants used in this work.
0 2000 4000 6000 8000 10000 12000 14000
0 5 10 15 20 25 30 35
Time (s) D ra w n F o rc e ( N ) .
Figure 16. Measured Drawing Force x time – Lubricant: Extrudoil MOS 319 – v = 1 m/min.
0 2000 4000 6000 8000 10000 12000
0 2 4 6 8 10 12 14 16
Time (s) D ra w n F o rc e ( N ) .
Figure 17. Measured Drawing Force x time – Lubricant: Extrudoil MOS 319 – v = 2 m/min.
0 2000 4000 6000 8000 10000 12000
0 1 2 3 4 5 6 7
Time (s) D ra w n F o rc e ( N ) .
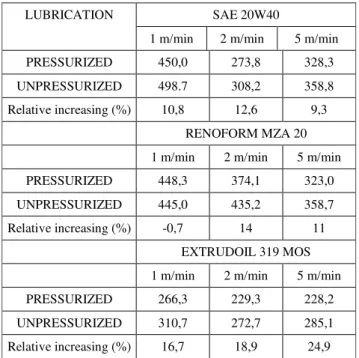
J. of the Braz. Soc. of Mech. Sci. & Eng. Copyright 2005 by ABCM October-December 2005, Vol. XXVII, No. 4 /431 Table 1 shows experimental results of mean drawing force and
the relative increase of this force in pressurized and not-pressurized lubrication conditions. The results indicate that it is possible to achieve a reduction on drawing force around 10% if the pressurized lubrication is established with lubricants mineral oil SAE 20W50 or Renform MZA 20. The reduction on drawing force is more significant with the lubricant Extrudoil MOS 319, more than 16% for any drawing speed tested. Statistical analysis showed that Extrudoil MOS 319, in fact, presents the highest performance to reduces drawing forces. The best drawing conditions are represented by this lubricant, with the highest drawing speed and the pressurized lubrication.
Table 2. Experimental results of the average drawing force.
LUBRICATION SAE 20W40
1 m/min 2 m/min 5 m/min
PRESSURIZED 450,0 273,8 328,3
UNPRESSURIZED 498.7 308,2 358,8
Relative increasing (%) 10,8 12,6 9,3
RENOFORM MZA 20
1 m/min 2 m/min 5 m/min
PRESSURIZED 448,3 374,1 323,0
UNPRESSURIZED 445,0 435,2 358,7
Relative increasing (%) -0,7 14 11
EXTRUDOIL 319 MOS
1 m/min 2 m/min 5 m/min
PRESSURIZED 266,3 229,3 228,2
UNPRESSURIZED 310,7 272,7 285,1
Relative increasing (%) 16,7 18,9 24,9
Conclusions
a. The tool device designed in this work showed to be able to promote pressurized lubrication during tube drawing with fixed plug and, therefore, to reduce drawing forces.
b. The analytical model developed in this work presented drawing stress results in good agreement to those calculated with the finite element method.
c. Lubricant Extrudoil 319 MOS is the most efficient to reduce drawing force in tests with pressurized lubrication;
d. Drawing speeds of 2 and 5 m/min are the best to promote pressurized lubrication and to reduce drawing forces.
Acknowledgement
Authors would like to thank FAPESP – Fundação de Amparo a Pesquisa do Estado de São Paulo for the financial support, MSC.Software Corporation for the software MSC.Superform 2002 and Fuchs do Brasil, that kindly gave us the lubricants Renoform MZA-20 and Extrudoil MOS 319.
References
Avitzur, B. , 1983, “Handbook of metal-Forming Process”. Ed. John Wiley & Sons. N. York, Cap. 9: Tubing and Tubular products.
Brethenoux G at all, 1996, “Cold forming processes: some examples of predictions and design optimization using numerical simulations”. J. of Mat. Proc. Tech., vol. 60 (1-4), pp. 555 – 562.
Button, S.T. , 2001, “Numerical simulation of hydrodynamic lubrication in cold extrusion”, XXII CILAMCE, Anais do Congresso, CD-ROM, Campinas
Chin R.K. and Steif P.S. , 1995, “A computational study of strain inhomogeneity in wire drawing”, Int. J. of Machine Tools & Manufacture, vol. 35 (8), pp. 1087-1098.
Dixit U.S. and Dixit P.M., 1995, “An analysis of the steady-state wire drawing of strain-hardening materials”, J. of Mat. Proc. Tech., vol 47 (3-4), pp. 201 – 229.
El-Domiaty, A.and Kassab, S.Z. ,1998, “Temperature rises in wire drawing”, J. Mat. Proc. Tech., Vol 83, Iss 1-3, pp 72-83.
Karnezis, P. E and Farrugia, D. C. J., “Study of cold tube drawing by finite-element modeling”, J. Mat. Proc. Tech. v. 80-81, 1998, p. 690-694.
Martinez, G.A.S. , 1998, "Comportamento da Lubrificação no Tribo-sistema de Trefilação a Altas Velocidades", Tese de Doutorado, UNICAMP. Jallon, M. e Hergesheimer, M, 1993, ”Prediction of behavior during wire drawing of high-carbon wire”, Revue de Metal.urgie – Cahiers D’informations Techniques, vol. 90, pp. 1303-1309.
Joun M.S. and Hwang S.M., 1993, “Pass Schedule Optimal-Design In Multipass Extrusion And Drawing By Finite-Element Method”. Int. J. Mach. Tools & Manufacture, vol. 33: (5), pp. 713-724.
Montgomery, D.C., Runger, G.C., 1994, Applied Statistics and Probability for Engineers, John Wiley and Sons.
Pawelski, O. and Armstroff, O., 1968, “Untersunchen über das Ziehen von Stalrohren mit fligeden Dorn”, Stahl und Eisen, n. 24, 28, nov, pp. 1348 – 1354.