______________________________________________________________________________________________________
1 Unidade Acadêmica de Ciências Atmosféricas, Universidade Federal de Campina Grande, Campina Grande, PB, Brasil. 2,3 Instituto de Ciências Atmosféricas, Universidade Federal de Alagoas, Maceió, AL, Brasil.
4 Instituto de Geografia e Meio Ambiente, Universidade Federal de Alagoas, Maceió, AL, Brasil.
Article
________________________________________________________________________________________________
Ciências Ambientais Environmental Sciences
Analysis of the Vegetation Density of the Rio Pajeú
Watershed Using TM - LANDSAT 5 Data
Jefferson Aparecido Arestides de Melo 1, Heliofabio Barros Gomes2, Laurizio Emanuel Ribeiro Alves3,
Jadson Arestides de Melo4 & Ianne Lopes de Araujo5
* Corresponding Author: [email protected] Received: June 1, 2017 Todos autores contribuíram de forma igualitária Accepted: June 21, 2017
Published: July, 2017
ABSTRACT
The use of remote sensing products has become a frequent practice in research studying vegetation cover. Vegetation indices based on satellite imagery have been improving in terms of the accuracy in obtaining information about the terrestrial surface, and these techniques have made a solid contribution to the efficiency and reliability of analyses of processes involved in vegetation change. One of the most frequently used vegetation indices is the normalized difference vegetation index (NDVI). The simplicity and high sensitivity to the magnitude of the density of vegetation cover has made it possible to monitor vegetation at local to global scales. The objective of the present work is to analyze the density of vegetation cover of the Rio Pajeú watershed, situated in the mesoregion of the interior region of the State of Pernambuco and the section of the São Francisco River within the State of Pernambuco using TM - Landsat 5 images and the SEBAL algorithm. The results show significant variation in the magnitude of the NDVI classes between 1995 and 2009, and also demonstrate that the methodology used in this study is reliable for NDVI analyses.
Keywords: NDVI, SEBAL, magnitude the classes
Introduction
Environmental studies conducted through the continuous monitoring of vegetation cover help to elucidate the mechanisms that cause changes in the vegetation density of a given region, be they changes caused by natural means or anthropic actions, thus allowing for conservation methods to be applied in areas that are degraded or vulnerable to degradation of their original structures. It is also important to point out that satellite remote sensing is the most objective means of monitoring the earth's surface on a time and space scale, and this practice has already been used in several countries on an operational scale (Leivas, 2008).
The advent of orbital remote sensing has made it possible to monitor the spatial-temporal evolution of changes in the vegetation cover of the Earth's
surface. Several techniques to obtain spectral reflectance were developed to indicate the degree of green of vegetation of the terrestrial surface. SEBAL is one of those techniques that has been widely used in studies to monitor vegetation variation, mainly in the application of the NDVI (Normalized Difference Vegetation Index), whose annual variation indicates the environmental stress caused by the regional climatic impact (Paiva, 2005). The spatial and temporal distribution of the vegetation cover of a region is strongly influenced by a set of environmental factors including climatic conditions, topography, soils and their associated properties. Since vegetation is an indicator of prevailing environmental conditions, changes in its dynamics are useful indicators of variations in these conditions
The use of vegetation indices is very important to objectively understand the dynamics of the mechanisms that cause changes in vegetation
158 | Rev. Geama, Recife – 3 (3): 157-162. Jul-Sep 2017. | Online version ISSN: 2447-0740 | http://www.geama.ufrpe.br cover. In this context, the objective of this study
which was to evaluate, through remote sensing techniques associated with the SEBAL algorithm, the vegetation cover density of the study area, which includes the Pajeú River Basin region, located in the mesoregion of the interior region of the State of Pernambuco and the section of the São Francisco River within the State of Pernambuco (SRH-PE, 2009).
Material and Methods
Study Area
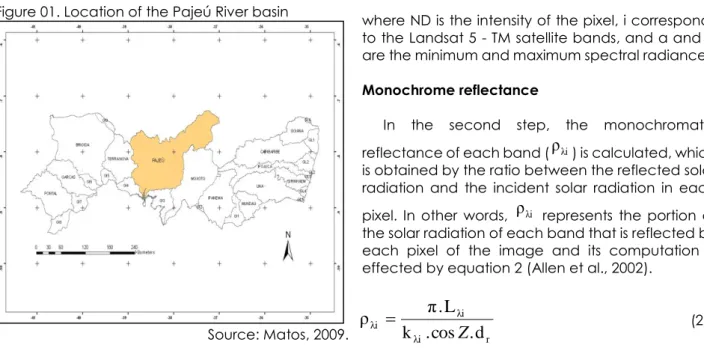
The study area corresponds to the Pajeú River Basin (Figure 01) located in the sub-region of São Francisco in the State of Pernambuco and is located between latitudes 9 ° 27 'and 11 ° 30' South and between longitudes 40 ° 22 ' And 41 ° 30 'West, and extends from the south to the north of the central area of the State, with an area of 16,685.63 km². Its main rivers are the Riacho do Navio (the Ship Stream) and the Pajeú River, which is 347 km long from its source in the municipality of Brejinho in the Serra do Balanço to its mouth at Lake Itaparica on the São Francisco River.
The highest rainfall levels in the basin occur in the northern portion of the middle Pajeú where annual rainfall averages vary from 836.7 mm in Caiçara (in the municipality of Serra Talhada) to more than 1,200 mm in the municipality of Triunfo (SECTMA-PE, 2006). The elevation of the pluviometric indexes in this section of the basin is motivated by the presence of relief with altitudes between 900 and 1,200 m, which constitutes a water divide between the Pajeú and Piancó-Piranhas hydrographic systems and functions at the same time as an orographic barrier for masses of air, carrying moisture which reaches the area.
Figure 01. Location of the Pajeú River basin
Source: Matos, 2009.
Radiometric Data
In order to carry out the study, images generated by the Thematic Mapper - TM sensor on board the Landsat 5 satellite, imaged at approximately 9:30 a.m. local time, were taken in the 215 and 216 orbits at points 65 and 66 corresponding to 4 days, which are: 20 and 27/09/1995, and 13 and 20/11/2009, which refer to Juliano days (DJ) 264 (1995), 271 (1995), 317 (2009) and 324 (2009) respectively. The Landsat 5 - TM images used in the study are composed of seven spectral bands, and were
acquired through the website
www.dgi.inpe.br/CDSR, from the DGI (Division of Image Generation) of INPE (National Institute of Space Research).
The processing of the satellite images (visualization, mosaics, cutouts and classifications) and the mathematical operations used for the intra and inter spectral bands were executed through suitable software. Initially a primary cut was made that encompasses the study area and later a definite irregular cut was made across the Pajeú River Basin region.
Radiometric Calibration
The first computational step of SEBAL is to obtain the radiometric calibration, which consists of the conversion of the digital number (ND), or gray levels of each pixel of the Landsat 5 - TM image, into monochromatic spectral radiance according to the equation proposed by Markham and Baker (1987):
(1).
where ND is the intensity of the pixel, i corresponds to the Landsat 5 - TM satellite bands, and a and b are the minimum and maximum spectral radiances.
Monochrome reflectance
In the second step, the monochromatic reflectance of each band (
ρ
λi) is calculated, which is obtained by the ratio between the reflected solar radiation and the incident solar radiation in each pixel. In other words,ρ
λi represents the portion of the solar radiation of each band that is reflected by each pixel of the image and its computation is effected by equation 2 (Allen et al., 2002).(2).
ND
255
a
b
a
L
i i i λi
r λi λi λid
.
cos
.
k
L
.
π
ρ
Z
where
L
λi is the spectral radiance of each band, λik
is the spectral solar irradiance of each band atthe top of the atmosphere (Wm-2 μm-1), Z is the solar zenith angle, π a constant resulting from the hemispheric integration of spectral radiance, and
r
d
is the square of the average distance betweenthe Earth and the Sun (ro) and the distance between the Earth and the Sun (ro) on a given day of the year (DSA) in astronomical units - AU, given by:
𝑑𝑟 = 1 + 0,033 cos (𝐷𝑆𝐴.3652𝜋) (3). where DSA represents the sequential day of the year (Julian day) and the argument of the cos function is in radians. The mean annual value of dr is equal to 1.00 and it ranges from about 0.97 to about 1.03. When the study area has small or even zero slope the cosine of the angle of incidence of the solar radiation is simply obtained from the angle of elevation of the Sun - E, which is in the image header, that is:
cos 𝑍 = cos (𝜋2− 𝐸) = 𝑠𝑒𝑛(𝐸) (4).
Normalized Difference Vegetation Index – NDVI
The Normalized Difference Vegetation Index (NDVI) was proposed by Tucker (1979), according to (Melo et al., (2013) and Tasumi (2003), and is indicative of the conditions, density and the vegetation size, being obtained by the ratio between the differences of the near infrared (
ρ
IV) and red (ρ
V) reflectances and the sum of the same reflectances, according to equation (Allen et al., 2002).(5).
where
ρ
IV andρ
Vare Landsat 5 - TM bands 4 and 3, respectively.
Results and Discussion
Statistical Values of NDVI Snapshots
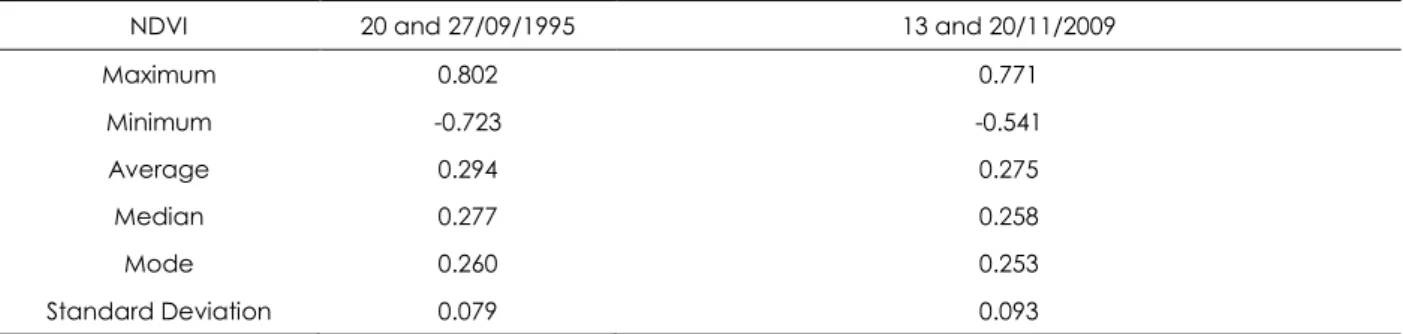
The statistical values of the NDVI charts are presented in Table 1 which shows the maximum, minimum, mean, median, mode and standard deviation for days 20 and 27/09/1995 and 13 and 20/11/2009, of the area corresponding to the Hydrographic Basin of the Pajeú River (BHRP). Negative values represent data corresponding to water bodies. The mean values obtained for the analysis period in the years of 1995 and 2009 were 0.294 and 0.275 respectively. Gomes (2009), in a study carried out in the Vale do Pajeú, Bezerra (2006) in an area of native vegetation in Ceará, and Formigoni et al. (2007) studying in the Brazilian Northeast Caatinga area (NEB), found NDVI values of the order of 0.257, 0.220 and 0.250 respectively, which are close to those obtained in this work.
The maximum values observed were 0.802 (1995) and 0.771 (2009) demonstrating a decrease in the vegetative density of the region, which can be verified by analyzing the NDVI thematic charts for the two periods. Lopes (2003) used images captured in 2000 and 2001 by TM Landsat 5 in a study conducted in the irrigation perimeter of Senator Nilo Coelho and found NDVI values equal to 0.750 and 0.780 in the respective years. However, when the histograms of these dates are visualized, a discrete presence of such maximum values is observed, and therefore these data can be considered unrepresentative of the analysis of the density of the green vegetation of the Pajeú River Basin.
Table 1. Values of the maximum, minimum, mean, median, mode, and standard deviation statistical parameters obtained in the statistical analysis of the Normalized Difference Vegetation Index - NDVI (Author, 2013).
NDVI 20 and 27/09/1995 13 and 20/11/2009
Maximum 0.802 0.771 Minimum -0.723 -0.541 Average 0.294 0.275 Median 0.277 0.258 Mode 0.260 0.253 Standard Deviation 0.079 0.093
Theoretically, the values for NDVI vary from -1 to 1, and analyzing the statistical values of Table 1, it is observed that the instantaneous values of NDVI ranged from -0.723 to values close to 0.800 for days 20 and 27 / 09/1995 while for days 13 and 20/11/2009 the values observed were in the range of -0.542 to 0.771.
NDVI Thematic Mapping
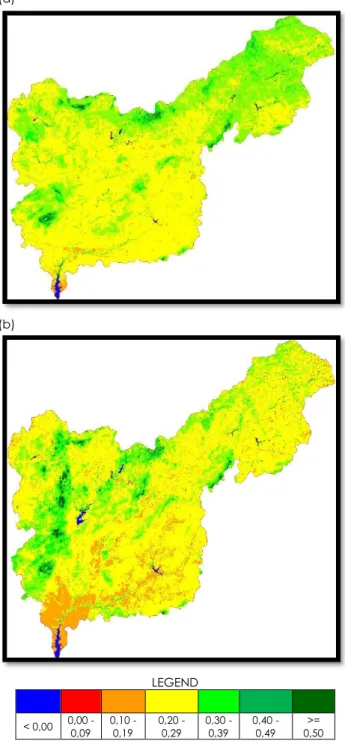
Figure 2 shows the generated product with NDVI values for the scene extracted from Landsat TM-5 satellite images for days 20 and 27/09/1995 (a), and 13 and 11/20/2009 (b). Negative values of NDVI referring to water bodies (streams, rivers, lakes) and
V IV V IV
ρ
ρ
ρ
ρ
IVDN
160 | Rev. Geama, Recife – 3 (3): 157-162. Jul-Sep 2017. | Online version ISSN: 2447-0740 | http://www.geama.ufrpe.br moist soils can be observed in the thematic maps in
blue color. Silva et al. (2009) found values -0.30 and -0.33 for the years 2000 and 2001 respectively for Sobradinho Lake and values of the order of 0.16 and 0.17 for soils exposed in the same experiment. NDVI values close to zero tend to represent exposed soil, usually ranging between 0.05 and 0.30, however, a fixed range cannot be defined for NDVI values for soils with little or no vegetation cover (or / and with little photosynthetic activity), due to the great variability of optical properties of soil (Melo et al., 2013, Huete, 1988 and Tucker, 1979).
Figure 02. Thematic map of NDVI for days 20 and 27/09/1995 (a) and 13 and 20/11/2009 (b) obtained through the TM sensor of Landsat 5. (Author, 2013).
(a)
(b)
LEGEND
< 0,00 0,00 - 0,09 0,10 - 0,19 0,20 - 0,29 0,30 - 0,39 0,40 - 0,49 0,50 >= The average NDVI indexes, observed in Table 2, correspond to the characteristics of a low density of vegetation, consistent with that expected for a
semi-arid region. The classification of the vegetative classes of the study region is composed by seven colors, followed by the model proposed by Gomes (2009) where the colors are related to the magnitudes of the greenery of the vegetation, that is, for each class interval of NDVI a color is attributed and distributed according to the characteristics of the region, except for the blue color, which is used for bodies of water.
On the 13th and 20th of November, the region has little vegetation coverage in most of the study area (Figure 2b), presenting a variation of NDVI in the range of -0.542 and 0.771], with mean values of 0.275. On days 20 and 27/09/95 (Figure 2a) there is a large area with a dense vegetation cover and a significant area to the north with vegetation of transitory order, with intervals varying between -0.723 and 0.802], with average values of 0.294. Shilpakar (2003) using remote sensing techniques in research in the Rapti River Basin, Nepal, found NDVI values between -0.55 and 0.70 in forest areas and 0.65 in areas cultivated with maize; in the areas of exposed soils this index reached 0.17.
In the comparison between the two periods in the current study, we highlight the presence of two regions where NDVI values are high and similar between the dates studied. These are the cities of Triunfo-PE, a locality belonging to the Caatinga moist-forest enclave ecoregion, and Carnaíba-PE and Flores-PE. The three cities stand out initially because they have an altitude of more than 800m, which constitutes a water divide for the Pajeú hydrographic system, and due to the high altitude they are localities with different pluviometric regimes in relation to the means found in the Brazilian semi-arid region at lower altitude. These factors provide the cities mentioned above with a greater but uneven availability of water, placing them in a prominent position for the production of agricultural crops. This justifies the marked presence of dense and similar vegetation cover between the two studied periods.
By dividing the vegetation cover classes of the BHRP a significant decrease in the density of green vegetation was detected throughout the BHRP. However, in contrast to the tendency to lose vegetation volume that occurred in practically all of the basin area, the region downstream of the Serrinha dam, located in the municipality of Serra Talhada, showed an increase in its vegetation cover, justified basically by the water availability provided by the dam, construction of which started in 1955 and was inaugurated on March 29, 1996. Built with the goal of mitigating the effects of drought in the Pajeú region, it is an important pole for subsistence fishing and livestock raising for the surrounding population of the dam, and being strategically located it has become responsible for the perpetuation of the Pajeú River, which is the main river of the Pajeú River Basin.
161 |
Table 2. NDVI classes attributed to vegetation characteristics (Author, 2013).
Color Interval Vegetation characteristics in relation to the NDVI index
Blue < 0.00 Bodies of water
Red 0.00 – 0.09 Bare soil with little or no vegetation Orange 0.10 – 0.19 Vegetation in an initial stage of emergence
Yellow 0.20 – 0.29 Sparse vegetation cover
Green 0.30 – 0.39 Transition between areas of sparse and dense vegetation
Light Green 0.40 – 0.49 Dense vegetation cover
Dark Green >0.50 Extremely dense vegetation cover
Conclusions
The environmental analyses in this work carried out through studies on the condition of vegetation cover from vegetation indexes (NDVI) can be considered satisfactory since they have identified effects that influence the development, or lack thereof, of the vegetative structure of the Pajeú River Basin.
When comparing the thematic maps of the images, referring to the calculations of NDVI for days 20 and 27/09/95 and 13 and 20/11/09 for BHRP, the temporal spatial variability of the vegetation cover density of the area of study is clearly visible. Through these observations this analysis detected regions with vegetative deficit, localities with increased vegetation cover classes and areas where vegetation remained constant between the evaluated periods.
This analysis also observed points where particular characteristics (altitude, precipitation, and climate) produced similar results with respect to the magnitude of the ground cover between the periods analyzed. The NDVI estimate for the BHRP presented a satisfactory result regarding the representation of vegetation greenness of the studied region, demonstrating the efficiency of the use of remote sensing techniques associated to the SEBAL algorithm. The application of methodology similar to that used in this work is recommended in other studies that contemplate vegetation cover in watersheds, preferentially in other biomes, with the purpose of evaluating the efficiency of the method in estimating the variation of the greenness of the vegetation of such regions.
Acknowledgement
Agradeço à Coordenação de
Aperfeiçoamento de Pessoal de Nível Superior (CAPES), pela bolsa de Doutorado.
References
ALLEN, R., TASUMI, M. & TREZZA, R. SEBAL Surface Energy Balance Algorithm for Land – Advanced Training and Users Manual – Idaho Implementation, version 1.0. 2002.
BEZERRA, B. G. Balanço de energia e evapotranspiração em áreas com diferentes tipos de cobertura de solo no cariri cearense através do algoritmo SEBAL. 2006. 127 f. Dissertação (Mestrado em Meteorologia) – Universidade Federal de Campina Grande, Campina Grande, 2006.
FORMIGONI, M. H., QUARTO, J. P. & XAVIER, A. C. Análise temporal de área irrigada e caatinga na região de Petrolina por meio de dados EVI do MODIS. In: SIMPÓSIO BRASILEIRO DE SENSORIAMENTO REMOTO, Florianópolis. Anais… INPE, 2007, p.1667-1669. 2007.
GOMES, H. B. Balanços de radiação e energia em áreas de cultura de cana-de-açúcar e cerrado no estado de São Paulo mediante imagens orbitais. 2009. 112 f. Tese (Doutorado em Meteorologia) – Universidade Federal de Campina Grande, Campina Grande, 2009.
HUETE, A. R. A soil-adjusted vegetation index (SAVI). Remote Sensing of Environment, New York, v.25, p.295-309. 1998.
LEIVAS, J. F. Uso de técnicas de sensoriamento remoto na estimativa do balanço de radiação na superfície. 2008. 100 f. Tese (Doutorado em Agronomia) – Universidade Federal do Rio Grande do Sul, Porto Alegre, 2008.
LOPES, G. M. Balanço de Radiação em Áreas Irrigadas Utilizando Imagens Landsat 5 - TM. 2003. 123 f. Dissertação (Mestrado em Meteorologia) – Universidade Federal de Campina Grande, Campina Grande, 2003.
162 | Rev. Geama, Recife – 3 (3): 157-162. Jul-Sep 2017. | Online version ISSN: 2447-0740 | http://www.geama.ufrpe.br MARKHAM, B. L.; BARKER, L. L. Thematic mapper
bandpass solar exoatmospherical irradiances. International Journal of Remote Sensing, v.8, n.3, p.517-523. 1987.
MATOS, R. C. M. Contribuição do MODIS no monitoramento ambiental de bacias hidrográficas. 2009. 83 f. Dissertação (Mestrado em Ciências Geodésicas e Tecnologias da Geoinformação) – Universidade Federal de Pernambuco, Recife, 2009.
MELO, J. A. A., CARNEIRO, R. G. & AZEVEDO, C. D. S. Análise do índice de vegetação da diferença normalizada para cidade de Boca da Mata/AL utilizando imagens do satélite Landsat 5 TM e o algoritmo SEBAL. 2013. In: XVIII Congresso Brasileiro de Agrometeorologia, 15, Belém-PA. 2013.
PAIVA, C. M. Estimativa do balanço de energia e da temperatura da superfície via satélite NOAA-AVHRR. 2005. 248 f. Dissertação (Doutorado em Engenharia Civil) - Universidade Federal do Rio de Janeiro, Rio de Janeiro, 2005.
SECRETARIA DE CIÊNCIA, TECNOLOGIA E MEIO AMBIENTE (SECTMA-PE). Atlas das Bacias Hidrográficas de Pernambuco. Recife. 2006. Acesso em 17/05/2017. Disponível em: http://www.secti.pe.gov.br/
SECRETARIA DE RECURSOS HÍDRICOS (SRH-PE). Bacia do rio Pajeú. 2009. Acesso em 29/05/2017.
Disponível em:
http://www.sirh.srh.pe.gov.br/site/bacia_rio_paje u.php.
SHILPAKAR, R. L. Geo-information procedure for water accounting: A case of the East Rapti River Basin, Nepal. 2003 (Master of Science Thesis), The Netherlands. International Institute for Geo-information Science and Earth Observation. 2003. SILVA, B. B., MENDONÇA, R. R. O., SILVA, S. T. A. &
BEZERRA, B. G. Obtenção do albedo e IVDN em áreas heterogêneas do estado do Ceará com imagens TM-Landsat 5 e algortimo SEBAL/METRIC. 2009. XIV Simpósio Brasileiro de Sensoriamento Remoto, p. 475-483. 2009.
TASUMI, M. Progress in operational estimation of regional evapotranspiration using satellite imagery. 2003. PhD thesis, (Biological and Agricultural Engineering) – University of Idaho. Idaho. 2003.
TUCKER, C. J. Red and photographic infrared linear combinations for monitoring vegetation. Remote Sensing of Environment, New York, v.8, n.2, p.127-150. 1979.
TUCKER, C. J., TOWNSHEND, J. R. G. & GOFF, T. E. African landcover classification using satellite data. Science. v. 227, p. 369-375. 1985.