Vol.47, n. 1 : pp. 71-76, March 2004
ISSN 1516-8913 Printed in Brazil
BRAZILIAN ARCHIVES OF
BIOLOGY AND TECHNOLOGY
A N I N T E R N A T I O N A L J O U R N A L
Physico-Chemical and Cooking Characteristics of Some Rice
Varieties
Rolando J González
1∗, Alberto Livore
2and Brigitte Pons
31 Instituto de Tecnologia de Alimentos; Fac. de Ing. Química;Universidad Nacional del Litoral; Ciudad
Universitaria “Paraje El Pozo”; Cc 266; 3000; Santa Fe - Argentina. 2 INTA; Concepción del Uruguay; Entre Ríos - Argentina. 3 Centre de Coopération International en Reserche Agronomique pour le Développment; Départements des Cultures Annuelles; Maison de la Technologie; BP 5035; Montpellier Cedes I - France
ABSTRACT
Some physicochemical and cooking characteristics corresponding to different varieties and commercial samples of rice were analysed. Some mechanical properties determined by both, the viscoelastograf and the InstromUniversal Food Testing Machine were also analysed. Gelatinization time (Gt), gelatinization endotherm and amylose content were determined. The results showed that there was a very good correlation between gelatinization temperature and Gt, while no noticeable correlation among others phsycochemical characteristics was observed. Regarding the mechanical properties, both methods permited to show significant differences among most of the samples. However, when the samples order obtained with hardness (Instrom) values was compared with that corresponding to firmness (Viscoelastograf) values, some discrepancies were observed. This could be attributable to the number of grains and the cooking time used in each method. There was good linear correlation between hardness and amylose content. On the contrary, none of the viscoelastograf parameters are correlated well with amylose. An interesting point was that the slope of the regression line obtained between firmness and cooking time could be utilised as a measure of cooking resistance of each sample and was related to the rate of water absorption.
Key words: Rice quality, amilose, hardness, firmness, cooking time, gelatinisation
∗ Author for correspondence
INTRODUCTION
Rice is consumed principally as a whole grain and, therefore, the texture of the whole grain is a matter of primary importance. Different cultivars of waxy and non-waxy rice are usually classified according to their grain dimensions, amylose content, amylograph consistency, gelatinisation properties of the extracted starches and the texture (from both Instrom hardness and sensory measurements) of cooked rice (Juliano, 1982; Juliano, 1985).
Texture is an important attribute of food acceptance by consumers and as such, a critical
step in quality assessment. Texture is defined as “the sensory manifestation of the structure of food and the manner in which that structure reacts to applied force” (Szczesnick, 1968). Rice texture is affected by factors such as rice variety, amylose content (AM), gelatinisation temperature (GT) and processing factor ( Meullenet et al.,1998).
methods, relationships between sensory and physicochemical properties are determined, allowing assessment of sensory quality for a target population or application (Champagne, 1997). Preference patterns may be a function of cultural and social factors (such as situations of usage, attitudes towards cooking), individual factors (sociodemographic characteristics, involvement and expertise in food, innovativeness, broad sensitivity) and product attributes (sensory dimensions like aspect, flavour and texture are paramount), but they are seldom included in marketing experiments because of the difficulties encountered in “objectivating” consumer assessments. Other attributes are important, some related to services attached to the product (easy cooking, packaging), other more related to image (brand origin of product) (Francois et al., 1997). Preference in matter of appearance, taste and texture are very variable from one consumer to another, some of them prefer the aromatic rice and the raw milled rice, others like the parboiled rice and others the most conventional rice (Martin et al., 1997 ).
Another important aspect is the relationship between price and quality. Rice standard do not fully explain price variations, other quality criteria such as cooking, that are not incorporated into rice standard also contribute to price differentials. People from different region have different taste and preferences. The term rice standard refers to those characters related to traditional criteria, and the term rice quality includes cooking quality (Juliano and Kaosa, 1991).
The objective of this work was to evaluate the cooking properties of different good quality rice varieties and their relation with some physico-chemical characteristics and mechanical properties of cooked rice.
MATERIALS AND METHODS
Eight rice varieties, milled by standard method and characterized by their amylose and alcaly test values (Table 1) were provided by the Instituto Nacional de Tecnologia Agropecuaria (INTA - Concepción del Uruguay - Argentina). These samples were used for the evaluation of some physico-chemical and cooking characteristics and mechanical properties. Four commercial samples (two of them were parboiled rice) taken from the
market were also included in the evaluation: Fortuna, Barbara, Barbara Parboiled and Quick (another parboiled trade mark). Following determinations were carried out:
Amylose content (AM), gelatinization temperature or onset temperature (GT), pick temperature (PT) and gelatinization enthalpy (∆H) were obtained by DSC (Mestres et al., 1996) andthe values reported are means of duplicates.
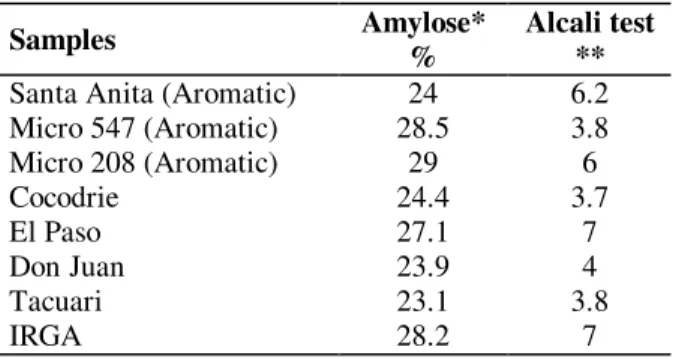
Table 1 - Characteristics of the selected varieties
Samples Amylose*
%
Alcali test ** Santa Anita (Aromatic) 24 6.2 Micro 547 (Aromatic) 28.5 3.8 Micro 208 (Aromatic) 29 6
Cocodrie 24.4 3.7
El Paso 27.1 7
Don Juan 23.9 4
Tacuari 23.1 3.8
IRGA 28.2 7
*Juliano method (1971); **Little et al (1958).
Gelatinization time (Gt) was evaluated by the French Standard (Norme Francaise, 1999). Viscoelasticity properties: Firmness (F) and Absorption (Abs) were determined by the Viscoelastograf according to the French Standard (Norme Francaise, 1993). Cooked rice hardness,
(average pressure, P), by an Instrom Universal Food Testing Machine (Model 1140) using an Ottawa Texture Measurement System Cell, with a cooking time of 20 minutes and according to Rousset et al. (1995). ANOVA were made using the LSD method for 95% confidence limit.
RESULTS AND DISCUSSION
DSC and Gelatinization time
Table 2 - DSC results and Gelatinization Time
Samples AM (%)
(DSC)
GT (ºC) (DSC)
PT (ºC) (DSC)
∆∆∆∆H (J/g) (DSC)
Gelatinisation Time Gt (min)
Santa Anita (Aromatic) 21.3 68.6 76.4 9.19 16
Micro 547 (Aromatic) 25.1 71.4 78.7 9.17 14.5
Micro 208 (Aromatic) 25.4 70.6 77.9 10.3 16.5
Cocodrie 22.8 70.4 78.0 9.9 16
El Paso 26.7 58 67.0 9.24 13
Don Juan 20.5 72.2 79.6 10.4 16.5
Tacuari 21.4 71.5 78.6 9.93 15.5
IRGA 25.0 58.6 67.2 7.25 12.5
Fortuna 18.0 58.2 68.8 11.1 15.5
Barbara 24.2 61.6 70.1 9.81 15
Barbara Parboiled 24.2 --- --- --- 16
Parboiled Quick 22.9 --- --- --- 15
AM: amilose; GT: gelatinization temperature; PT: peak temperature
The others possible correlations to be made were very poor, the only one to be mentioned was between pick temperature (PT) and GT (r = 0.69). The traditional inverse correlation between alkali test and GT was very poor.
Juliano (1990) pointed out that the methods used for quality assessment (amylose, alkali test, etc) were inadequate for rice of similar amylose content.
Instrom results
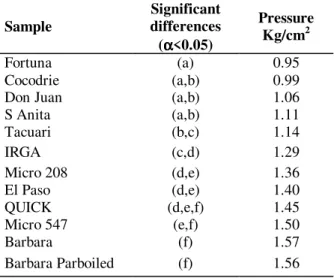
Table 3 shows the pressure values from the Instrom (including the ANOVA results) for the cooked rice. The ANOVA indicateed that there were significant differences among groups of samples: Fortuna, Cocodrie, Don Juan and S.Anita were the softest while Quick, Micro 547, Barbara and Barbara Parboiled were the hardest. There was good linear correlation between Pressure and Amylose content, which was better when AM from DSC was used. The corresponding parameters are shown in Table 4 (Pressure was the dependent variable and AM by DSC was the independent variable. The ANOVA indicated that the standard error of the estimation wass 0.10266 and the correlation coefficient was r = 0.871. These results were in agreement with those of Juliano (1998).
Viscoelastograf results
Table 5 shows the ANOVA results for Firmness and the slope of the linear regression with the cooking time. As in the case of Instrom pressure, there were significant differences among groups of samples. Tacuari was the softest one followed by Cocodrie and Micro 547. These three samples
could be considered as the softest group, which was also those with the highest absorption, while the firmest were the parboiled samples (Barbara Parboiled and Quick).
Table 3 - Instron Pressure mean values
Sample
Significant differences (αααα<0.05)
Pressure
Kg/cm2
Fortuna (a) 0.95
Cocodrie (a,b) 0.99
Don Juan (a,b) 1.06
S Anita (a,b) 1.11
Tacuari (b,c) 1.14
IRGA (c,d) 1.29
Micro 208 (d,e) 1.36
El Paso (d,e) 1.40
QUICK (d,e,f) 1.45
Micro 547 (e,f) 1.50
Barbara (f) 1.57
Barbara Parboiled (f) 1.56
Table 4 - Regression analysis.
Intercept Slope
Estimate -0.173 0.0599
Standard error 0.2948 0.01278
T value -0.5883 4.687
Prob. level 0.575 0.00224
Pressure (Instrom) = f (AM); = a + bx
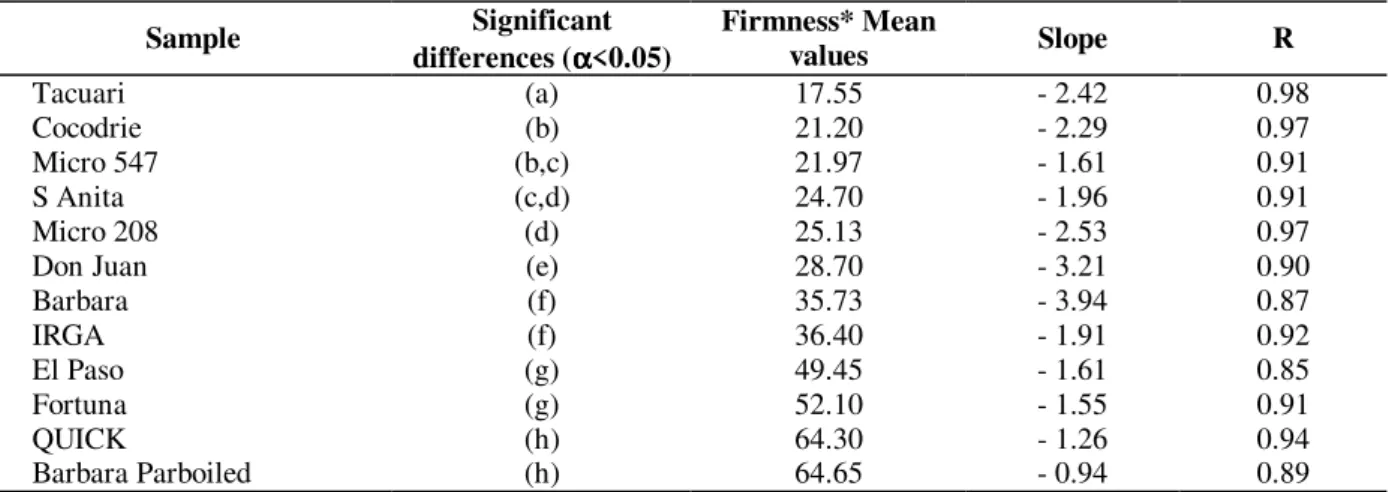
Table 5 - ANOVA results. Firmness mean values at their Gt and slope of the linear regression, for Firmness vs cooking time
Sample Significant
differences (αααα<0.05)
Firmness* Mean
values Slope R
Tacuari (a) 17.55 - 2.42 0.98
Cocodrie (b) 21.20 - 2.29 0.97
Micro 547 (b,c) 21.97 - 1.61 0.91
S Anita (c,d) 24.70 - 1.96 0.91
Micro 208 (d) 25.13 - 2.53 0.97
Don Juan (e) 28.70 - 3.21 0.90
Barbara (f) 35.73 - 3.94 0.87
IRGA (f) 36.40 - 1.91 0.92
El Paso (g) 49.45 - 1.61 0.85
Fortuna (g) 52.10 - 1.55 0.91
QUICK (h) 64.30 - 1.26 0.94
Barbara Parboiled (h) 64.65 - 0.94 0.89
* Firmness is the height ratio of the compressed and uncompressed rice.
Pressure, was included in the group of samples with high Firmness. This effect could be explained on the basis that in the viscoelastograf only three grains were put on the machine plate and those with the highest width (Fortuna was the only one wide type variety, among samples) gave higher Firmness values. On the other hand Barbara, with high pressure values showed intermediate Firmness and Don Juan with minimum pressure values showed intermediate Firmness. These discrepancies could be due to the different cooking time used in each method, (20 min. in the Instrom one and Gt in the Viscoelastograf) and consequently the amount of water uptaken were not comparable. Another aspect to be considered was the effect of surface area on the water absorption (Bhattacharya, 1979). An interesting point was the analysis of the decreasing rate of Firmness with cooking time, which was measured by the slope of the regression line. It was possible to classify the samples in four groups: a) High decreasing rate (Barbara and Don Juan), b) intermediate decreasing rate (Micro 208, Tacuari, Cocodrie, S Anita and Irga), c) Low decreasing rate (El Paso, Micro 547 and Fortuna) and d) very low decreasing rate (Quick and Barbara P). The slope of the regression line could be used to select varieties with a desired cooking resistance, for example, excluding the parboiled samples (which showed the lowest decreasing rate), El Paso and Fortuna (with high Firmness) showed low decreasing rate and consequently high cooking resistance. On the other hand, Barbara and Don Juan (with intermediate Firmness) showed the
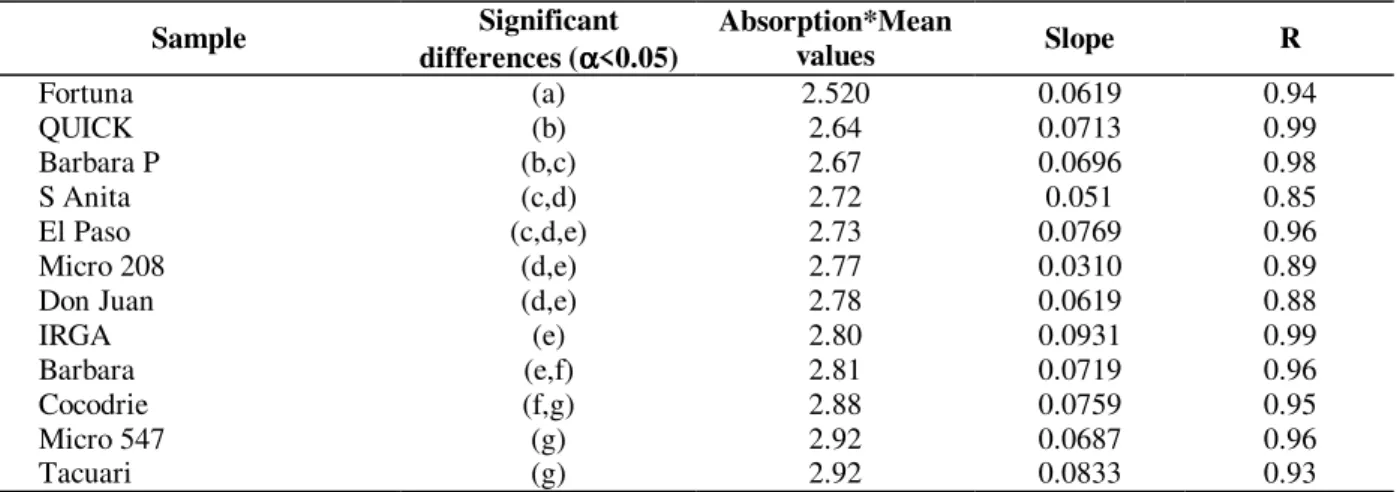
highest decreasing rate, hence their low cooking resistance could be a negative effect on Firmness. Table 6 shows the ANOVA results for Absorption, mean values at the Gt and the slope of the linear regression with the cooking time. It was observed that Tacuari, Micro 547 and Cocodrie showed the highest absorption, being in agreement with the lowest Firmness. Among these three samples, Tacuari showed the highest increasing rate of absorption. On the other hand, Fortuna and the two parboiled samples showed the lowest absorption with intermediate increasing rate of absorption. An interesting case was Irga that having the lowest Gt and intermediate Firmness and Absorption showed a high absorption increasing rate.
Finally, no correlation was fount between the viscoelastograf parameters with amylose, but there was a negative linear correlation between Firmness and Absorption with a correlation coefficient, r = -0.73.
Table 6 - ANOVA results: Absorption means values at their Gt and slope of the linear regression, for Absorption vs cooking time
Sample Significant
differences (αααα<0.05)
Absorption*Mean
values Slope R
Fortuna (a) 2.520 0.0619 0.94
QUICK (b) 2.64 0.0713 0.99
Barbara P (b,c) 2.67 0.0696 0.98
S Anita (c,d) 2.72 0.051 0.85
El Paso (c,d,e) 2.73 0.0769 0.96
Micro 208 (d,e) 2.77 0.0310 0.89
Don Juan (d,e) 2.78 0.0619 0.88
IRGA (e) 2.80 0.0931 0.99
Barbara (e,f) 2.81 0.0719 0.96
Cocodrie (f,g) 2.88 0.0759 0.95
Micro 547 (g) 2.92 0.0687 0.96
Tacuari (g) 2.92 0.0833 0.93
* Absorption is the weight ratio of cooked and uncooked rice.
The evaluation of the present group of varieties would need also others methodologies such us chain length analysis of the amylopectin branches, as it was pointed out by Ong and Blanshard (1995) that with the diversification of cultivars of rice, properties of cooked rice were becoming less predictable. The classical relationships between the amylose (AM) content or grain dimensions and the final properties of cooked rice were not always followed. For example, rice with higher amylose and more long chain amylopectin (AP) tend to have hard cooking properties, whereas rice with lower amylose content and shorter chain amylopectin tend to have a softer texture. The longer AP chain behave like an amylose chain or branched form of amylose, which suggest that the longer chains of starch whether from AM, AP or intermediate material could be responsible for the texture of rice.
Furthermore with the increasing knowledge of the structure of starch granules and the starch fractions, new screening methods to evaluate properties such as AP staling would evolve. Gel consistency (GC) has been shown to be mainly due to AP. Hard GC corresponds mainly to longer chain lengh AP, common in low GT, high AM content rice. Advances in the knowledge of granules structure and fine structure of AP and AM should facilitate the development of simple test that measure varietal difference in AP staling (Juliano, 1997).
CONCLUSION
There was very good correlation between gelatinization temperature and gelatinization time. There were good linear correlation between Instrom Pressure (Hardness) and amylose content, which was better when AM from DSC was used. With regard to the Viscoelastograf results, no good correlation were found between the viscoelastograf parameters with amylose, but there is a negative linear correlation between Firmness and Absorption. The slope of the regression line obtained with Firmnes vs cooking time, could be used to select varieties with a desired cooking resistance, for example excluding the parboiled samples (which showed the lowest decreasing rate), El Paso and Fortuna (with high Firmness) showed low decreasing rate and consequently high cooking resistance. On the other hand, Barbara and Don Juan (with intermediate Firmness) showed the highest decreasing rate, so the low cooking resistance would impair the Firmness.
A Sensory texture Profile and Consumer Preferences Analysis should be done as second steps of the Cooking Quality Evaluation and a comparison with the cooking test should be done for this group of varieties.
ACKNOWLEDGMENTS
RESUMO
Oito variedades e quatro amostras comerciais de arroz de boa qualidade foram analisadas com relação a algumas características físico-químicas e de cozimento. Algumas propriedades mecânicas foram avaliadas utilizando-se tanto o viscoamilógrafo como o equipamento Instron (Instron Universal Testing Machine), tais como, o tempo de gelatinização (Gt), a endoterma de gelatinização e o conteúdo de amilose. Os resultados mostraram que existe uma boa correlação entre a temperatura de gelatinização e Gt, contudo não foi observada correlação relevante entre outras características físico-químicas. Em relação às propriedades mecânicas, ambos os métodos permitiram mostrar significantes diferenças entre algumas amostras. Existe uma boa correlação linear entre dureza e conteúdo de amilose, por outro lado, nenhum dos parâmetros viscoelastográficos apresentaram boa correlação com a amilose. Um ponto interessante é que a inclinação da reta de correlação linear obtida entre firmeza e tempo de cozimento pode ser utilizada como uma medida da resistência ao cozimento de cada amostra e relacionada à taxa de absorção de água.
REFERENCES
Bhattacharya, K. R. (1979), Gelatinization temperature of rice starch and its determination. In: Proceedings of the Workshop on Chemical Aspects of Rice Brain Quality. Los Baños, Philippines : IRRI. pp. 232-249. Champagne, E. T. (1997), Rice quality criteria for new uses. In: International Symposium in Rice Quality. Nothingan. pp. 24-27.
Francois, D.; Aurier, P. and Siriex, S. (1997), A sensory approach to consumer’s preferences for rice. First results of a European survey. In: International Symposium in Rice Quality. Nothingan. pp. 24-27. Norme Francaise, (1999), NF, ISO 6648, octobre,
1993: Détermination des propriété viscoélastiques á différents temps de cuisson.
Norme Francaise, (1999), NF, ISO 14864 , march 1999: Evaluation du temps de gelatinization lors de la cuisson des grains.
Juliano B. (1998), Varietal impact on rice quality. Cereal Foods World, 43, 207-222.
Juliano B. (1997), Rice Quality for the Future. In: International Symposium in Rice Quality. Nothingan. pp. 24-27.
Juliano B. and Kaosa M. (1991), Assesing rice quality characteristics and prices in selected international markets. In: Rice Grain Marketing and Quality Issues. Manila, Philippines : IRRI. pp. 23-35. Juliano, B. (1990), Rice grain quality: Problems and
Challenges. Cereal Foods World, 35, 245-253. Juliano, B. (1985), Criteria and tests for rice grain
qualities. In: Rice Chemistry and Technology, Chapter 12. Minnesota : AACC. pp. 443-514. Juliano, B. (1982), An International Survey of methods
used for evaluation of the cooking and eating qualities of milled rice. IRRI Researchpaper series number 77. Los Baños, Laguna, Filipinas. pp. 1-27. Juliano, B. (1971), A Simplified Assay for Milled-Rice
Amylose. Cereal Sci Today, 16, 334-336.
Little R. R.; Hilder G. B. and Dawson E. H. (1958), Differential Effect of Dilute Alcali on 25 varieties of Milled White Rice. Cereal Chem., 35, 111-126. Martin, J. F.; Rousset, S.; Pons, B. and Rousseau, F.
(1997), Sensory profile of cooked rice and consumer preferences. In: International Symposium in Rice Quality. Nothingan. pp. 24-27.
Mestres, C.; Matencio, F.; Pons, B.; Yajid, M. and Fliedel, G. (1996), A rapid Method for the determination of Amylose content by using differential scanning calorimetry. Starch, 48, 2-6. Meullenet J. F. C.; Gross J.; Marks B. P. and Daniels
M. (1998), Sensory descriptive texture analyses of cooked rice and its correlation to instrumental parameters using an extrusion cell. Cereal Chemistry, 75, 714-720.
Ong, M. H. and Blanshard, J. M. (1995), Texture determinants in cooked, parboiled rice. I: Rice starch amylose and the fine structure of amylopectin. Journal of Cereal Science, 21, 251-260.
Rousset, S.; Pons, B. and Pilandon, C. (1995), Sensory texture profile, grain physico-chemical, characteristics and instrumental measurements of cooked rice. Journal of Texture Studies, 26, 119-135. Szczesniak, A. S. (1968), Correlations between objective and sensory texture measurements. Food Tech., 22, 981-98.