Brazilian Microwave and Optoelectronics Society-SBMO received 18 Sep 2017; for review 20 Sep 2017; accepted 28 Dec 2017
Brazilian Society of Electromagnetism-SBMag © 2018 SBMO/SBMag ISSN 2179-1074 Abstract— This work presents a performance analysis of probe-fed
circularly-polarized moderately-thick microstrip patch antennas. Five typical geometries are designed according to the null reactance condition. A nonlinear regression, based on HFSS simulations, is implemented in order to identify the most robust geometry, regard-ing the manufacturregard-ing process. The analysis focus is on broadside axial ratio degradation and frequency deviation parameters. Experi-mental results validate the proposed approach and the nonlinear regression calculations.
Index Terms—microstrip antennas; circular polarization; axial ratio; input impedance matching, nonlinear regression.
I.
INTRODUCTIONMicrostrip antennas have been widely used in communication systems due to their many advantages, such as low profile, compatibility with integrated circuit technology, and conformability to a shaped
surface. The conventional probe-fed linearly-polarized antenna, comprising a metallic patch printed on top of a thin grounded dielectric layer, is certainly the most popular radiator [1]-[5]. However, this basic
structure can only handle low power and operates over a narrow frequency range. A simple way to overcome these limitations would be the use of a thick substrate [6]. Unfortunately, thick-substrate
probe-fed antennas, designed according to the standard procedure (modes TM01 and TM10 excited at the same intensity and approximately equidistant from the operating frequency) [7], exhibit a highly inductive input impedance that cannot be properly matched to a 50- SMA connector [8]. On the other
hand, mobile devices require circularly polarized (CP) patches with good impedance matching, as well as broadside axial ratio, at the frequency of interest [9]. Different approaches have been used to fulfill
this requirement [1]-[4], [9]-[11]. Based on [10], a new efficient and easy to implement approach, coined as the null reactance condition, is proposed. Thus, the antenna input impedance reactance can be
compensated by acting simultaneously on the probe position and the patch dimensions with no additional matching circuit. In [12], this approach is applied for designing CP antennas with rectangular
and truncated-corner rectangular (TCR) patches, with excellent results.
Using the strategy mentioned above, CP antennas with elliptical, elliptical with perturbation (EWP)
Performance Analysis of Probe-Fed
Circularly-Polarized Moderately-Thick
Microstrip Antennas Designed under the Null
Reactance Condition
D. C. Nascimento, B. M. Fabiani, and J. C. S. Lacava
Laboratório de Antenas e Propagação - LAP, Instituto Tecnológico de Aeronáutica 12228-900 São José dos Campos, SP, Brazil
Brazilian Microwave and Optoelectronics Society-SBMO received 18 Sep 2017; for review 20 Sep 2017; accepted 28 Dec 2017
Brazilian Society of Electromagnetism-SBMag © 2018 SBMO/SBMag ISSN 2179-1074 and triangular patches, printed on moderately thick substrates, are designed here at 5.8 GHz to comply with the ISM band (5.725-5.875 GHz). Results for radiation pattern, directivity, radiation efficiency, input impedance, reflection coefficient magnitude and broadside axial ratio are presented and discussed.
A nonlinear regression analysis, based on HFSS [13] simulations, is carried out in order to identify the drawbacks of these radiators. Experimental results validate our calculations.
II.
ANTENNA DESIGNFollowing the strategy proposed in [12], CP antennas with elliptical, EWP, and triangular patches
consisting of a 3.048-mm thick Arlon CuClad 250 GX substrate (r = 2.55 and tan = 0.0018) and a
square ground plane (60 mm 60 mm), are designed to operate at 5.8 GHz. This substrate was chosen
because it is the low loss and moderately thick microwave laminate available at LAP’s facility that can comply with the design requirements. The patches are directly fed by 50- SMA connectors (with a
cylindrical 1.3-mm diameter probe). Their geometries are shown in Fig. 1. As seen, antennas with
rectangular and TCR patches are also analyzed. The patch dimensions are given in Table I. Results for radiation patterns are shown in Figs. 2 and 3 whereas their input impedance, reflection coefficient
magnitude, and broadside axial ratio are presented in Fig. 4. As expected, the null reactance condition
permits designing antennas that are perfectly matched to the 50- SMA connector. Consequently, the
radiators present a symmetrical bandwidth with respect to the operating frequency.
x y
W
L x
P
y
P
. x y
L
W
1 C
2 /
x W
P
y P
1 C
L
W
x
P
y
P
x y
Rectangular patch TCRpatch. Elliptical patch.
y
P
L
W
2
x W
P
2 C
x y
1 C
.
L W
x y
y P x P W
EWP patch Triangular patch
Brazilian Microwave and Optoelectronics Society-SBMO received 18 Sep 2017; for review 20 Sep 2017; accepted 28 Dec 2017
Brazilian Society of Electromagnetism-SBMag © 2018 SBMO/SBMag ISSN 2179-1074
TABLE I. PATCH DIMENSIONS (IN MM)
Patch Geometry L W Px Py C1 C2
Rectangular 15.45 13.00 4.45 3.85
TCR 15.75 14.10 7.05 3.20 3.65 Elliptical 18.36 15.18 2.08 4.24
EWP 17.16 15.80 7.90 4.40 3.15 2.72 Triangular 20.40 18.30 4.40 7.30
-30 -20 -10 0 0 30 60 90 120 150 180 210 240 270 300 330 -30 -20 -10 0 Rectangular TCR Elliptical EWP Triangular Nor ma li ze d ra dia ti on pa tt ern [ dB ] (a) -30 -20 -10 0 0 30 60 90 120 150 180 210 240 270 300 330 -30 -20 -10 0 Rectangular TCR Elliptical EWP Triangular Nor ma li ze d r adia ti on pa tt er n [ dB] (b)
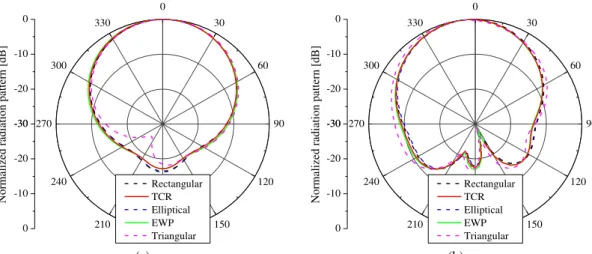
Fig. 2. Radiation pattern plotted in the xz-plane: (a) Ephi component - (b) Etheta component.
-30 -20 -10 0 0 30 60 90 120 150 180 210 240 270 300 330 -30 -20 -10 0 Rectangular TCR Elliptical EWP Triangular Nor ma li ze d ra dia ti on pa tt ern [ dB] (a) -30 -20 -10 0 0 30 60 90 120 150 180 210 240 270 300 330 -30 -20 -10 0 Rectangular TCR Elliptical EWP Triangular Nor ma li ze d ra dia ti on pa tt ern [ dB] (b)
Brazilian Microwave and Optoelectronics Society-SBMO received 18 Sep 2017; for review 20 Sep 2017; accepted 28 Dec 2017
Brazilian Society of Electromagnetism-SBMag © 2018 SBMO/SBMag ISSN 2179-1074
5.0 5.2 5.4 5.6 5.8 6.0 6.2 6.4 6.6
-40 -20 0 20 40 60 80 100 120 140 160 180
Im[Zin]
Input Impe
da
nc
e [
]
Frequency [GHz]
Rectangular TCR Elliptical EWP Triangular
Re[Zin]
(a)
5.0 5.2 5.4 5.6 5.8 6.0 6.2 6.4 6.6
-28.0 -24.5 -21.0 -17.5 -14.0 -10.5 -7.0 -3.5 0.0
Rectangular TCR Elliptical EWP Triangular
|
| [
dB]
Frequency [GHz] (b)
5.4 5.5 5.6 5.7 5.8 5.9 6.0 6.1 6.2
0 2 4 6 8 10 12 14 16
Broa
dsi
de
a
xia
l ra
ti
o [dB]
Frequency [GHz]
Rectangular TCR Elliptical EWP Triangular
(c)
Fig. 4. Simulated results: (a) input impedance - (b) reflection coefficient magnitude - (c) broadside axial ratio.
Moreover, differently from the standard procedure [7], the null reactance condition sets the frequency
of the best broadside axial ratio on the mode controlled by the dimension W of the patch (W < L). Thus, it is intuitive to state that variations of this dimension can significantly affect the electrical
characteristics of the antenna. In order to verify this statement, a performance analysis is carried out in Section 3.
To complete the comparative analysis, the directivity, radiation efficiency (RE), broadside axial ratio
bandwidth (ARBW) and reflection coefficient bandwidth (RCBW) of the five antennas are also calculated. Results are given in Table II. As seen, the electrical characteristics of the antennas are
similar, except for the triangular one - its operating bandwidth is slightly narrower than the others and the radiation patterns, in xz-plane, are asymmetrical, as shown in Figs. 2(a) and 2(b).
TABLE II. ELECTRICAL CHARACTERISTICS
Rectangular TCR Elliptical EWP Triangular
Brazilian Microwave and Optoelectronics Society-SBMO received 18 Sep 2017; for review 20 Sep 2017; accepted 28 Dec 2017
Brazilian Society of Electromagnetism-SBMag © 2018 SBMO/SBMag ISSN 2179-1074
III.
NONLINEAR REGRESSION ANALYSISIn order to improve the comparison analysis, a nonlinear regression was carried out using the HFSS
software. The purpose of this analysis was to determine which of the patches shown in Fig. 1 is the most robust in the manufacturing process. The results presented in Table II show that the return loss
bandwidths are approximately four times larger than the broadside axial ratio ones. Consequently, small variations in the patch dimensions should not substantially affect the antenna return loss
characteristic. Thus, only the broadside axial ratio was considered in the nonlinear regression analysis. Two important effects were investigated: the frequency deviation (f), defined as the difference
between the operating frequency (fo) and the best broadside axial ratio deviated frequency (fd), and the
broadside axial ratio degradation, denoted by AR. These parameters are illustrated in Fig. 5.
0 3 6 9 12 15 18 21
Designed antenna Antenna (regression)
fd
fo
Broa
dside
a
xia
l ra
ti
o [
dB]
Frequency
AR
Fig. 5. Broadside axial ratio as function of frequency.
For the antennas under consideration, the quadratic regression coefficients were obtained from the HFSS
Sensitivity analysis according to the following steps. The first one consists of the sensitivity analysis of the
variables shown in Table I. This procedure is carried out in a local variable window, where the maximum
and minimum values of these variables, as well as the initial displacement, are defined. For the present case, it was supposed that the antenna dimension and the probe position can move 0.05 mm around the
nominal values. Next, an Optometrics Sensitivity simulation was carried out for each antenna. The maximum number of iterations was set as five, since that was sufficient to produce stable results in a satisfactory computing time. Additionally, using the Setup Calculations tab, the quadratic regression
output (broadside axial ratio degradation and frequency deviation) was added by means of functions (min(…) and XAtYMin(…)).Finally, after extensive simulation, the regression coefficients were obtained.
According to [14], the expression for calculating the quadratic regression is given by (1), which can
be rewritten as (2), now with respect to the nominal value of the independent variable. In (2), 1 and 2 are the regression coefficients. The relative value ∆x/xo = 0.001 is equivalent to 0.1% deviation (in absolute value) of the antenna dimension.
2 o 2
o 2
o o
o ( )
) ( 2 1 ) ( ) ( )
( x x
x d
x f d x
x x d
x f d x f
Brazilian Microwave and Optoelectronics Society-SBMO received 18 Sep 2017; for review 20 Sep 2017; accepted 28 Dec 2017
Brazilian Society of Electromagnetism-SBMag © 2018 SBMO/SBMag ISSN 2179-1074
2 o 2 o 2 o o 1
o x ( x/x ) x ( x/x )
f
f
.
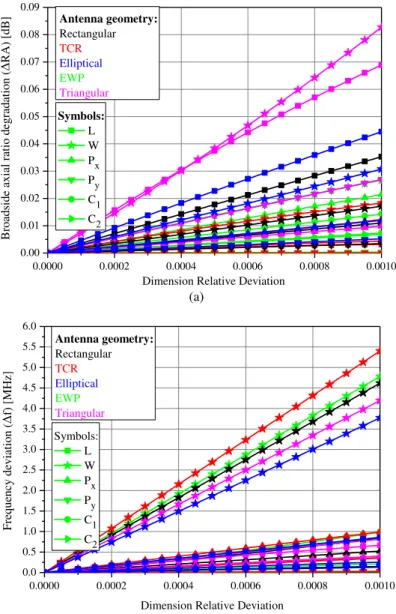
(2)Introducing (2) in Mathematica [15], graphics of axial ratio degradation and axial ratio frequency
deviation (with respect to the operation frequency) can be plotted. Figure 6(a) indicates the triangular patch is the most sensible to the dimension deviation - its axial ratio degrades sooner than the others. Furthermore, antennas with TCR and EWP patches are more stable with respect to the dimension
deviations. On the other hand, Fig. 6(b) shows that the frequency deviations behave similarly. A small error in the manufacturing process of the patch dimension W can produce a significant shift in the
operating frequency. That is expected from the fact the frequency of best broadside axial ratio corresponds to the mode controlled by the dimension W (W < L), as previously mentioned.
0.0000 0.0002 0.0004 0.0006 0.0008 0.0010
0.00 0.01 0.02 0.03 0.04 0.05 0.06 0.07 0.08 0.09
Symbols:
L W Px Py C1 C2
Antenna geometry:
Rectangular
TCR
Elliptical
EWP Triangular
Dimension Relative Deviation
B
ro
ad
si
de ax
ial
r
at
io
d
eg
rad
at
io
n
(
R
A
)
[d
B
]
(a)
0.0000 0.0002 0.0004 0.0006 0.0008 0.0010
0.0 0.5 1.0 1.5 2.0 2.5 3.0 3.5 4.0 4.5 5.0 5.5 6.0
Antenna geometry:
Rectangular
TCR
Elliptical
EWP Triangular
F
re
qu
en
cy
d
ev
ia
ti
on
(
f)
[
M
H
z]
Dimension Relative Deviation Symbols:
L W Px Py C1 C2
(
b)Fig. 6. Quadratic regression results: (a) – broadside axial ratio degradation; (b) – broadside axial ratio frequency deviation.
IV.
PROTOTYPESIn order to validate the proposed design criterion, antennas were prototyped at LAP’s facility using
Brazilian Microwave and Optoelectronics Society-SBMO received 18 Sep 2017; for review 20 Sep 2017; accepted 28 Dec 2017
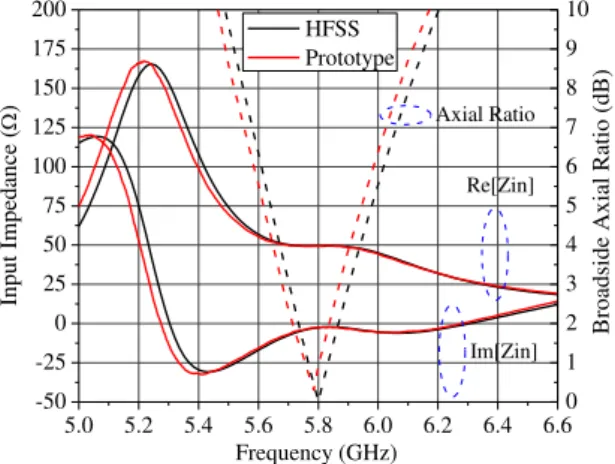
Brazilian Society of Electromagnetism-SBMag © 2018 SBMO/SBMag ISSN 2179-1074 and broadside axial ratio measurements were conducted inside the DCTA-IFI anechoic chamber. Pictures of the prototypes are shown in Fig. 7, as well as the measured results compared with the simulated ones. Very good agreement is observed. Results for the frequency deviation and the broadside
axial ratio degradation are compiled in Table III. As seen, the antennas with rectangular and TCR patches do not exhibit frequency deviation.
Rectangular patch.
5.0 5.2 5.4 5.6 5.8 6.0 6.2 6.4 6.6 -50
-25 0 25 50 75 100 125 150 175 200
Axial Ratio
Broadside Axial Ratio
(dB)
Input Impedance (
)
Frequency (GHz) HFSS Prototype
Re[Zin]
Im[Zin]
0 1 2 3 4 5 6 7 8 9 10
Comparison between experimental and simulated results.
TCR patch.
5.0 5.2 5.4 5.6 5.8 6.0 6.2 6.4 6.6 -50
-25 0 25 50 75 100 125 150 175 200
Input Impedance (
)
Broadside Axial Ratio (dB)
Frequency (GHz)
Im[Zin] Re[Zin] Axial Ratio
HFSS Prototype
0 1 2 3 4 5 6 7 8 9 10
Comparison between experimental and simulated results.
Elliptical patch.
5.0 5.2 5.4 5.6 5.8 6.0 6.2 6.4 6.6 -50
-25 0 25 50 75 100 125 150 175 200
Input Impedance (
)
Frequency (GHz)
Broadside Axial Ratio
(dB)
Axial Ratio
Re[Zin]
Im[Zin]
HFSS Prototype
0 1 2 3 4 5 6 7 8 9 10
Brazilian Microwave and Optoelectronics Society-SBMO received 18 Sep 2017; for review 20 Sep 2017; accepted 28 Dec 2017
Brazilian Society of Electromagnetism-SBMag © 2018 SBMO/SBMag ISSN 2179-1074 EWP patch.
5.0 5.2 5.4 5.6 5.8 6.0 6.2 6.4 6.6 -50
-25 0 25 50 75 100 125 150 175 200
HFSS Prototype
Input Impedance (
)
Broadside Axial Rati
o (dB)
Frequency (GHz)
Im[Zin] Re[Zin] Axial Ratio
0 1 2 3 4 5 6 7 8 9 10
Comparison between experimental and simulated results.
Triangular patch.
5.0 5.2 5.4 5.6 5.8 6.0 6.2 6.4 6.6 -50
-25 0 25 50 75 100 125 150 175 200
Input Impedance (
)
HFSS Prototype
Axial Ratio
Re[Zin]
Im[Zin] Broadside Axial Ratio
(dB)
Frequency (GHz)
0 1 2 3 4 5 6 7 8 9 10
Comparison between experimental and simulated results. Fig. 7. Pictures of the prototypes (left column) and graphics for input impedance and broadside axial ratio (right column).
TABLE III. MEASURED RESULTS FOR F AND BROADSIDE AR
Rectangular TCR Elliptical EWP Triangular
f (MHz) 0.0 0.0 10.0 15.0 50.0
AR (dB) 1.0 0.0 0.8 0.3 1.4
In accordance with the regression analysis, it was noticed that the patches with geometrical perturbation suffer less axial ratio degradation than the others. Moreover, it can see from Fig. 7 that the triangular
antenna exhibits the worst performance whereas the TCR microstrip radiator presents the best one.
V.
FINAL COMMENTSA comprehensive analysis of probe-fed, circularly-polarized microstrip antennas on moderately thick substrates, designed according to the null reactance condition, was carried out in this paper.
Typical patch geometries - i.e. rectangular, TCR, elliptical, EWP and triangular - were considered. A nonlinear regression was implemented in HFSS in order to identify, among the CP antennas, the most
robust geometry in terms of the manufacturing process. Electrical characteristics, such as radiation pattern, directivity, radiation efficiency, input impedance, reflection coefficient magnitude, and
Brazilian Microwave and Optoelectronics Society-SBMO received 18 Sep 2017; for review 20 Sep 2017; accepted 28 Dec 2017
Brazilian Society of Electromagnetism-SBMag © 2018 SBMO/SBMag ISSN 2179-1074 and tested. Very good agreement between simulated and measured results was obtained. Based on extensive analyses and tests, we can state that the TCR geometry is a robust topology for designing and manufacturing probe-fed CP microstrip antenna on moderately thick substrate.
ACKNOWLEDGMENT
The authors would like to thank CNPq for sponsoring Project 402017/2013-7, DCTA- IFI for providing the use of the anechoic chamber, and Dr. Nilson Rabelo for assistance in preparing this
article.
REFERENCES
[1] Kin-Lu Wong, Design of Nonplanar Microstrip Antennas and Transmission Lines, New York: John Wiley, 1999. [2] R. Garg, P. Bhartia, I. Bahl, and A. Ittipiboon, Microstrip Antenna Design Handbook, Norwood, MA: Artech House,
2001.
[3] J. L. Volakis, Ed., Antenna Engineering Handbook, 4th ed. New York: McGraw-Hill, 2007. [4] K. L. Lee and K. M. Luk., Microstrip Patch Antennas, 1st ed. Imperial College Press, 2011.
[5] D. C. Nascimento and J. C. S. Lacava, “Probe-fed linearly-polarized electrically-equivalent microstrip antennas on FR4 substrates,” Journal of Microwaves, Optoelectronics and Electromagnetic Applications, Vol. 13, No. 1, pp. 55-66, June 2014.
[6] D. C. Nascimento and J. C. S. Lacava, “Design of arrays of linearly polarized patch antennas on an FR4 substrate: design of a probe-fed electrically equivalent microstrip radiator,” IEEE Antennas and Propagation Magazine Vol. 57, No. 4, pp. 12-22, Aug. 2015.
[7] F. Lumini, L. Cividanes, and J. C. S. Lacava, “Computer aided design algorithm for singly fed circularly polarized rectangular microstrip patch antennas,” International Journal of RF and Microwave Computer-Aided Engineering, Vol. 9, No. 1, pp. 32-41, Jan. 1999.
[8] E. Chang, S. A. Long, and F. R. William, “An experimental investigation of electrically thick rectangular microstrip antennas,” IEEE Transactions on Antennas and Propagation, Vol 34, No. 6, pp. 767-772, June 1993.
[9] J. M. Kovitz and Y. Rahmat-Samii, “Using thick substrates and capacitive probe compensation to enhance the bandwidth of tradicional CP patches antennas,” IEEE Transactions on Antennas and Propagation, Vol. 62, No. 10, pp. 12-22, Aug. 2015.
[10]D. C. Nascimento, R. Schildberg, and J. C. S. Lacava, “Design of probe-fed circularly-polarized rectangular-patch thick microstrip antenna revisited,” IEEE AP-S International Symposium, Toronto, Canada, July 2010.
[11]D. C. Nascimento, R. Schildberg, and J. C. S. Lacava, “Design of low-cost antennas for Globalstar applications,”
Progress In Electromagnetics Research Symposium, Cambridge, MA, USA, pp.200-203, July 2010.
[12]D. C. Nascimento and J. C. S. Lacava, “Design of low-cost probe-fed microstrip antennas,” In: Microstrip Antennas, Nasimuddin (Ed.), chapter 01, pp. 01-26, Rijeka, Croatia: Intech, 2011.
[13]ANSYS Inc. HFSS. [Online]. Available: http://www.ansys.com/Products/Electronics/ANSYS+HFSS. [14]G. A. F. Seber and C. J. Wild, Nonlinear Regression, 1st ed. Wiley-Blackwell, 2003.